

Bottom line, a 50 bps rate hike is back on the table. We got the backtest we expected, and even a little bit more.  This morning’s ADP employment report further underscores the need to put the brakes on the economy. It will be interesting to see whether Powell’s tone becomes any less hawkish in light of yesterday’s sell off.
continued for members…
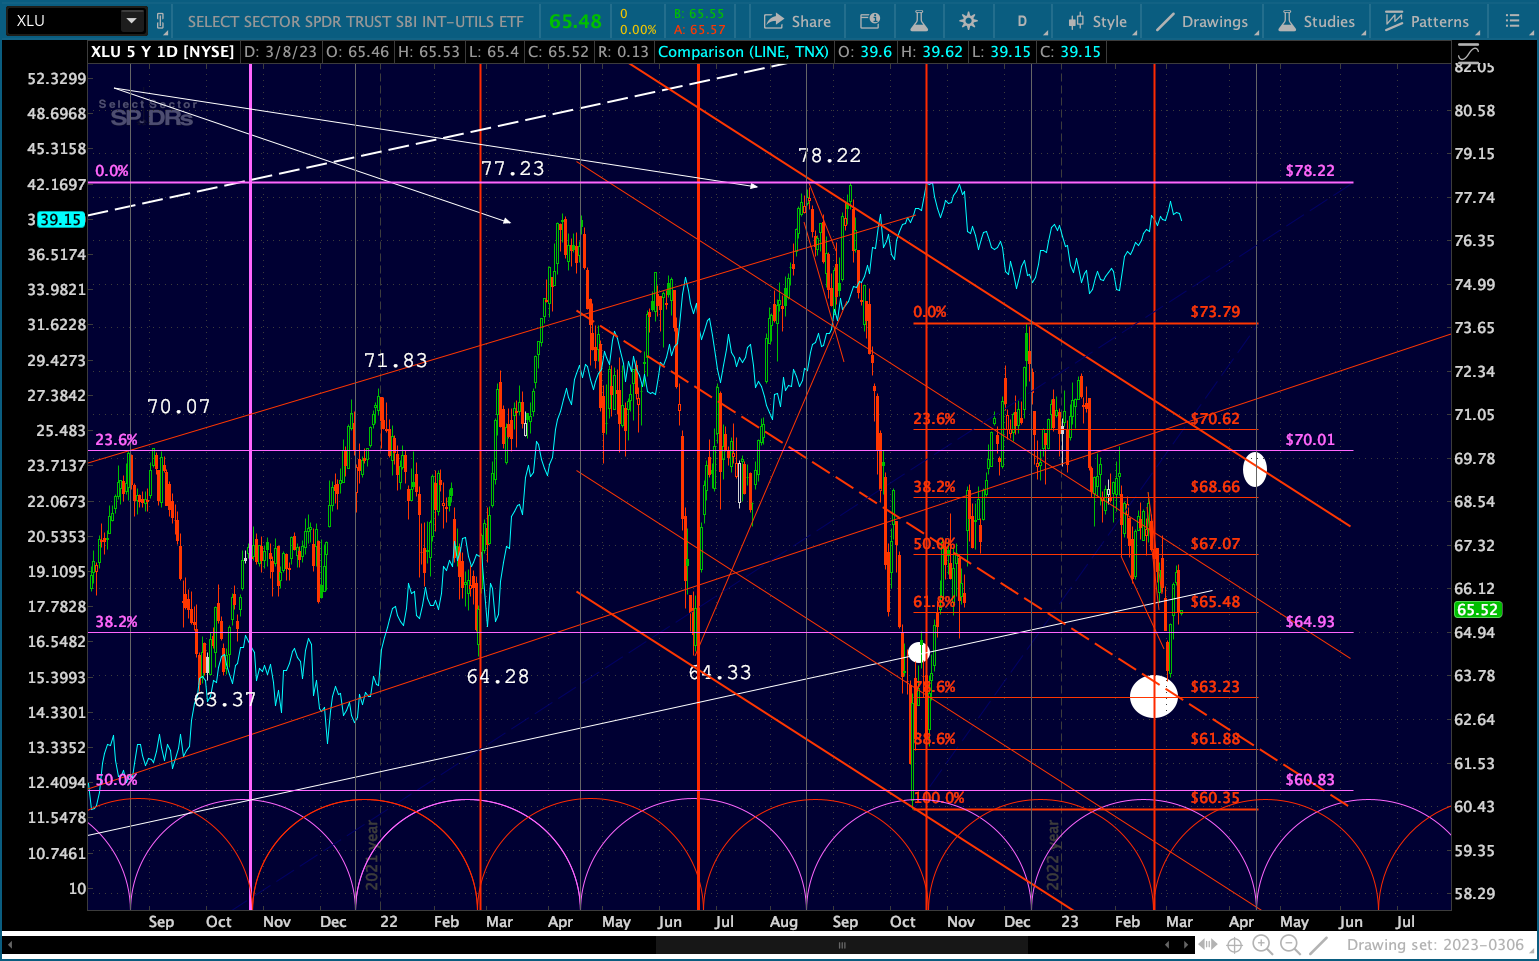
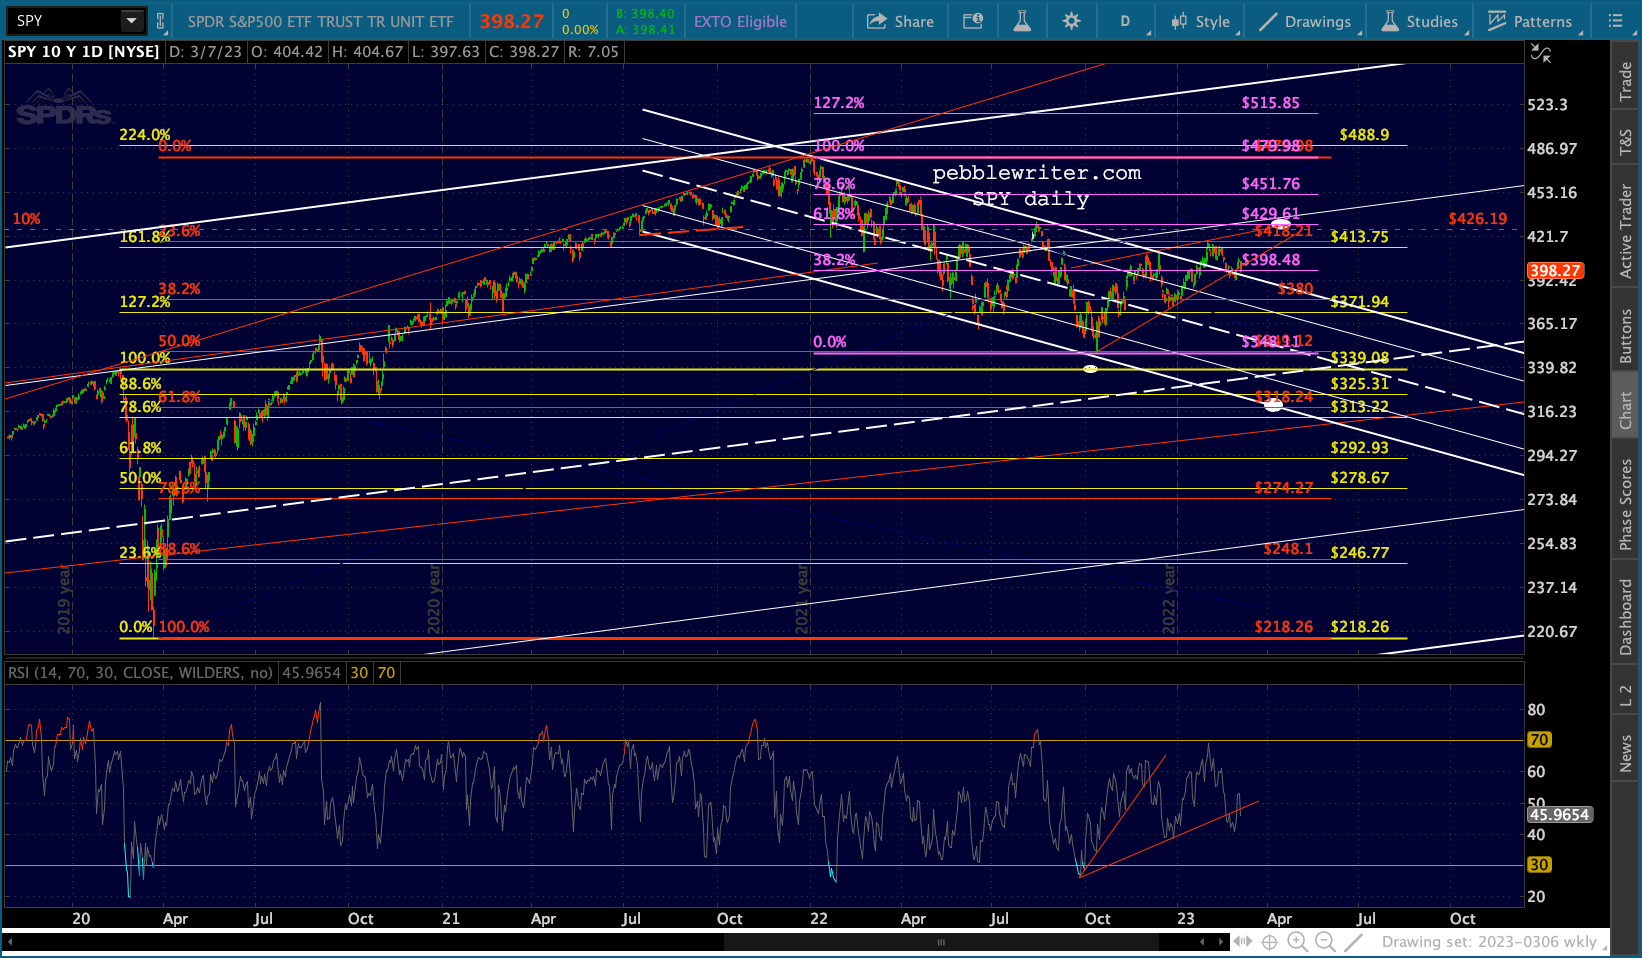
The XLU cycle suggests the next high for stocks will be around Apr 17. The pricing is much more complicated. But, a fairly bullish scenario would be a rebound back to the red channel top around 70.
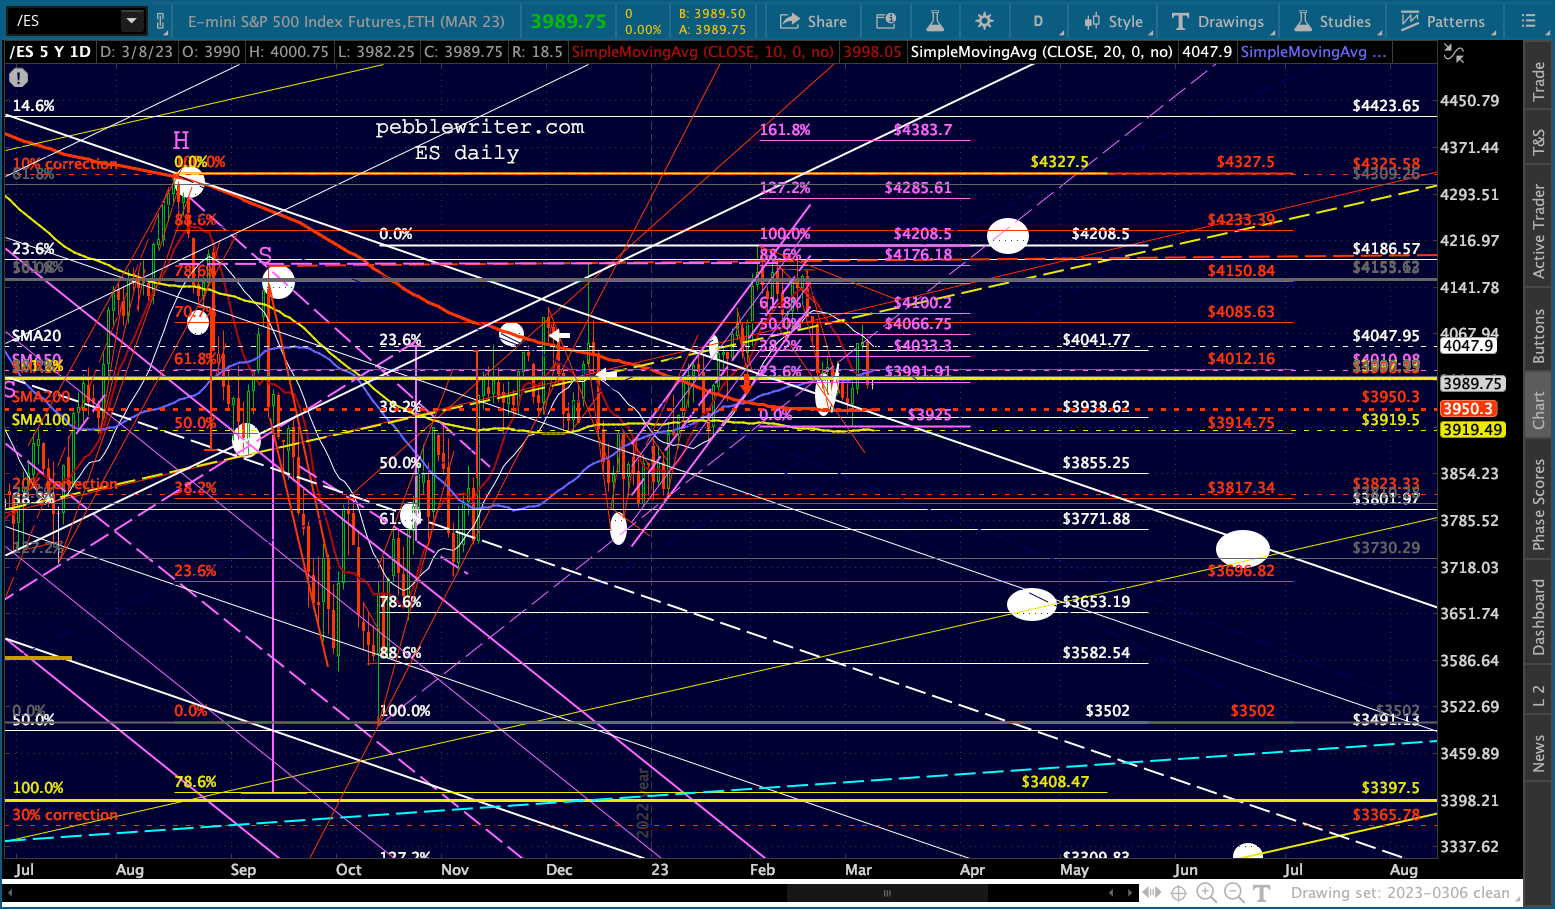
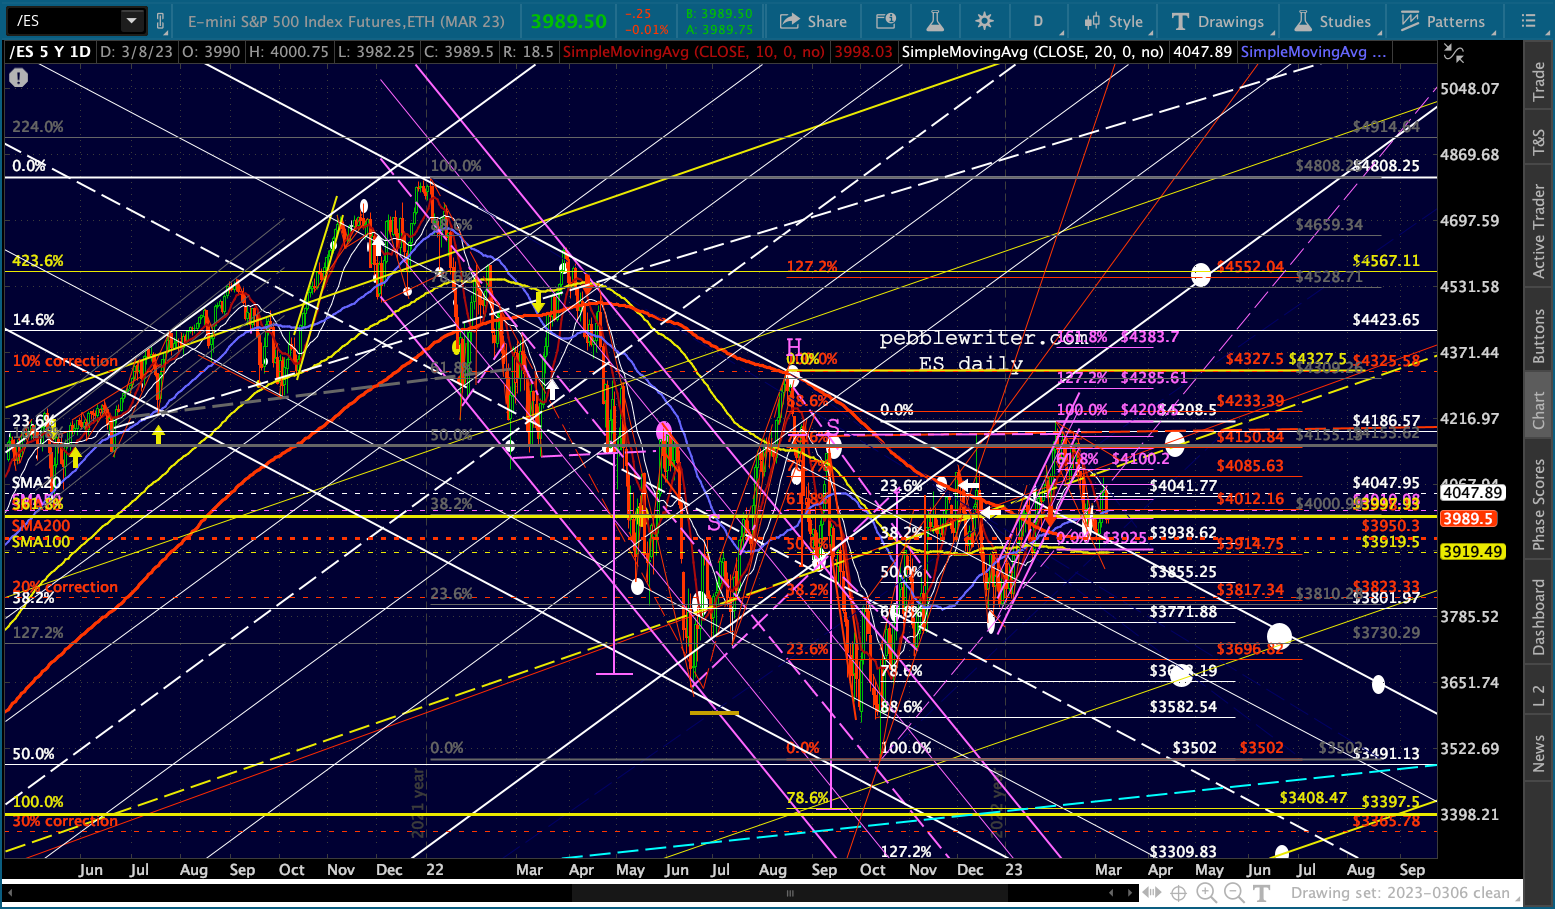
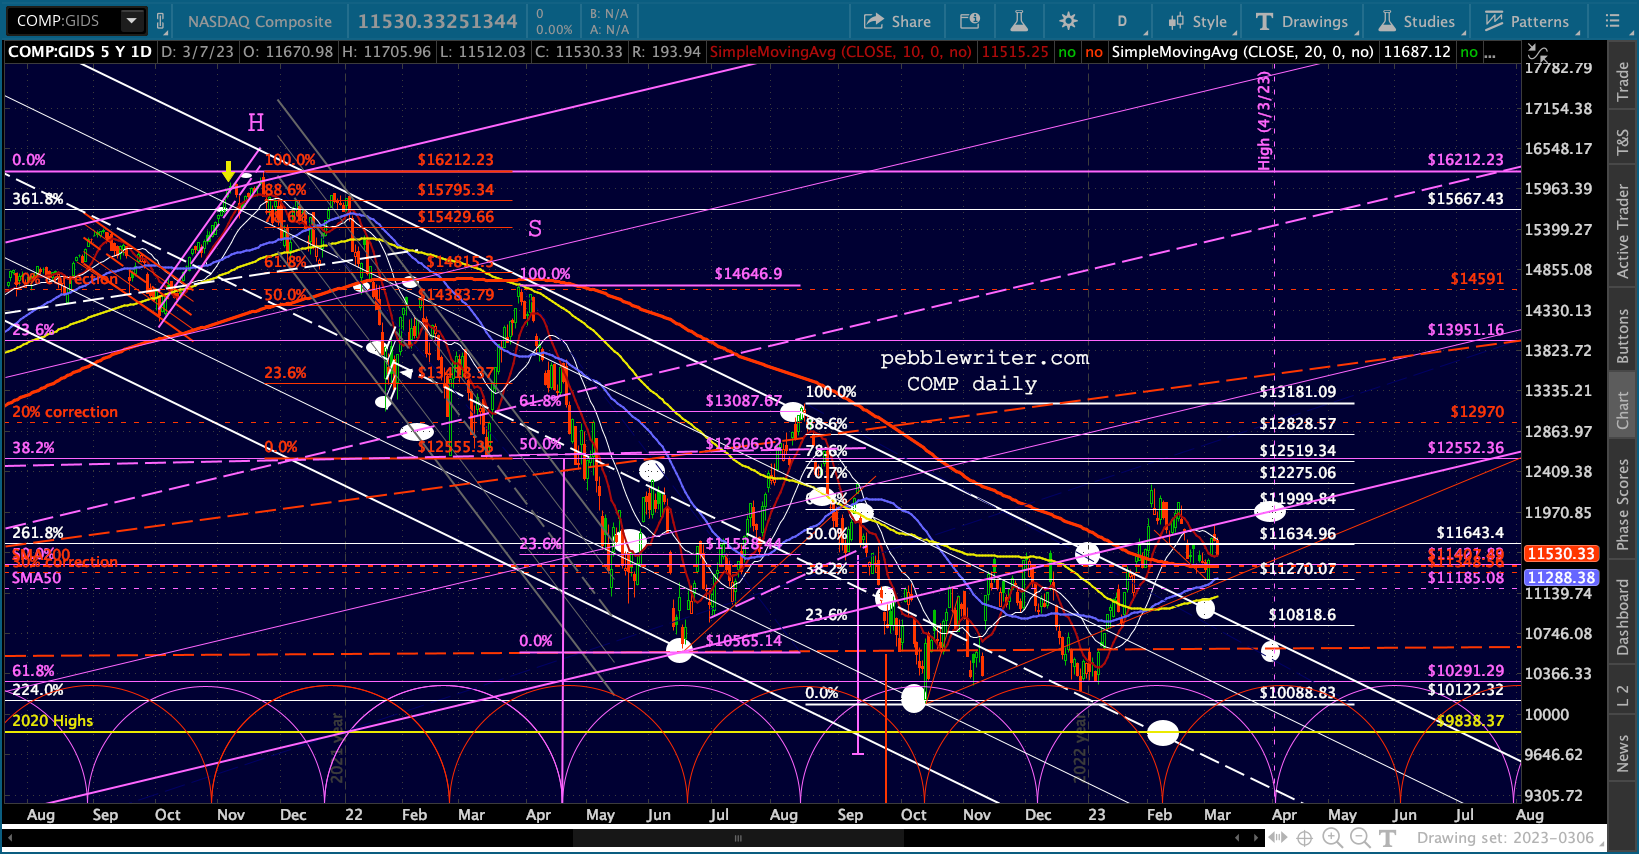
 SPX has obviously given up the neckline for the IH&S (in white) targeting 4712ish. If it were able to climb back above 4088, that scenario – no matter how unlikely such a rally is – would be officially back on the table.
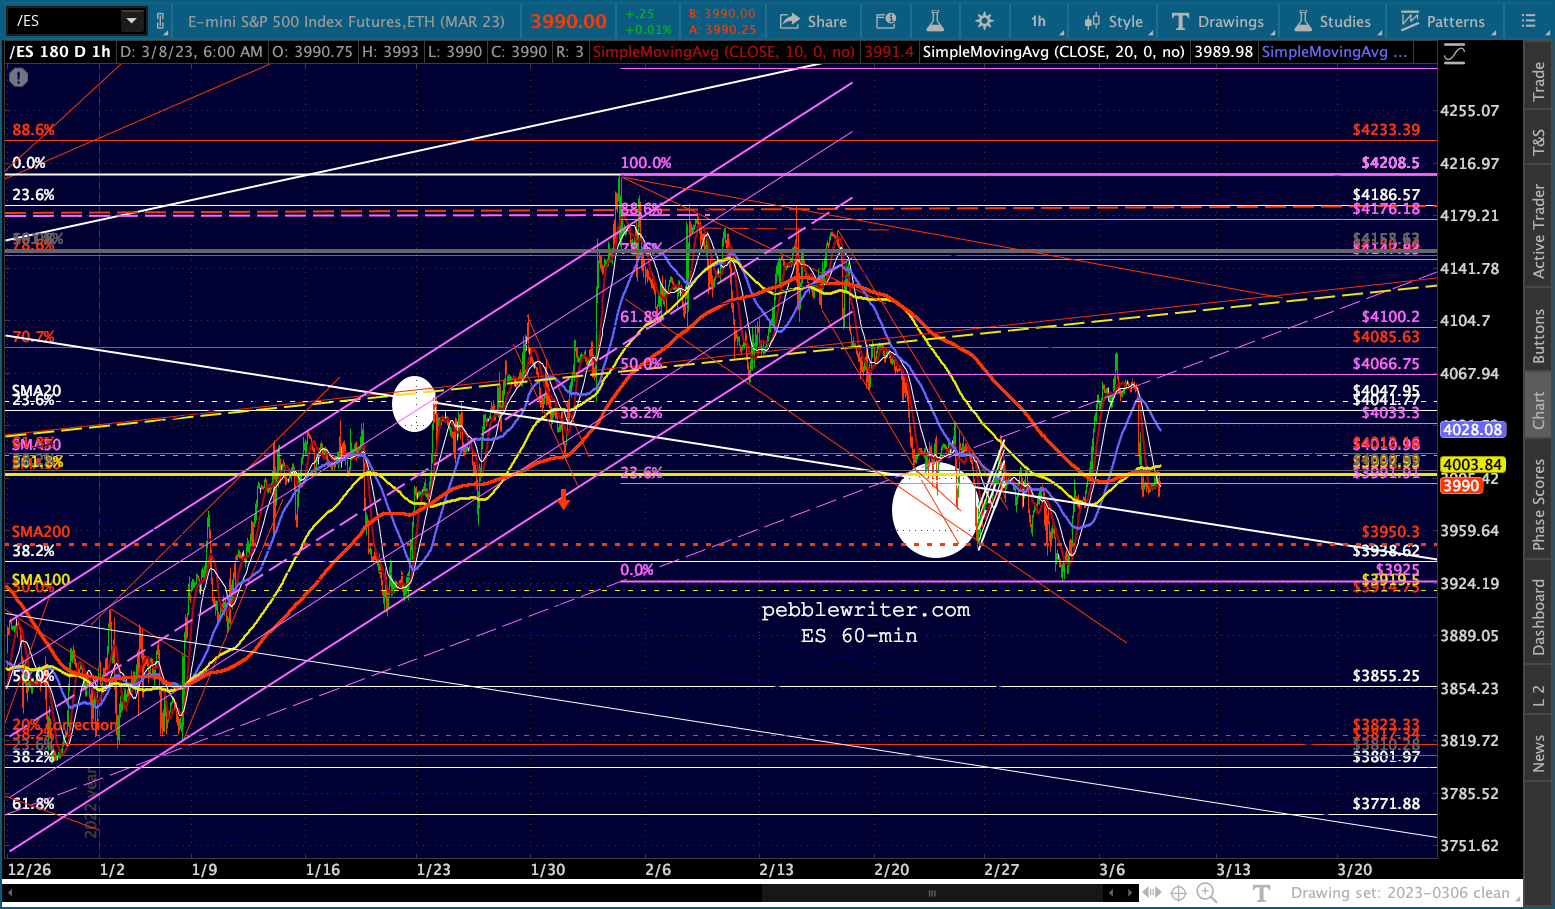
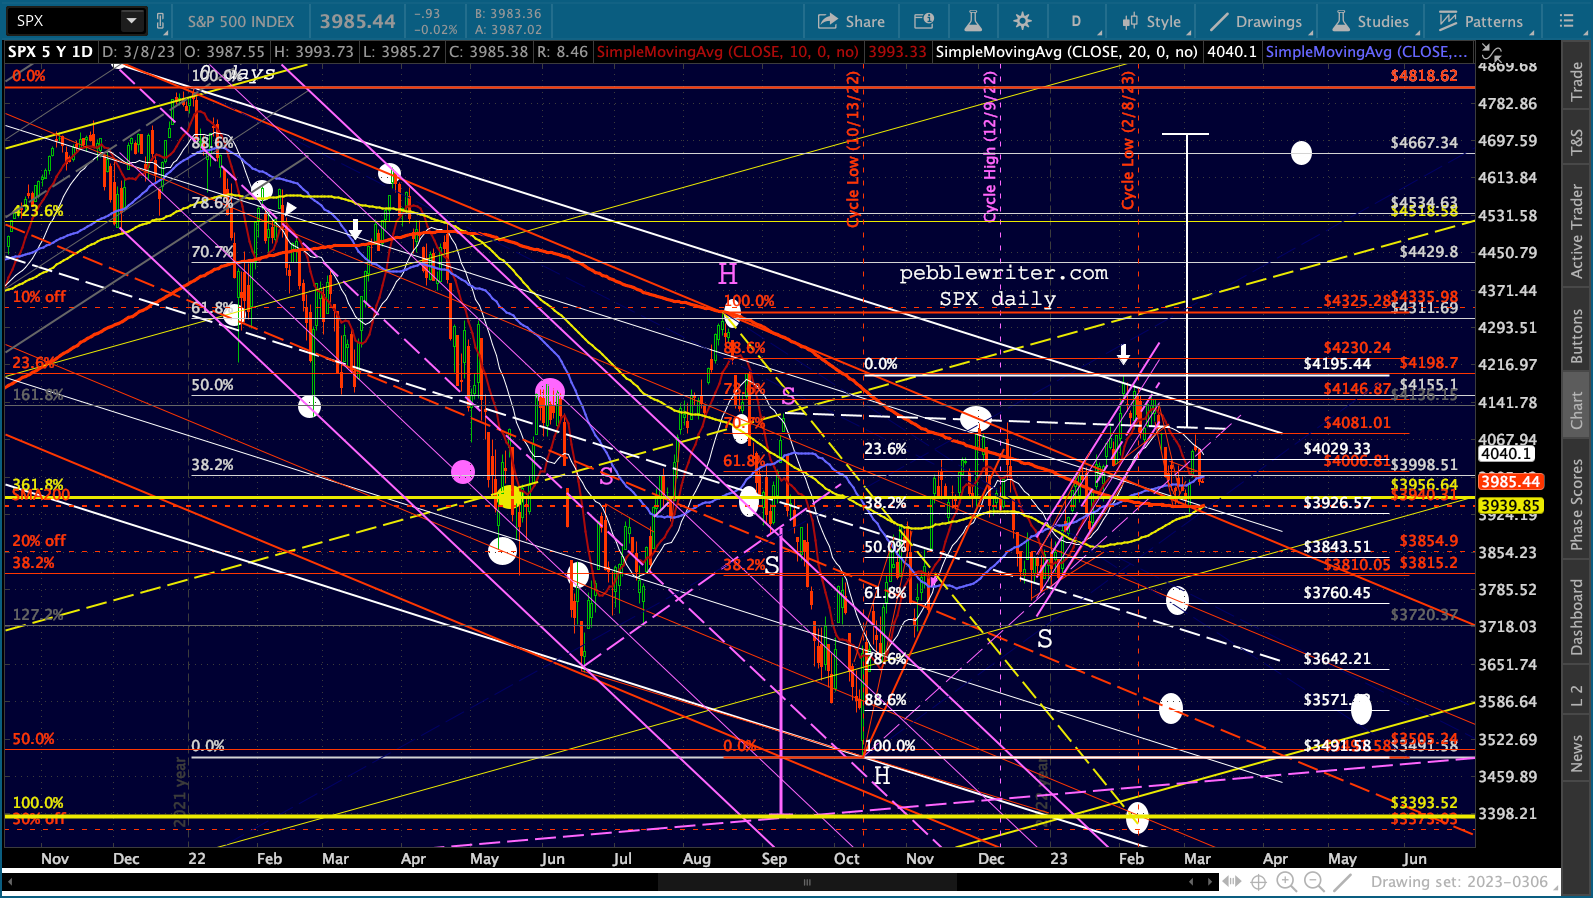 Keep in mind that CPI and PPI come out on Mar 14 and 15 respectively. And, OPEX is on the 17th. The charts show that there is a decent looking channel shaping up. Again, no telling whether it can be realized. Much will depend on what Powell has to say today.
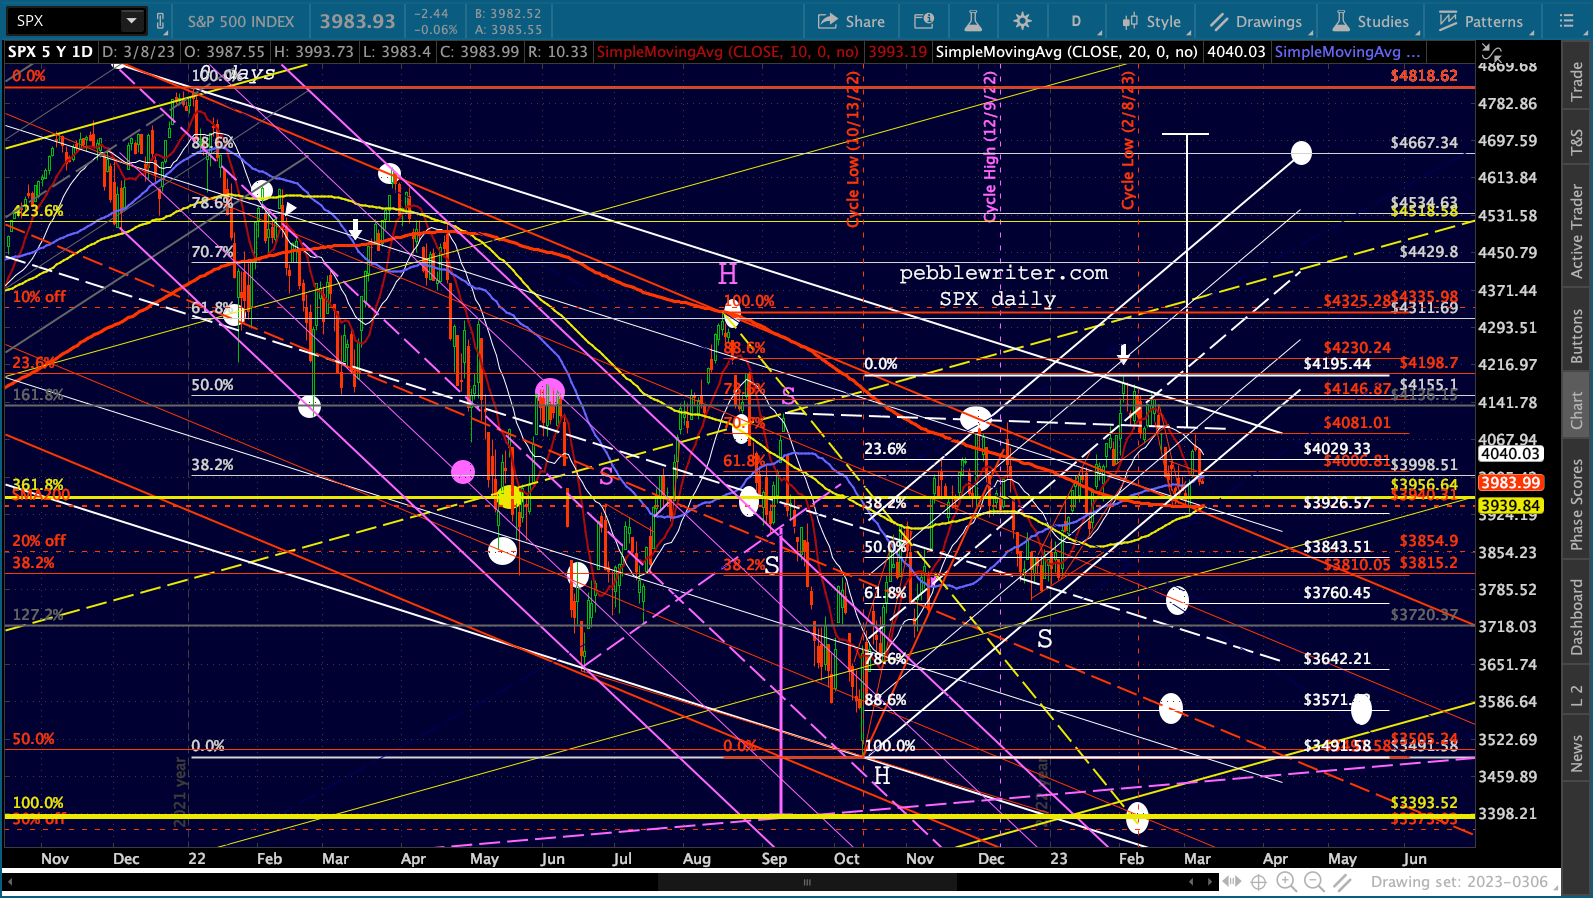 This morning’s charts:
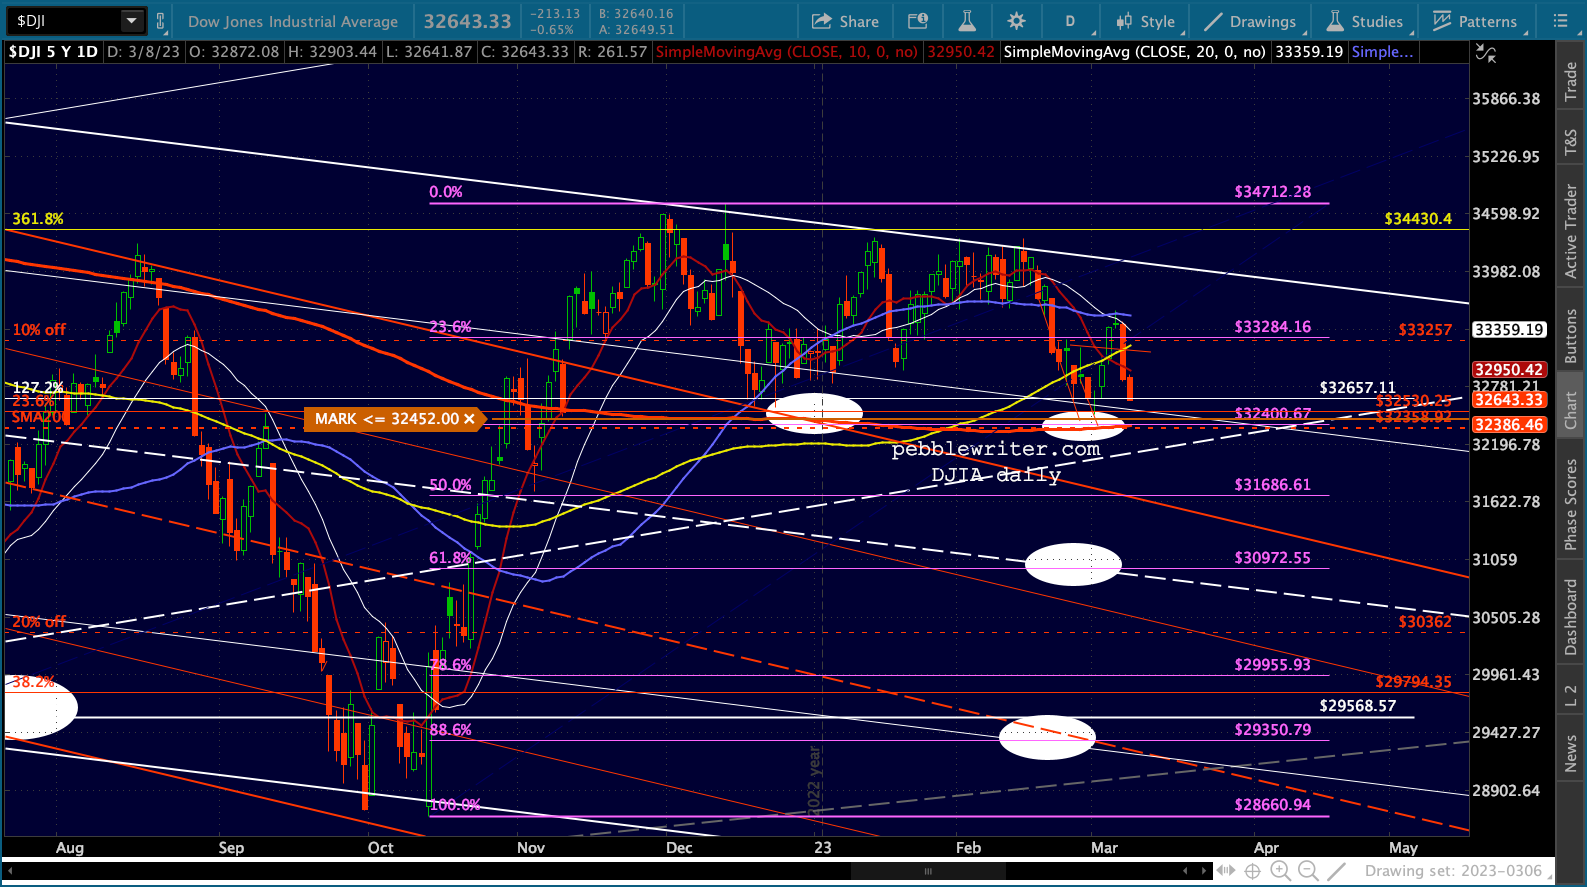
 The Dow still hasn’t backtested its SMA200…
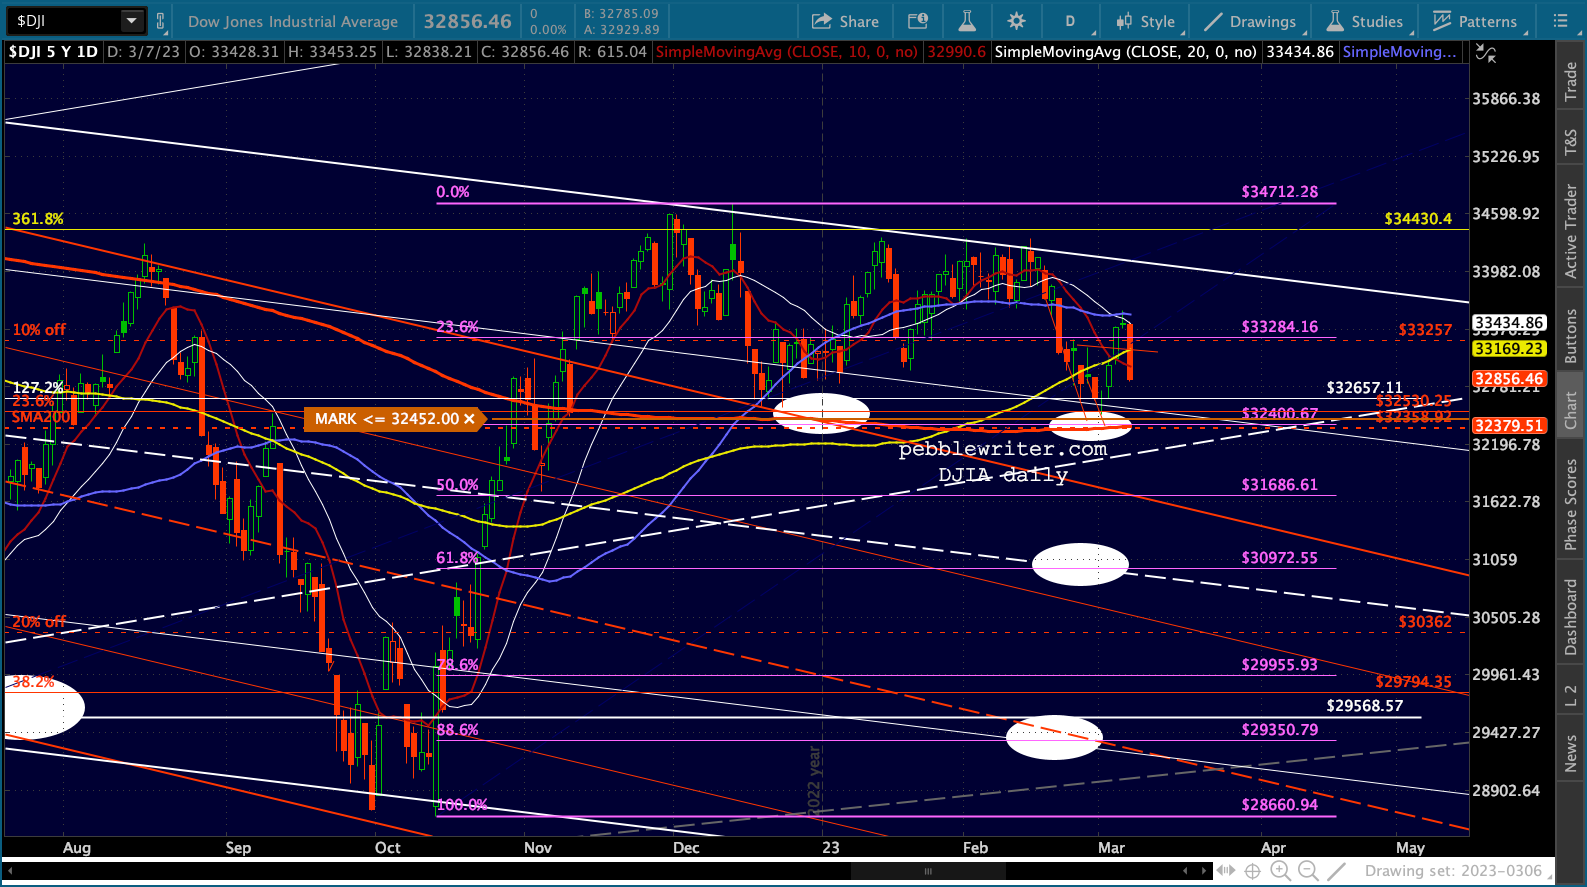 As always, VIX should have a lot to say about what happens next. A strong decline to or below the red TL would attract a lot of algo bullishness.
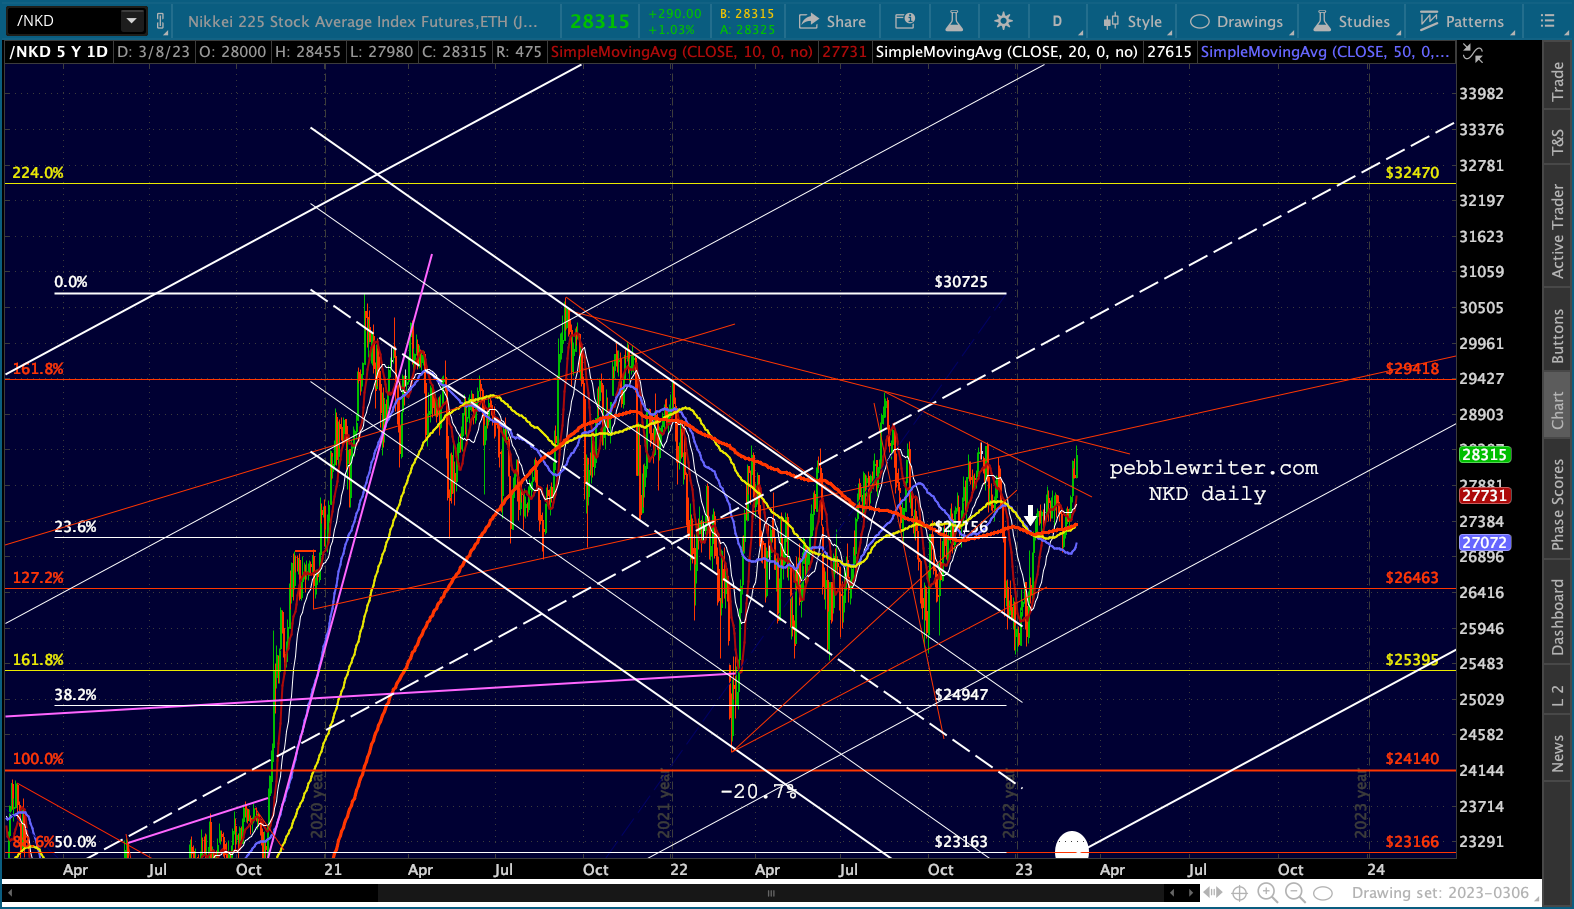
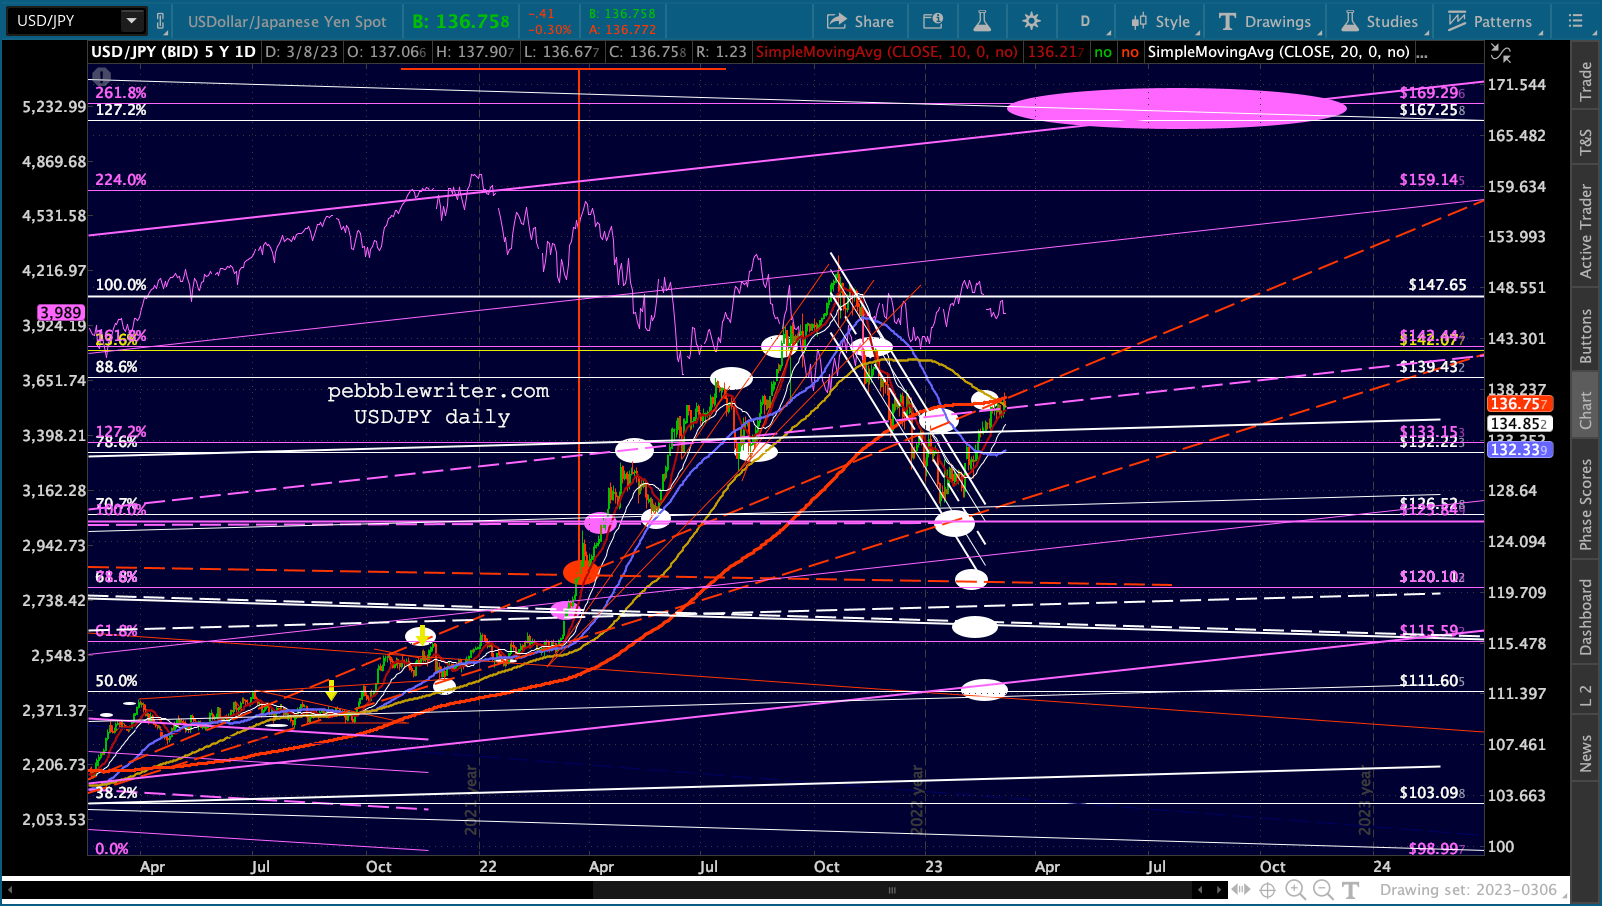
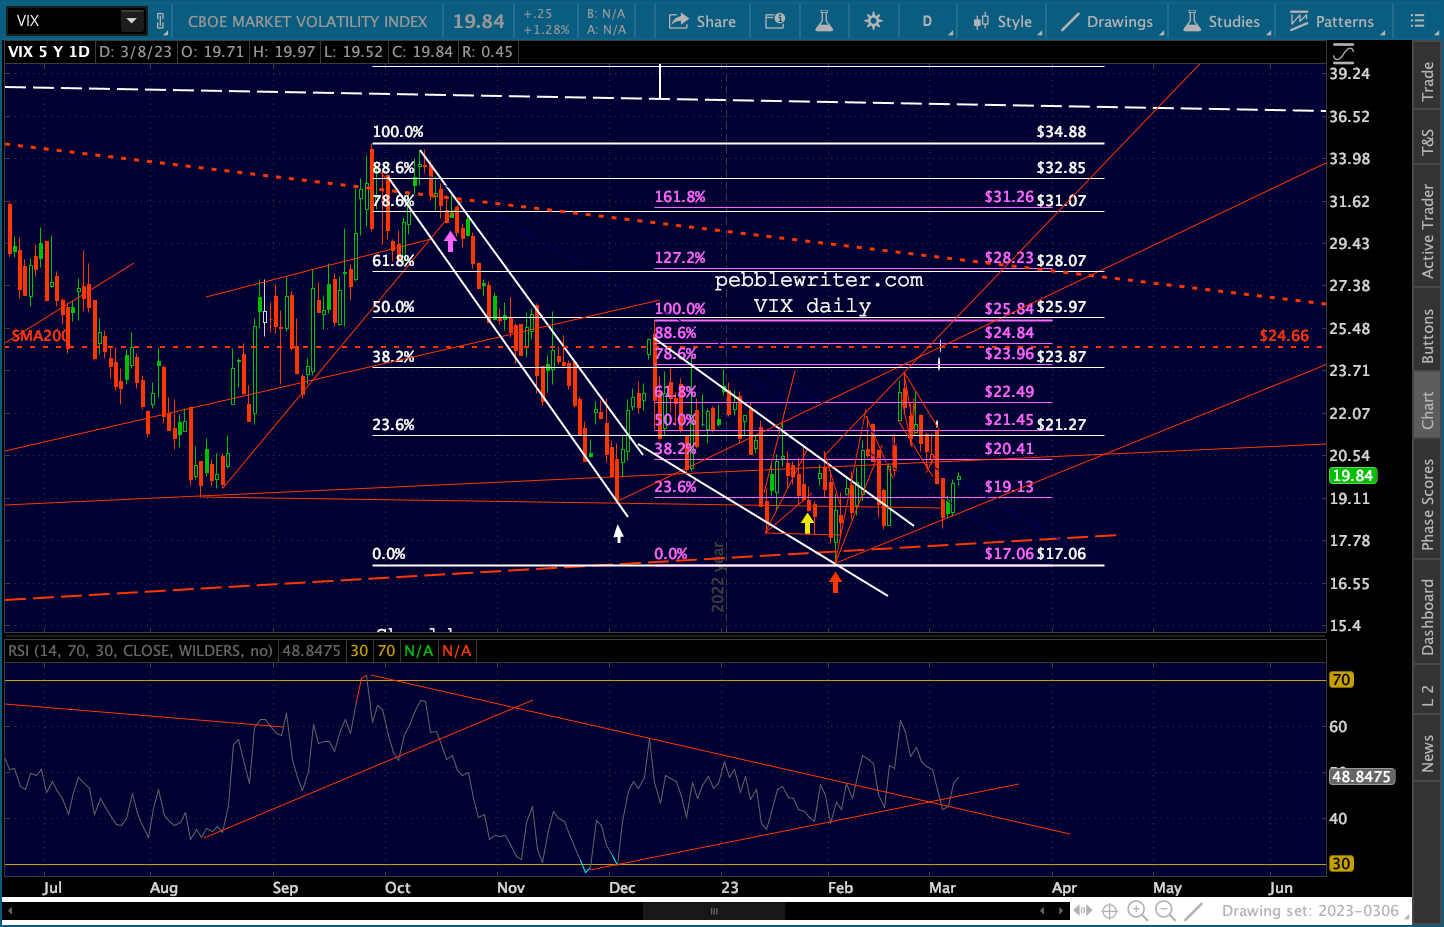 The USDJPY is also at a crucial point. NKD broke out of a shorter-term TL only to land at a longer-term TL of resistance. Since the NKD is back above itsSMA200, we can assume the BoJ wants to keep it that way and there’s a very good chance that USDJPY will be pushed up to our 167-169 target.
 EURUSD is at reasonable support, but is still vulnerable to the SMA200 at 1.0326. A drop down there that allowed DJI to test its SMA200 would be a smart move for TPTB.
 This would allow DXY to remain in its falling white channel – a net positive for stocks.
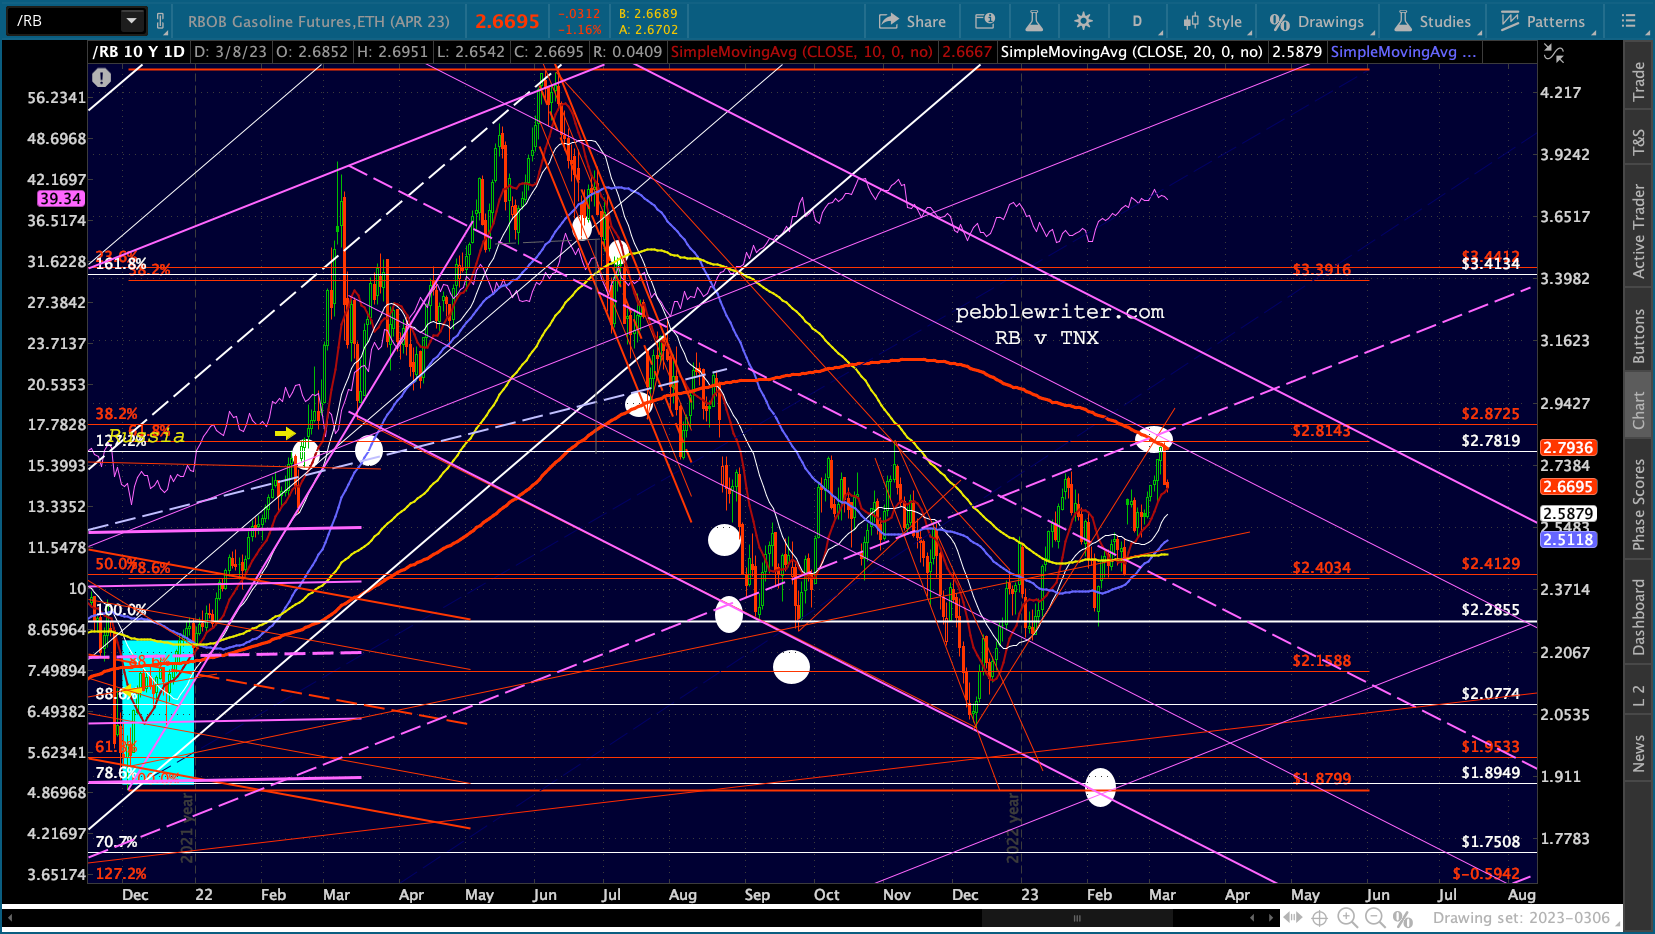
 CL and RB have both given up the gains seen earlier this week – CL at its SMA100 and RB at its SMA200.
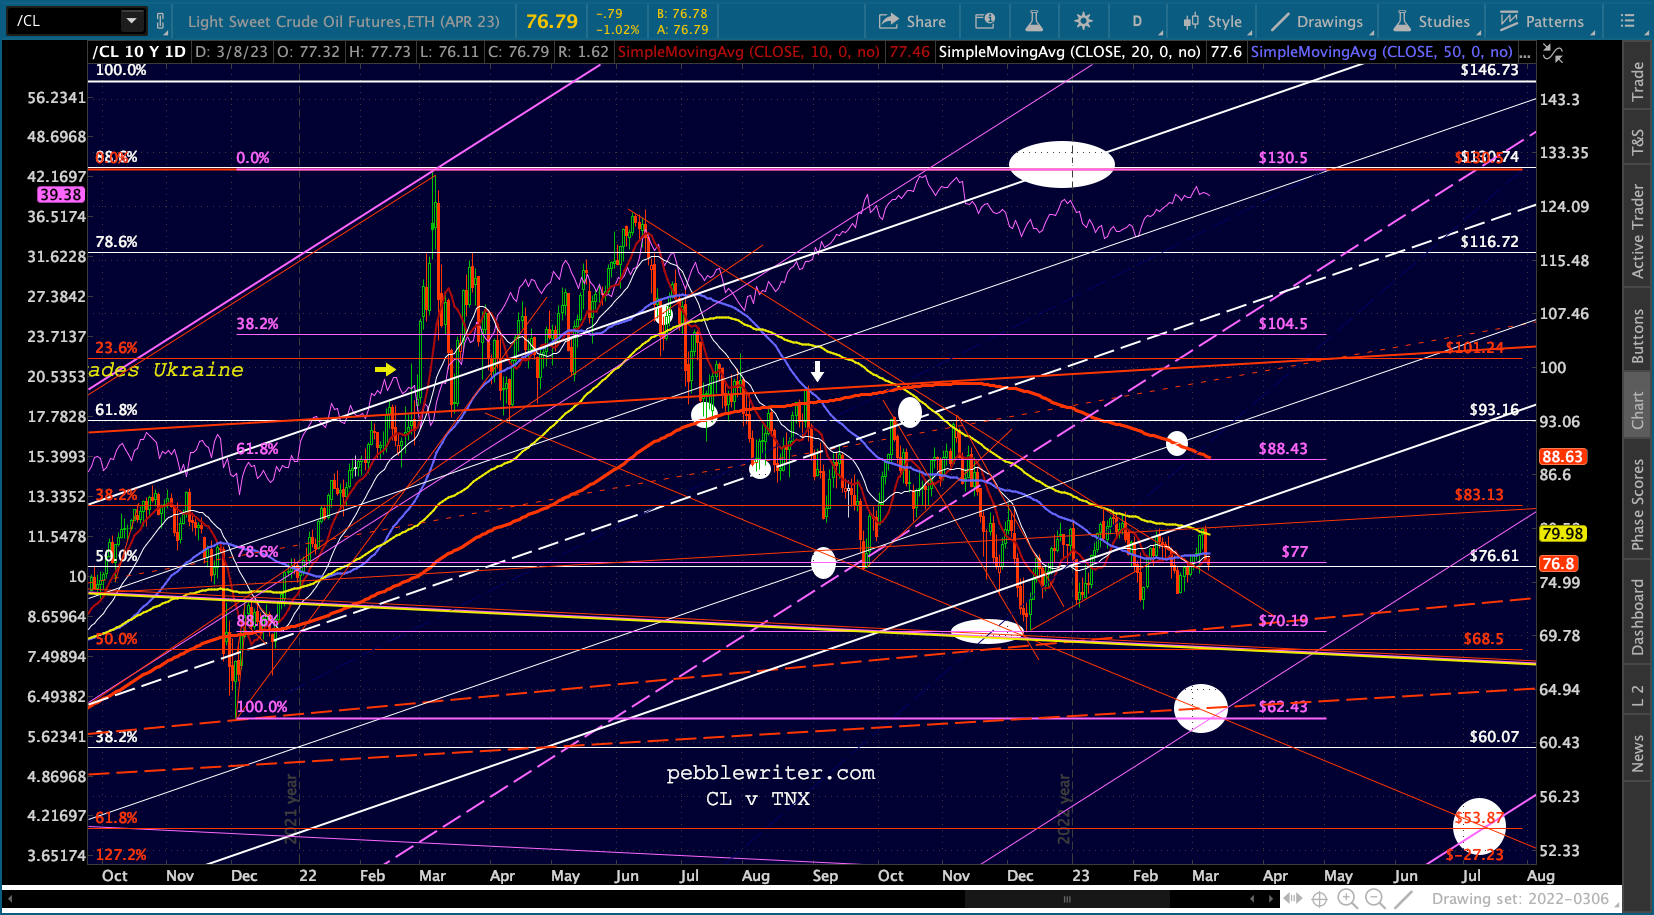
 While the 10Y remains in the same range it’s been in since Feb 21…
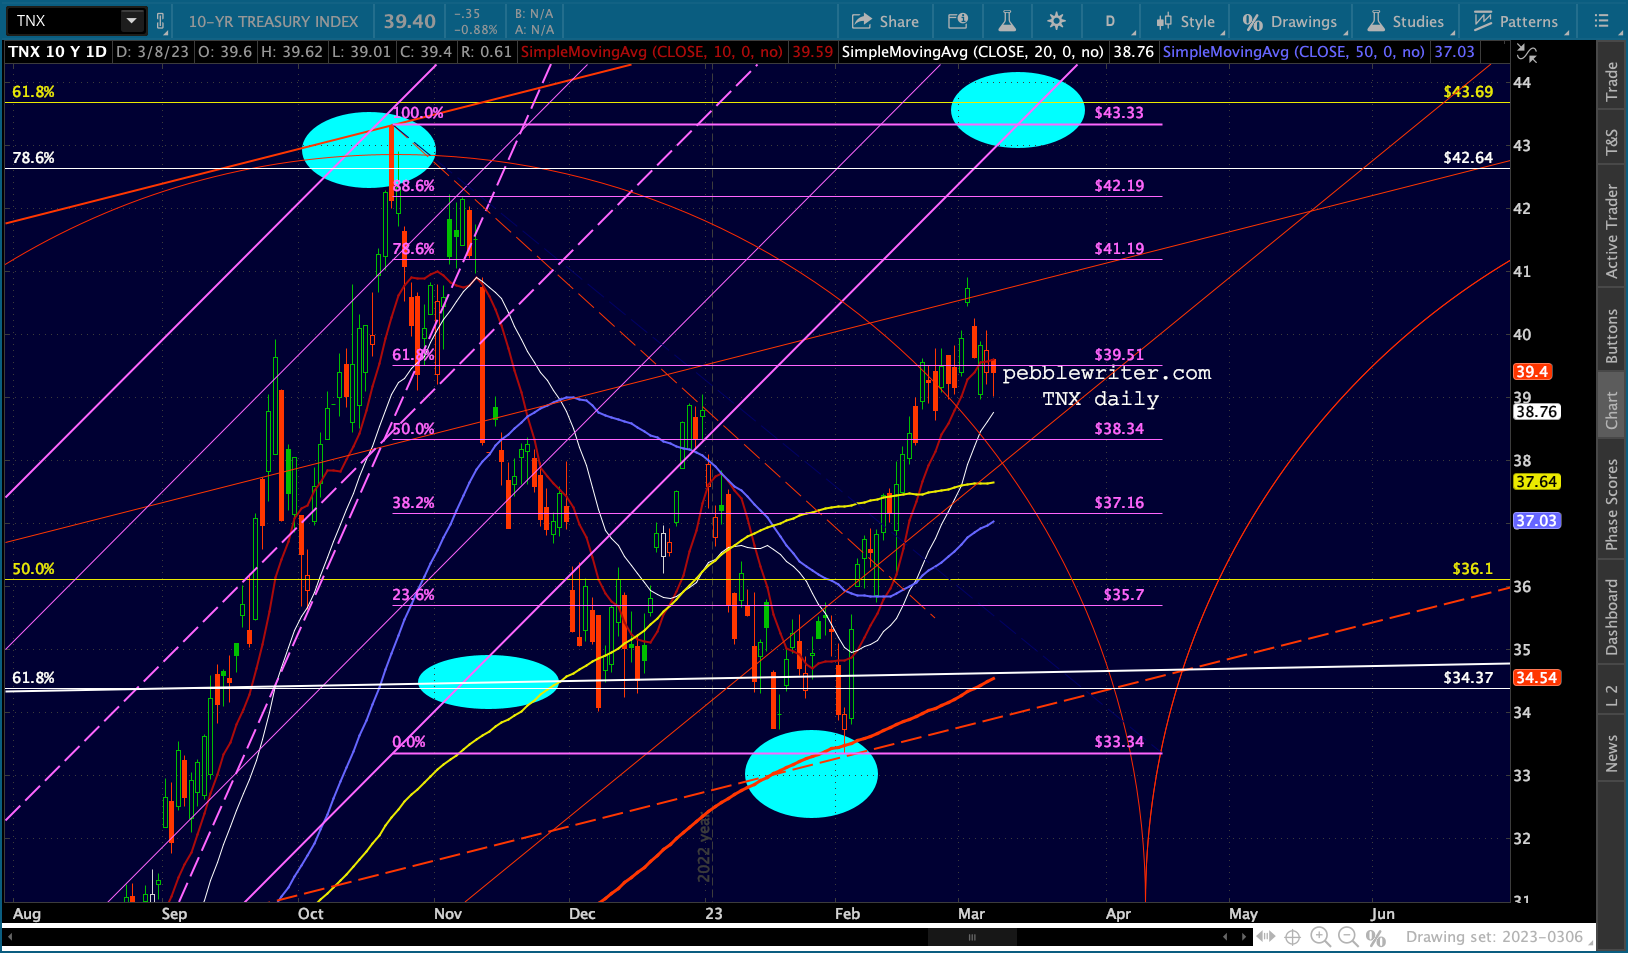 ….the 2Y has pushed to new highs not seen since June 2007…
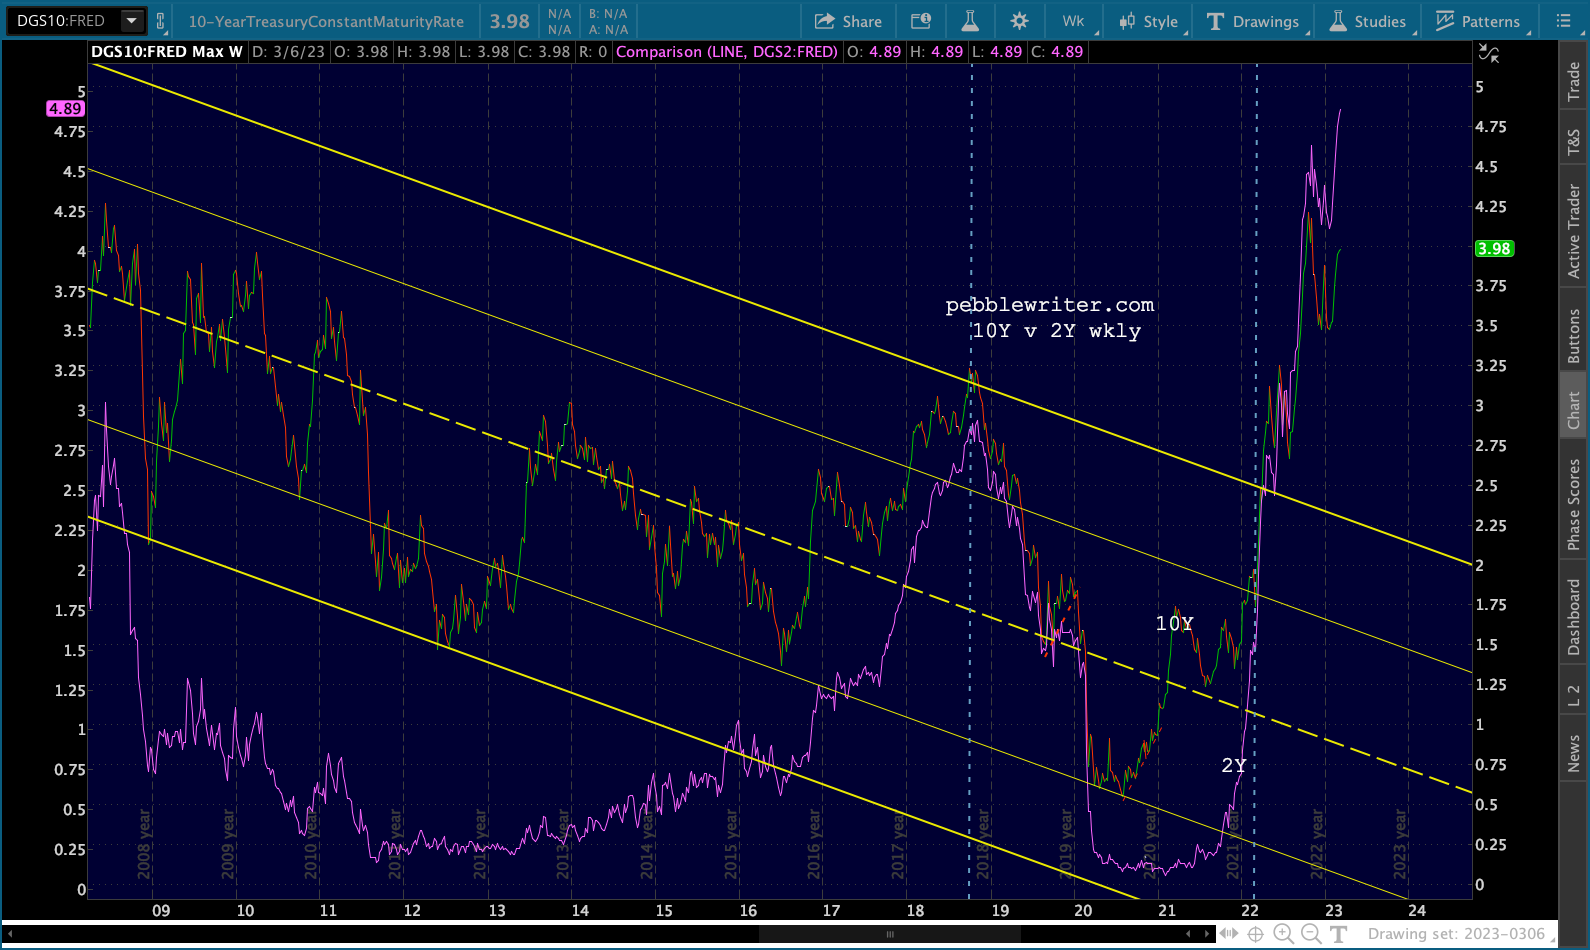 …thus widening the inversion to over 100bps.
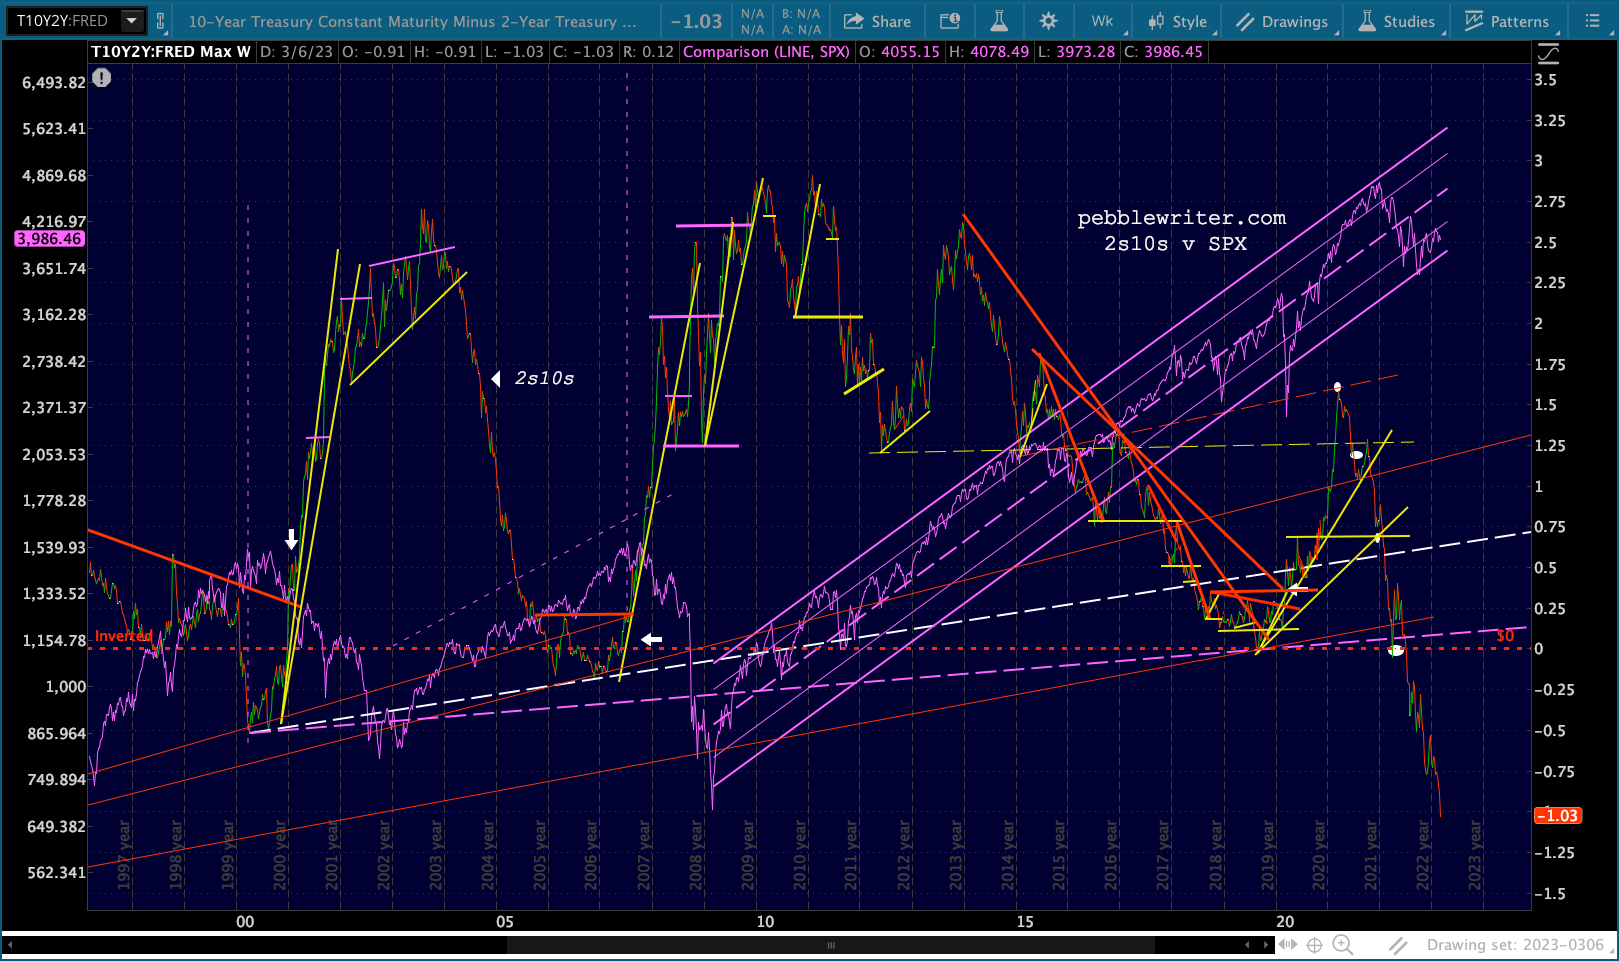 One of my favorite charts – I post it all the time – is the relationship between annual changes in gas prices and CPI.
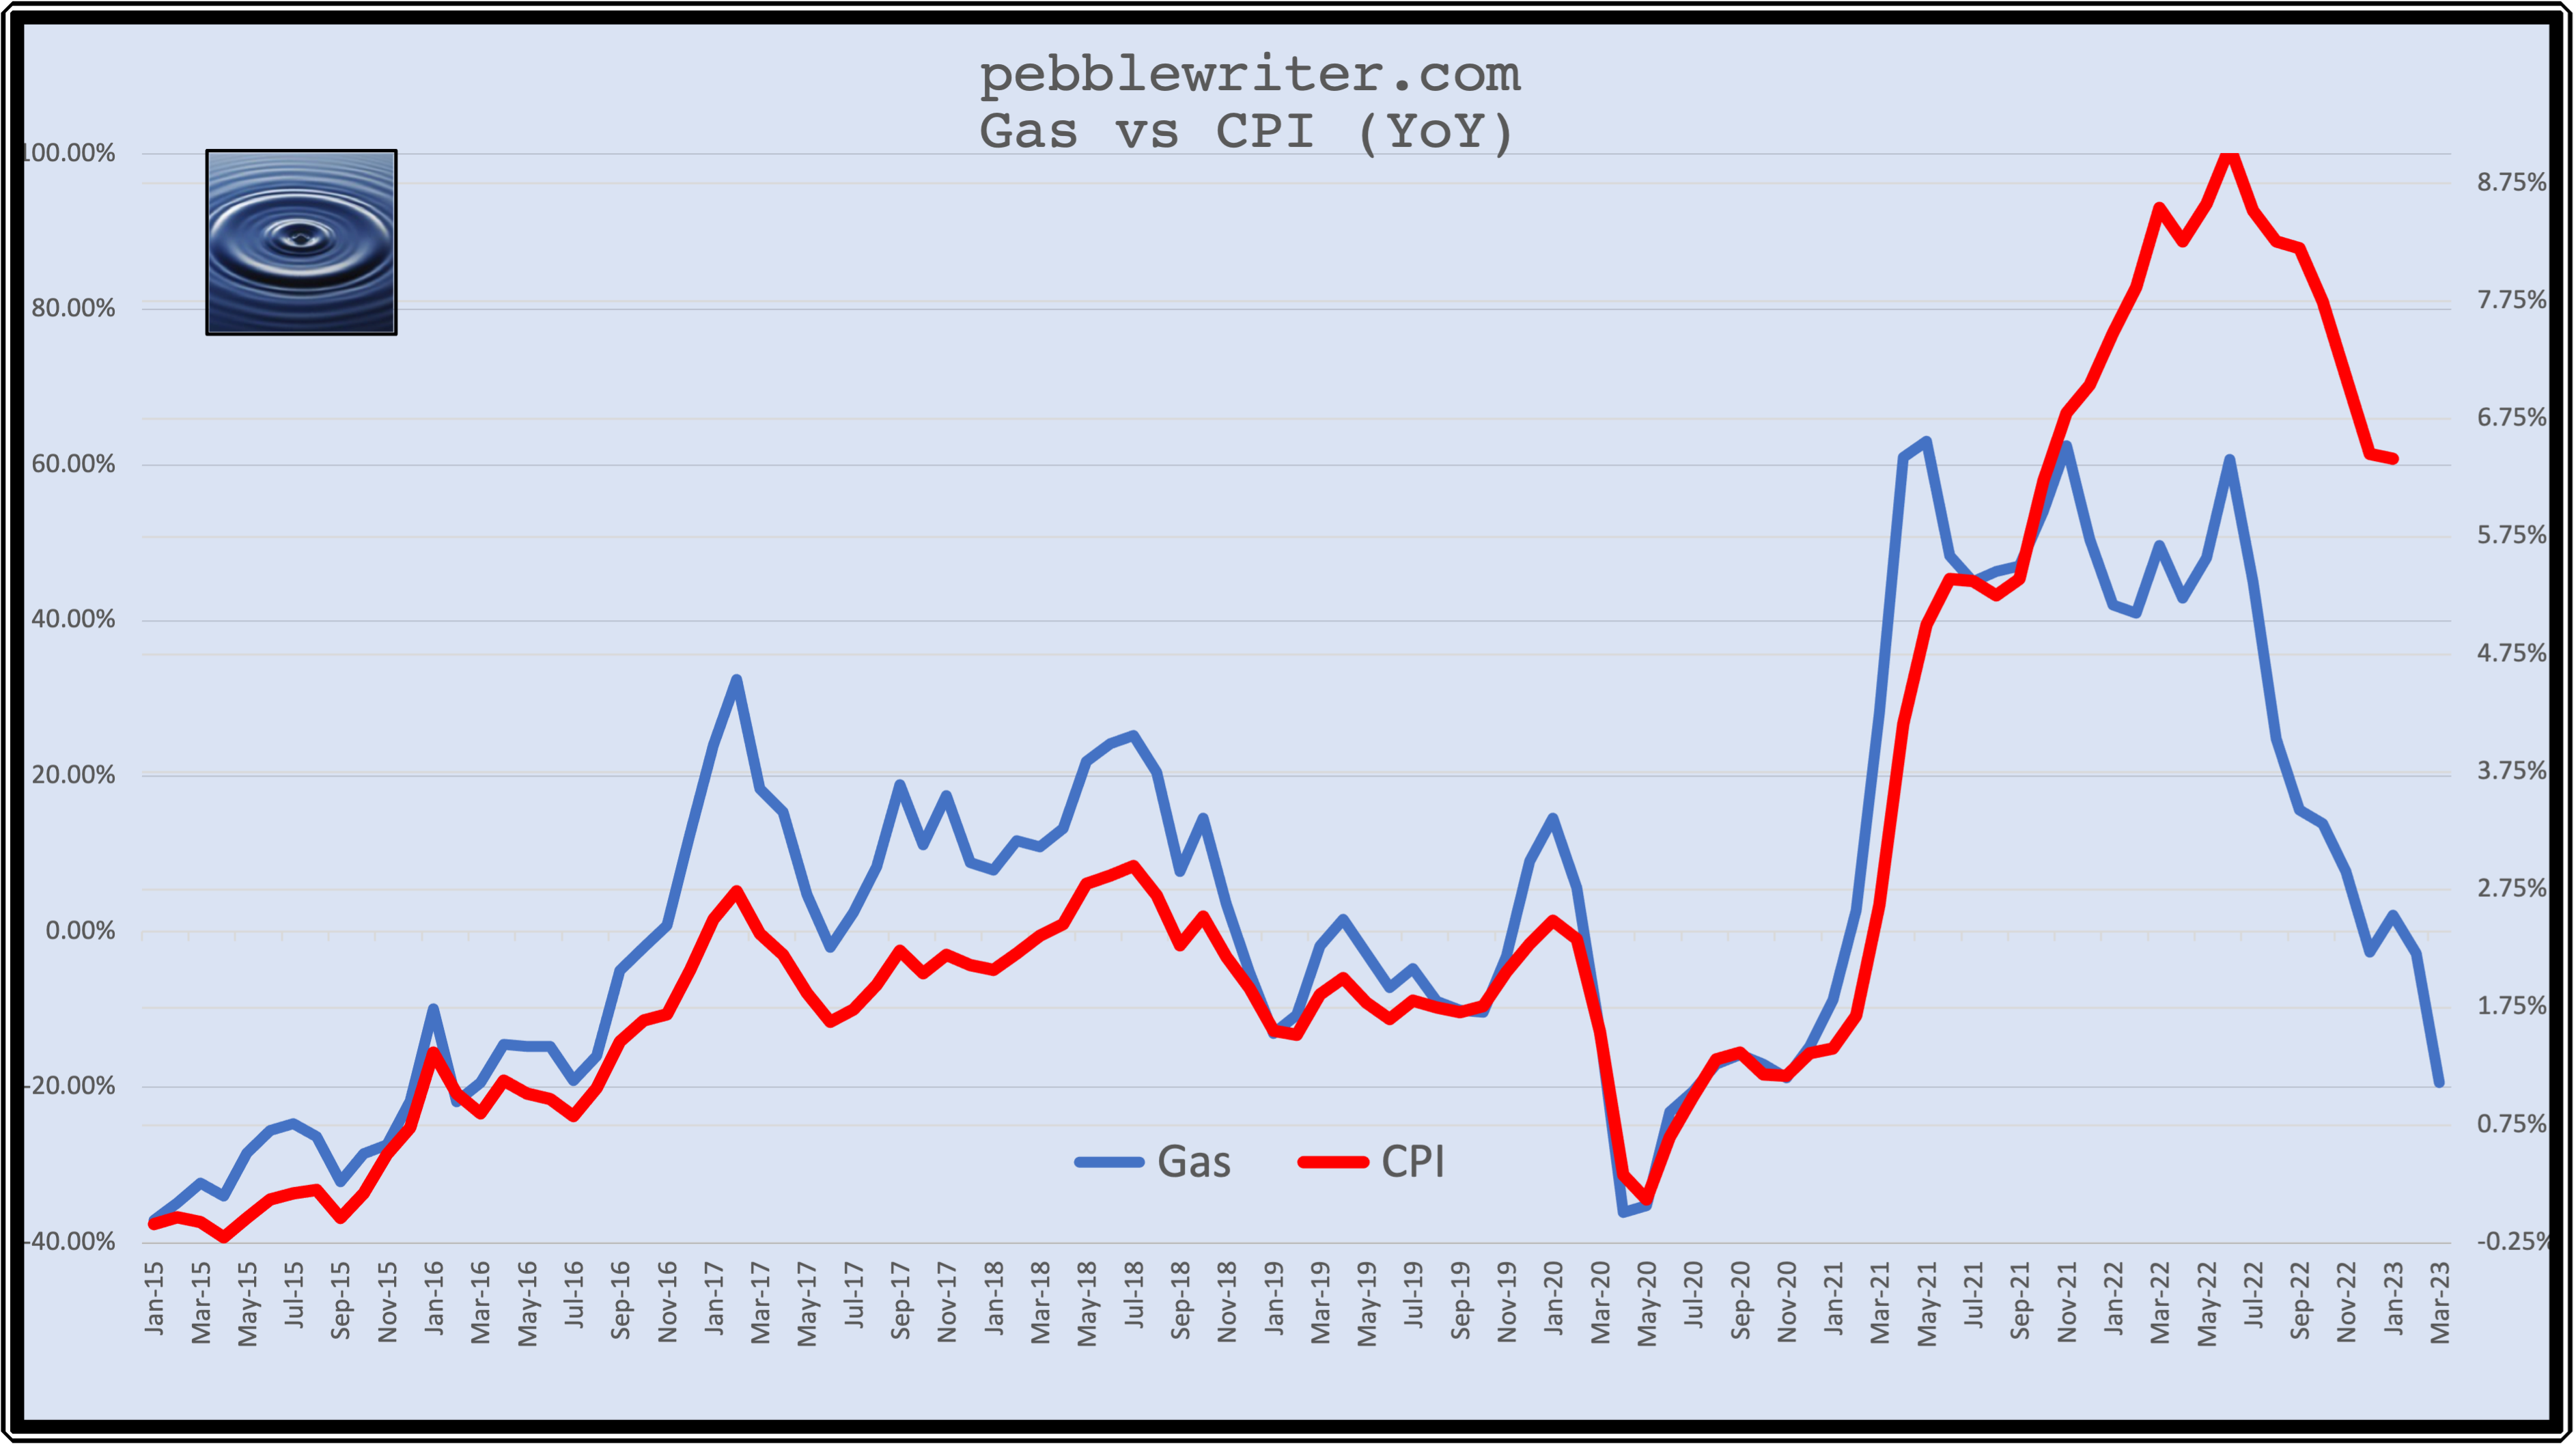 Obviously the two diverged beginning in Nov 2021. But both made a significant peak in Jun 2022 and have been tumbling ever since. Based on the latest data from EIA, the Feb drop in gas prices should be around -2.82% (vs +2.10% in Jan) and Mar’s drop could run nearly -20%. The last time the annual delta in gas reached -20% was in Jul 2020, when inflation ran 0.99%.
Obviously other categories picked up since then. But, energy should continue to have an outsized impact. I would not be surprised to see a larger than expected drop in Feb CPI when announced next week.
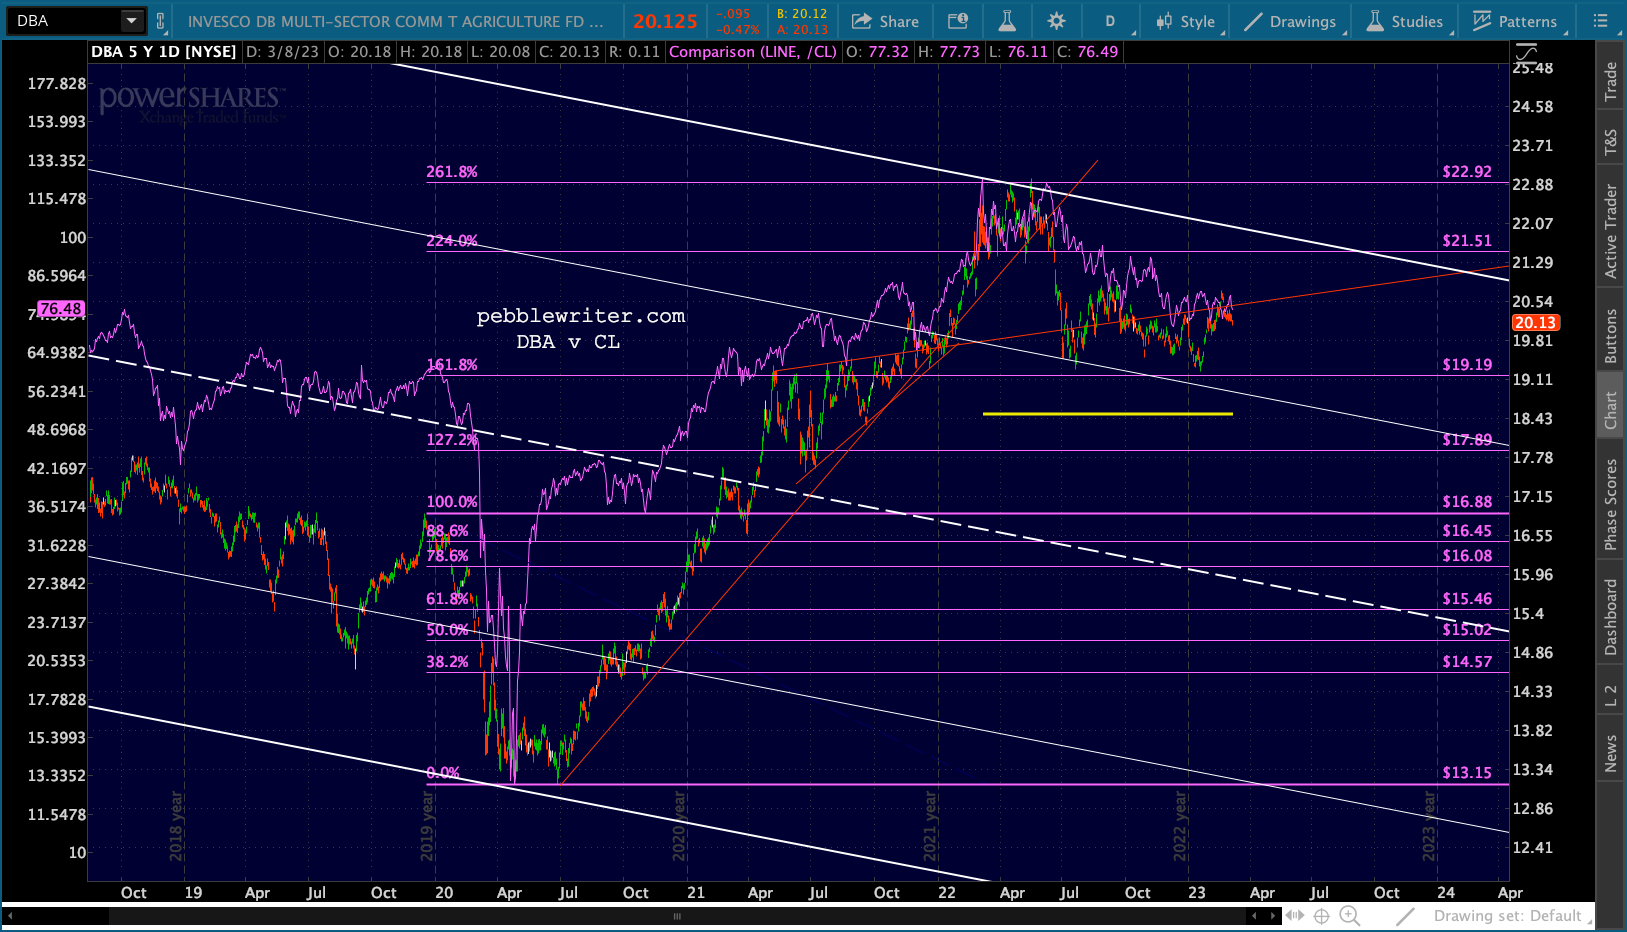
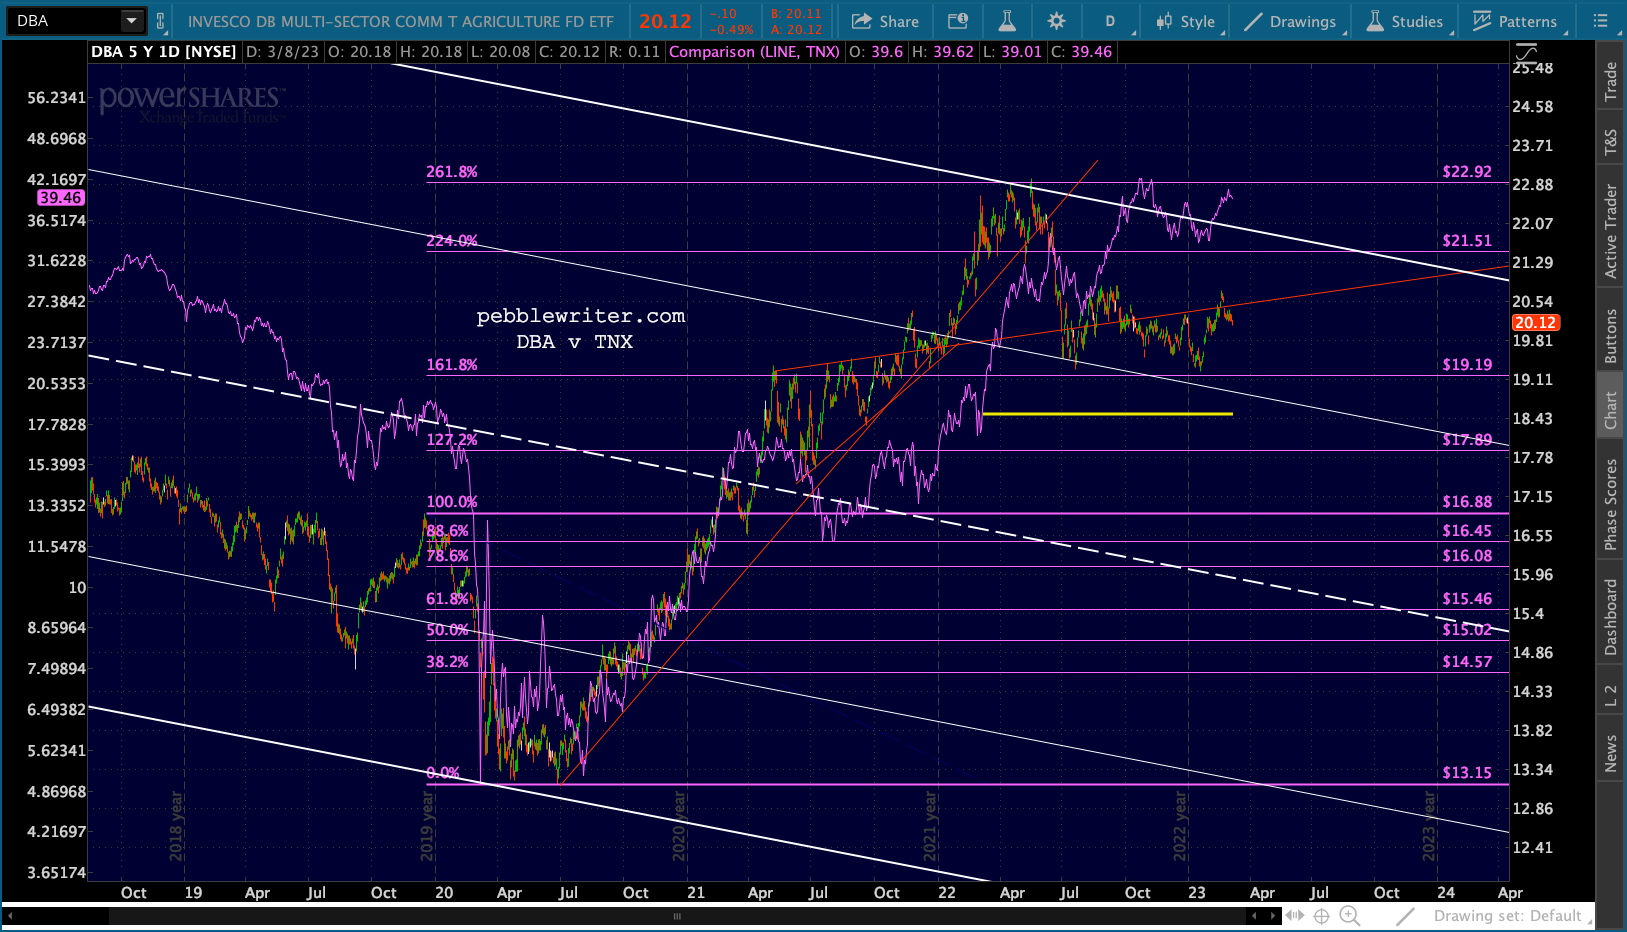
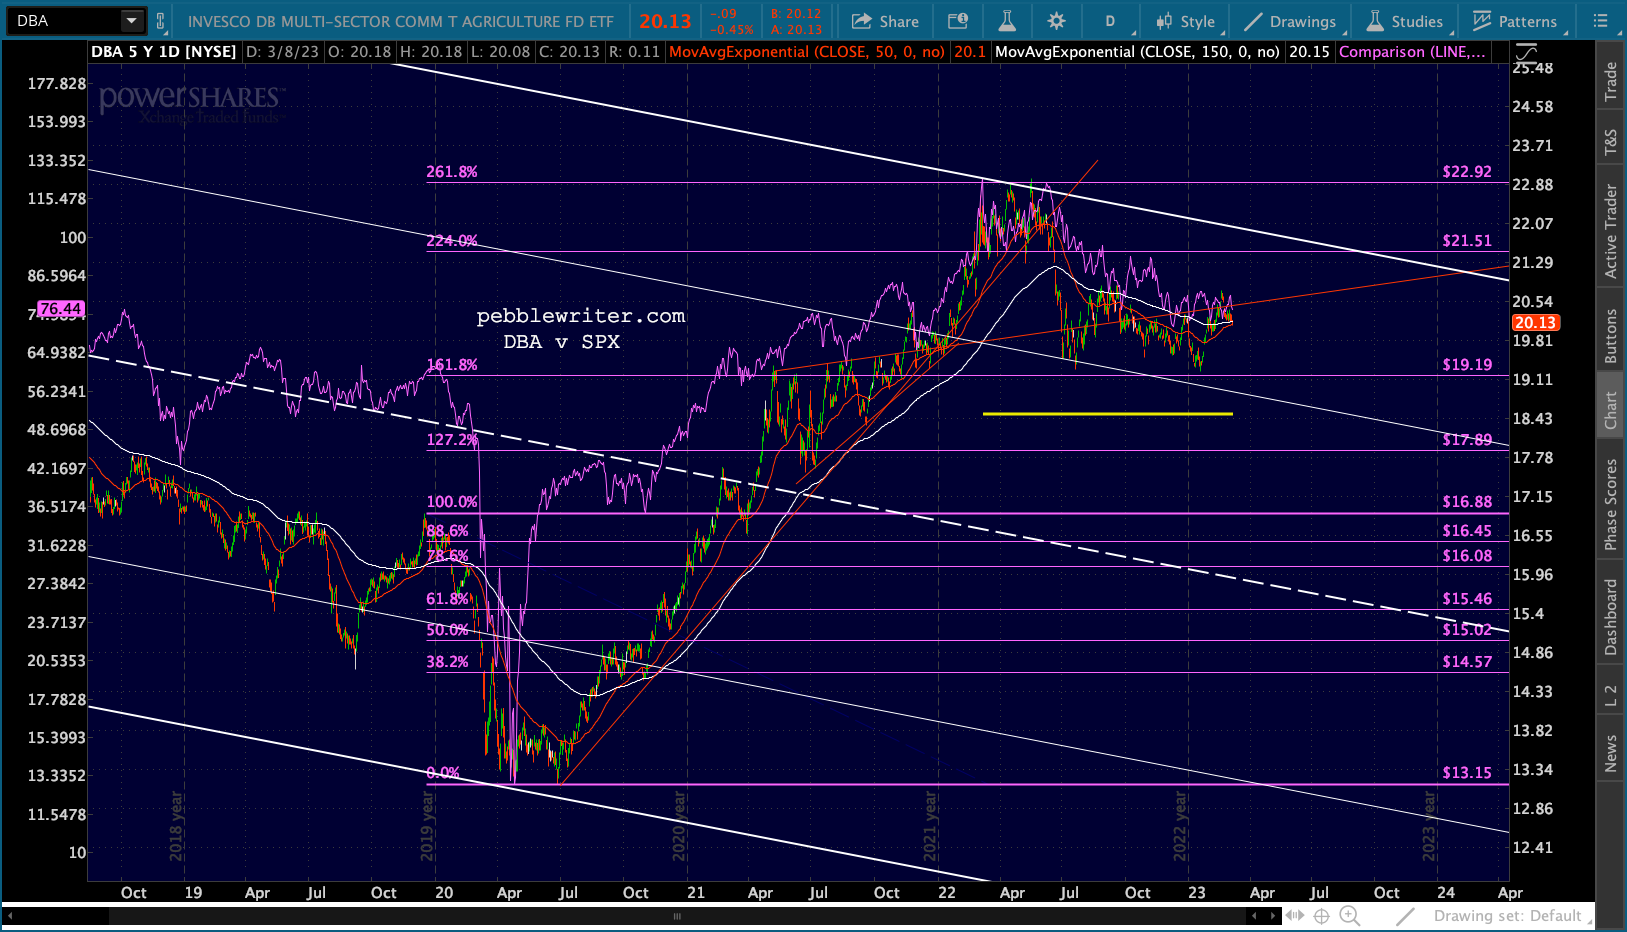
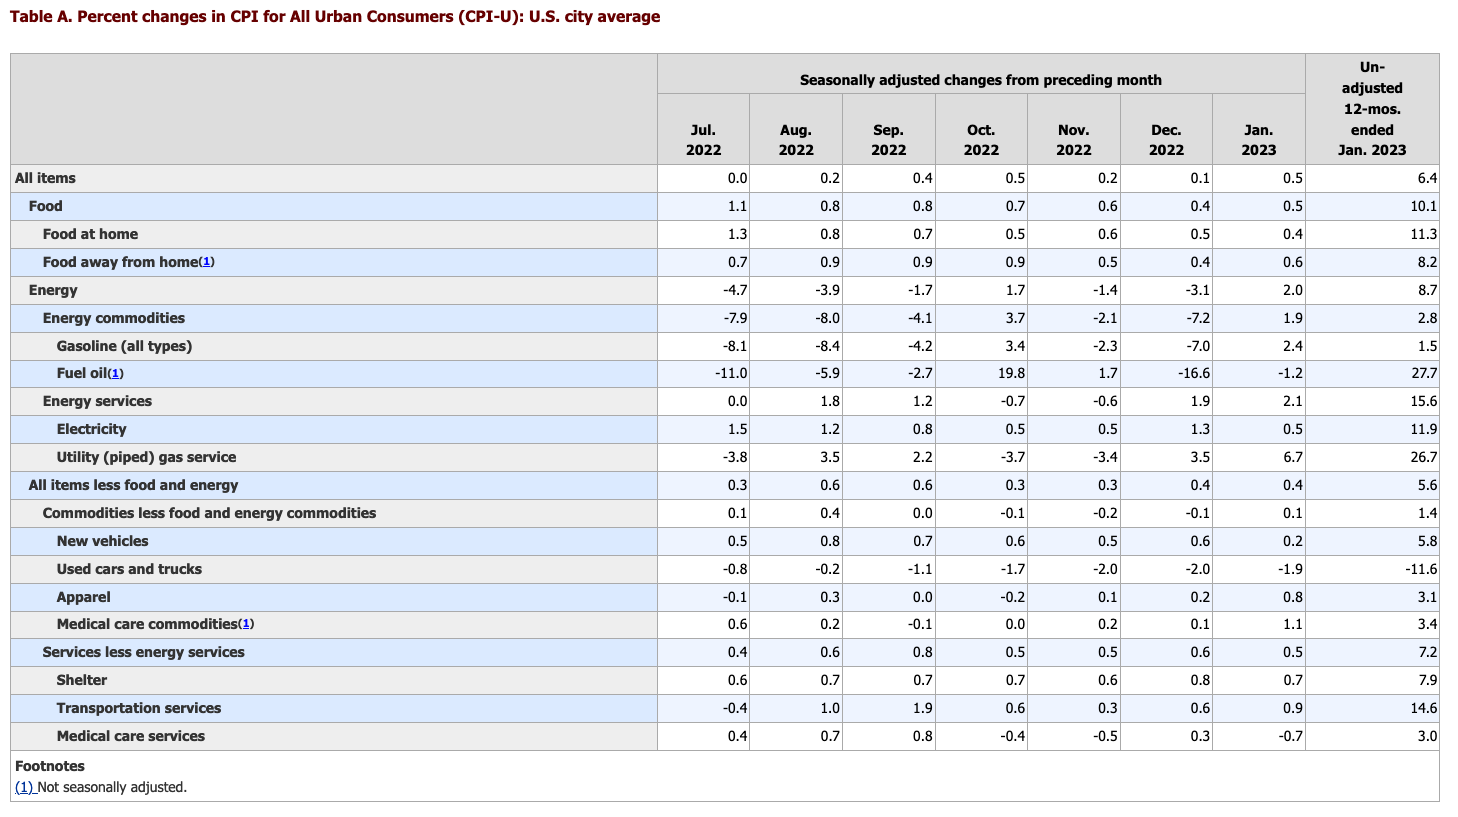 Food prices could also decline meaningfully. Food commodity prices have been going sideways for some time. So, the monthly and annual deltas should be lower than in January – continuing the general trend of declining month-over-month gains.
 UPDATE: 1:10 PM
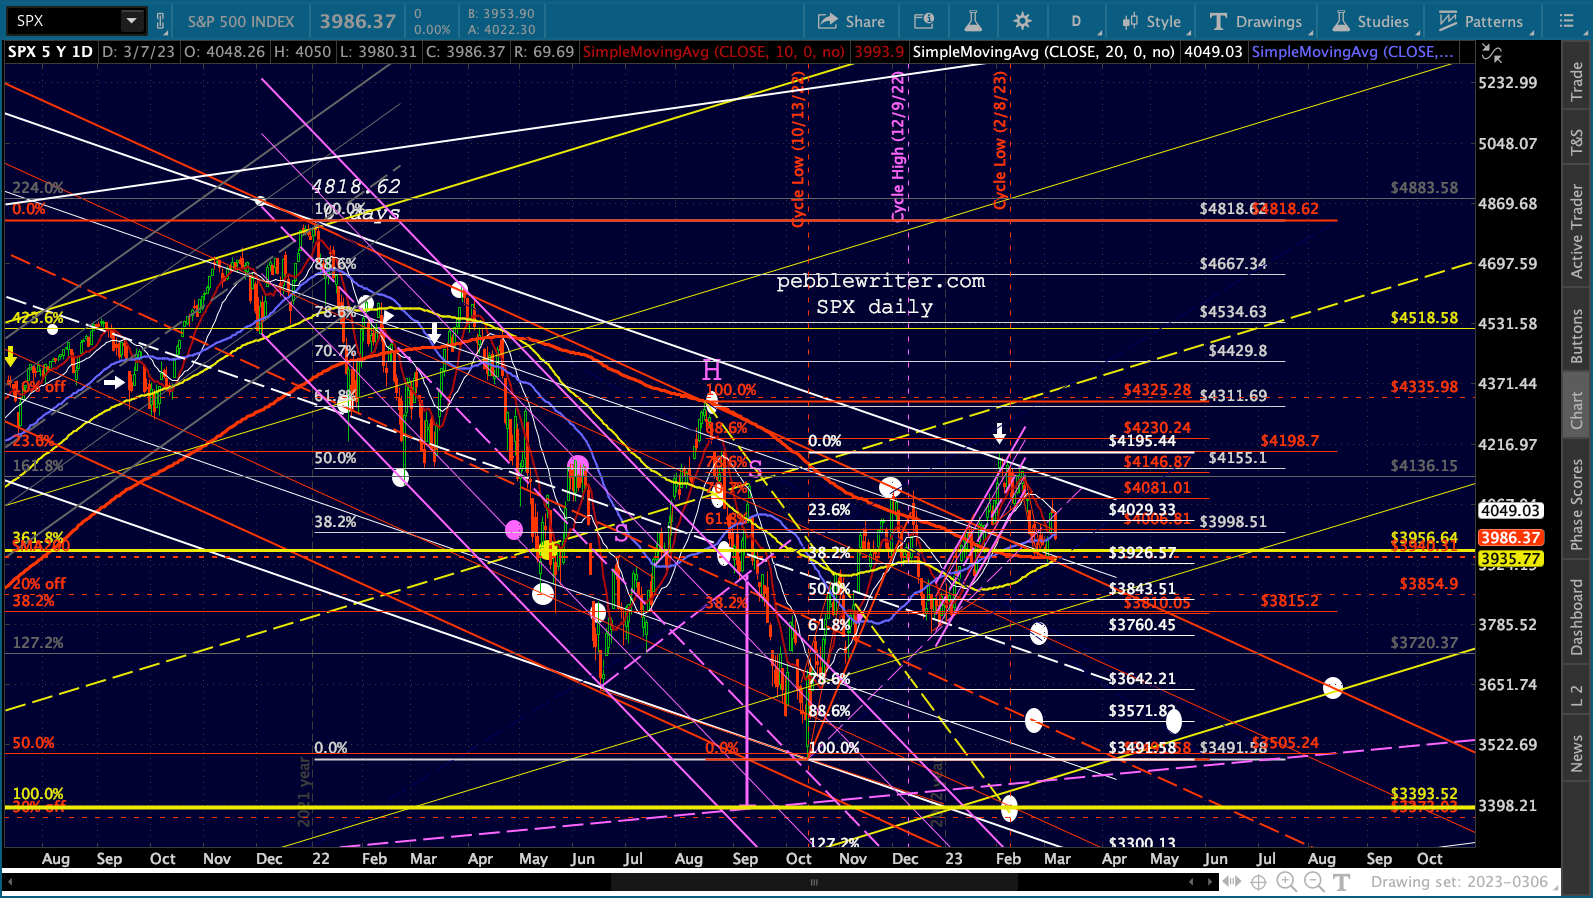
Powell’s testimony just wrapped up. No major departures that I noticed, but SPX is selling off just a bit. Perhaps more importantly, DJIA is closing in on its SMA200. Again, a bounce here would make all the difference in the world – at least for a while.
 I’ve added some key data points and corresponding price targets to the SPX chart below.
 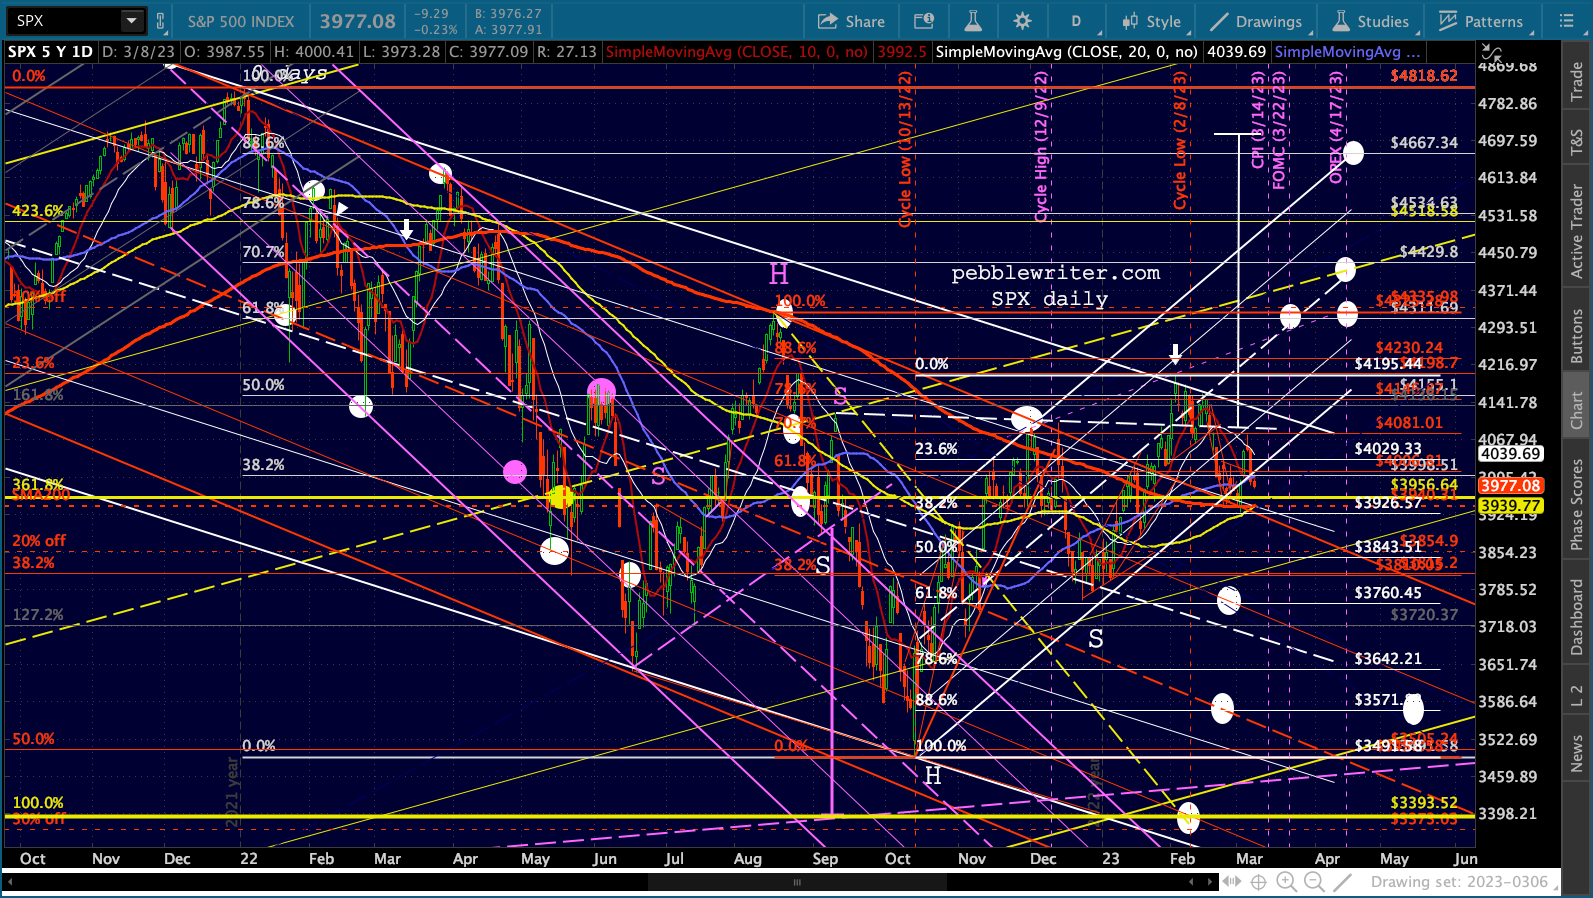 GLTA
GLTA