

Monthly Results
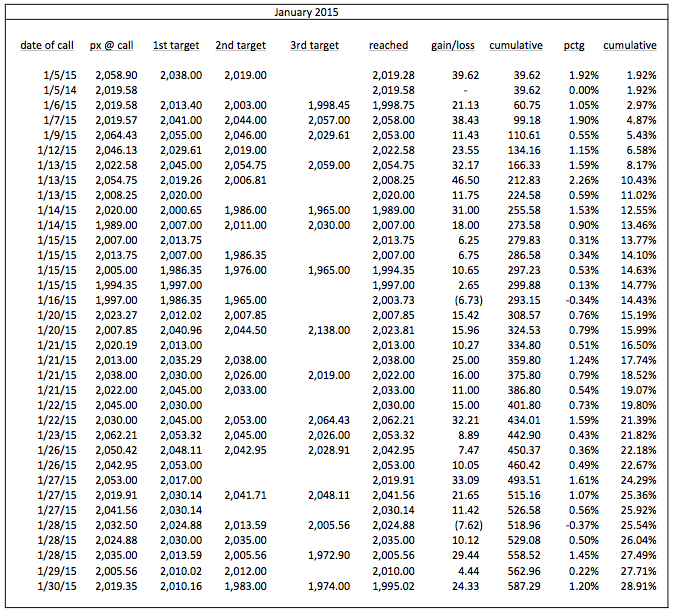
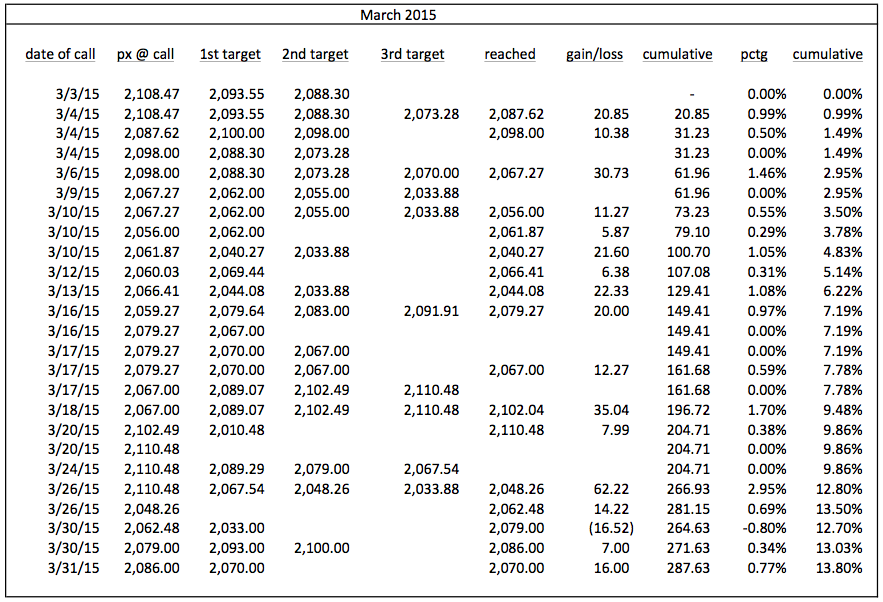
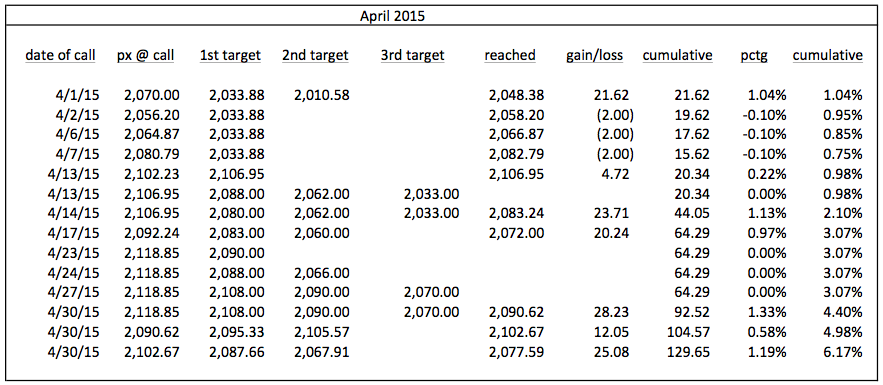
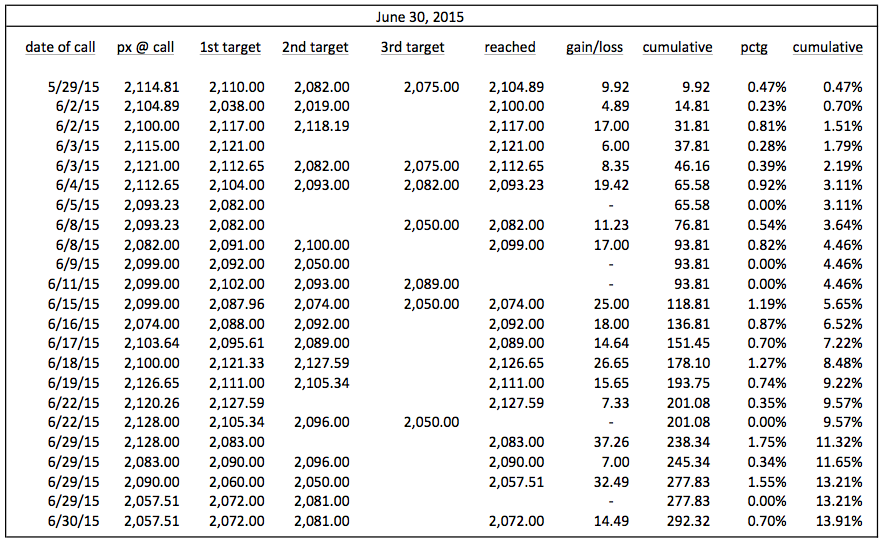
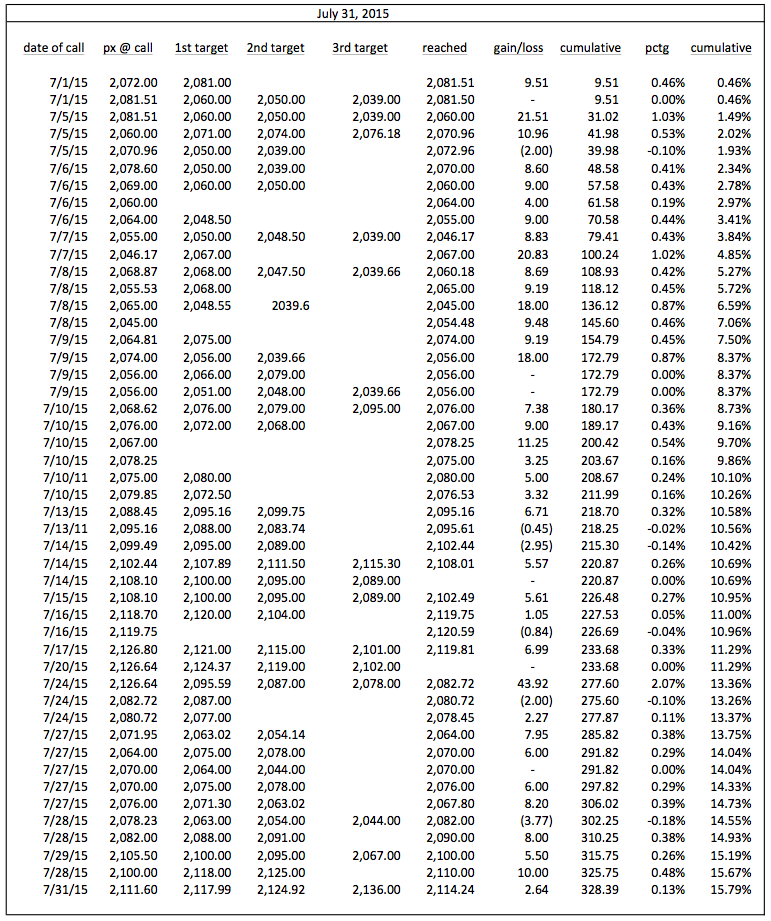
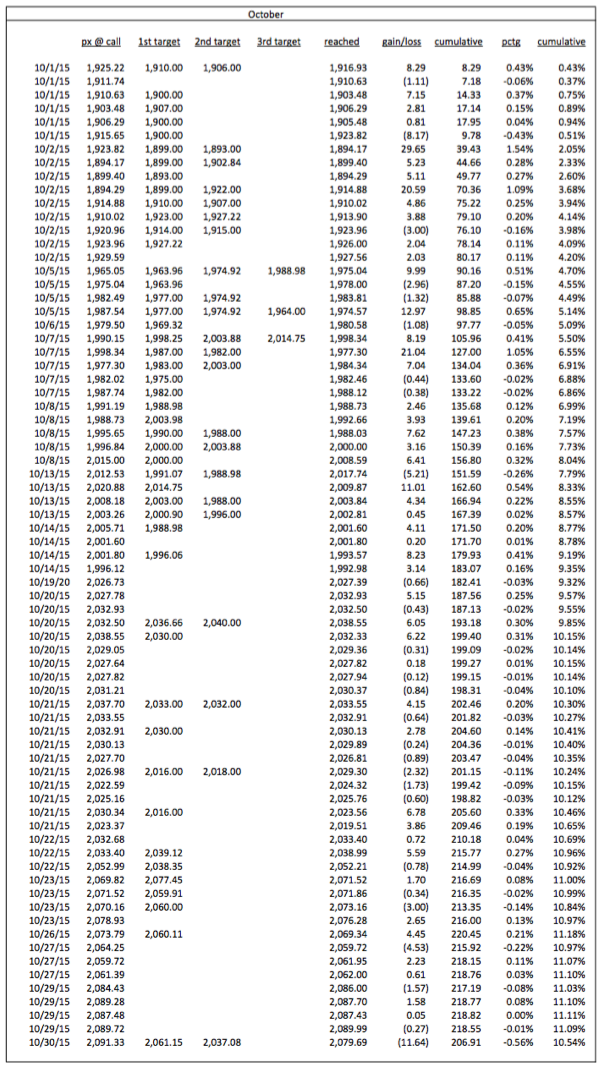
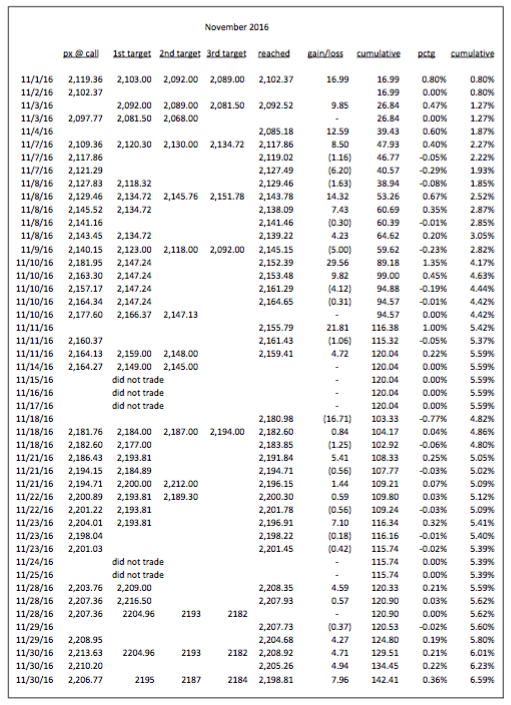
Beginning in January 2015, pebblewriter.com resumed publishing potential turning points in SPX based on our harmonic, chart pattern, analog and technical analysis. The data shown on this page reflect a theoretical, unleveraged portfolio where SPX is bought or shorted based on signals generated by that research.
Between March 2012 and July 2013, I had tallied monthly performance figures based also on intra-day calls for SPX. I then took an 18-month break from daily posting to actively manage a hedge fund (discovering that I’m a better market forecaster than trader.)
In January 2015, I resumed daily posting that identified anticipated turning points. This gradually evolved into specific, intraday long/short alerts, culminating in late June with the availability of memberships once again.
How well any individual member fares with our forecasts will depend on the type and effectiveness of trading they do. Also, there’s typically a 2-3 minute lag between the time I recognize the need for a shift in stance, chart it and post it and when a member can receive and act on the information. Sometimes, this will work in your favor; sometimes, it won’t.
Regardless, it’s my opinion that, whether you’re an active trader or a buy-and-hold investor, knowing potential turning points, periods of elevated danger, etc. is much better than crossing your fingers and hoping for the best.
If you’re an active trader and can capitalize on market timing, you will benefit from being able to earn positive returns when markets are selling off. But, even large, long-term investors can benefit by improving their entry and exit points or knowing when to hedge.
For those who want to know how the watch works rather than simply what time it is, this site will educate you on how to evaluate and anticipate changes in the markets — changes that represent both opportunities and dangers.
For details on membership options, pricing, and promotions that we run from time to time, please click on the link below.
* * * * *
Results are not necessarily indicative of those that current or future subscribers might achieve. Your mileage may vary. See full disclosures below.
2017 – present:
In 2017, we began to experience what I considered a meltup — infrequent and fleeting dips which usually disappeared intraday (BTFD.) Trying to pinpoint these turning points resulted in too much intraday trading — to the point where it came to resemble scalping rather than swing trading.
I shifted focus as and began tracking calls made in oil, gas, VIX, currencies and bonds as well as a few individual stock forecasts which I felt were suitable for swing trading and buy-and-hold strategies.
As far as SPX was concerned, once it backtested 2335 in April 2017 there was virtually no overhead resistance until 2703 — a 15.7% rally expected by the end of the year (which actually reached nearly 23%.)
Once SPX topped out in January, we saw renewed opportunities to swing trade. The 2017 and 2018 results are currently being tabulated and will be posted shortly.

2015 – 2016:
 March 2012 – July 2013:

* * * * *
[expand title=”Mar – Jun 2012″] [/expand]
[expand title=”Jul – Sep 2012″]
 [/expand]
[expand title=”Oct – Dec 2012″]

[/expand]
[expand title=”Jan – Feb 2013″]
 [/expand]
[expand title=”Mar 2013″]
 [/expand]
[expand title=”Apr 2013″]
 [/expand]
[expand title=”May 2013″]
 [/expand]
[expand title=”Jun 2013″]
 [/expand]
[expand title=”Jul 2013″]
 [/expand]
[expand title=”Jan 2015″]
 [/expand]
[expand title=”Feb 2015″]
 [/expand]
[expand title=”Mar 2015″]
 [/expand]
[expand title=”Apr 2015″]
 [/expand]
[expand title=”May 2015″]
 [/expand]
[expand title=”Jun 2015″]
 [/expand]
[expand title=”Jul 2015″]
 [/expand]
[expand title=”Aug 2015″]
 [/expand]
[expand title=”Sep 2015″]

 [/expand]
[expand title=”Oct 2015″]
 [/expand]
[expand title=”Nov 2015″]  [/expand]
[expand title=”Dec 2015″]
 [/expand]
[expand title=”Jan 2016″]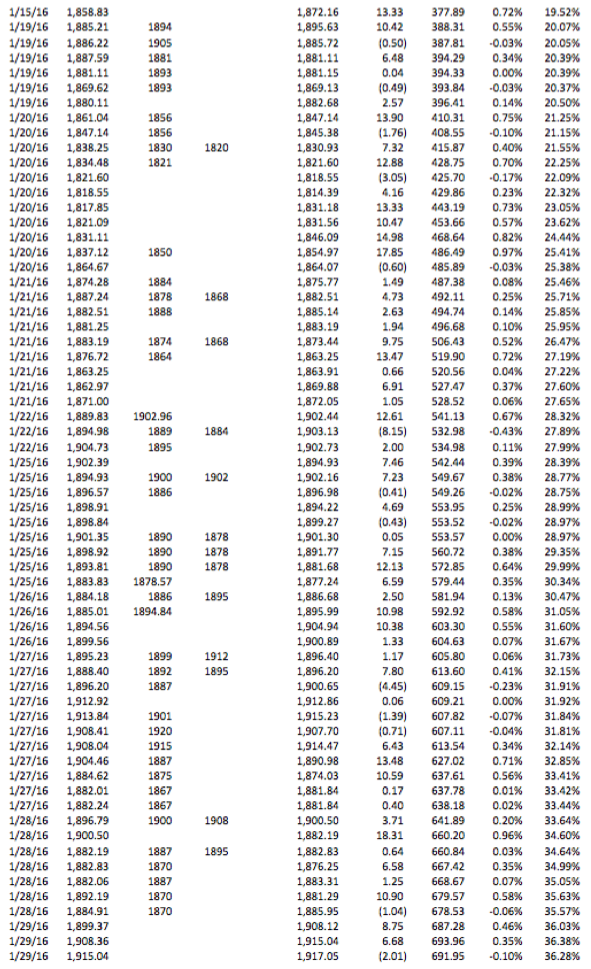 [/expand]
[expand title=”Feb 2016″]
 [/expand]
[expand title=”Mar 2016″]

[/expand]
[expand title=”Apr 2016″]
[/expand]
[expand title=”May 2016″]  [/expand]
[expand title=”Jun 2016″]

 [/expand]
[expand title=”Jul 2016″]
 [/expand]
[expand title=”Aug 2016″]

[/expand]
[expand title=”Sep 2016″]
 [/expand]
[expand title=”Oct 2016″]
[/expand]
[expand title=”Nov 2016″]
[/expand]
[expand title=”Dec 2016″]

[/expand]
[expand title=”Jan 2017″]

[/expand]
[expand title=”Feb 2017″]

[/expand]
[expand title=”Mar 2017″]

[/expand]
- The Fine Print:
-
- Represents performance of a theoretical portfolio, where SPX is bought or shorted based on signals generated by my research. Your mileage will vary.
- Assumes no leverage: 100% long, 100% short or 100% cash.
- Prices listed reflect the index at the time tops/bottoms are called and/or trades are made and are believed, but not guaranteed, to be accurate. Dividends, transaction costs and any hedging costs are ignored.
- When SPX gaps up or down and we’ve adopted a new stance (i.e. weren’t long or short overnight), assumes entry at the opening price of the 2nd minute of trading.
- Results are since inception of pebblewriter.com on March 22, 2012.
- Past results are not necessarily indicative of future results. See Disclosures and Use Agreement for important information.