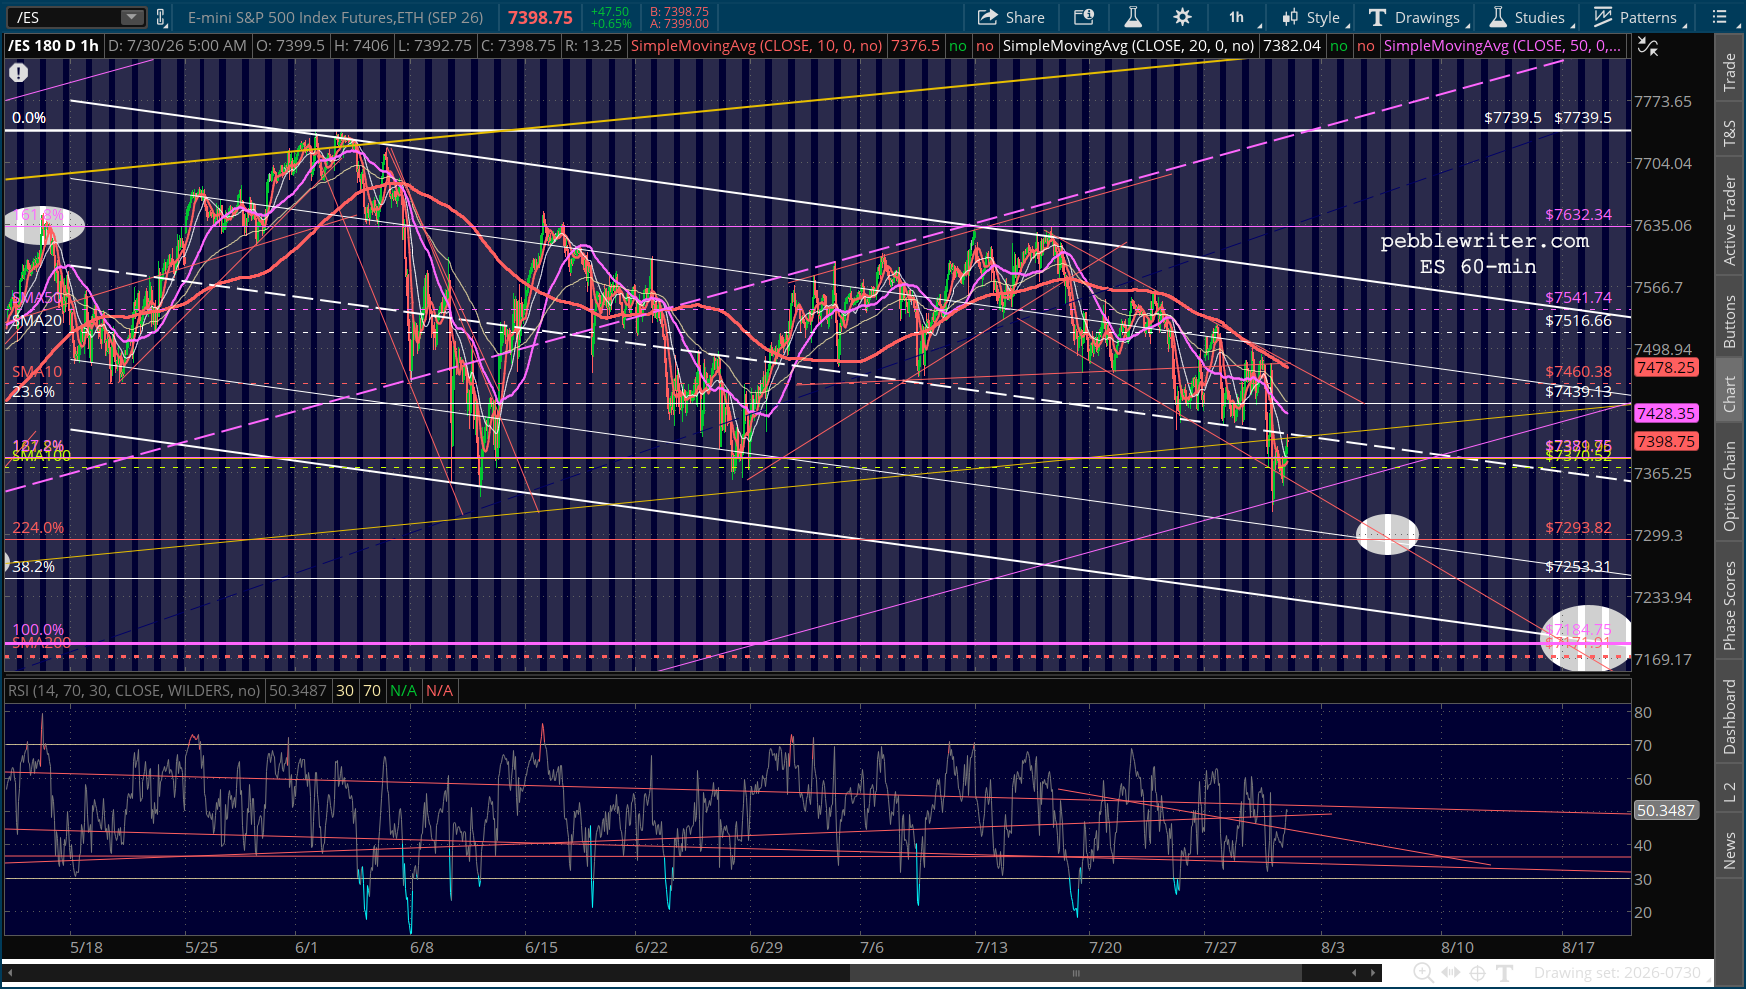
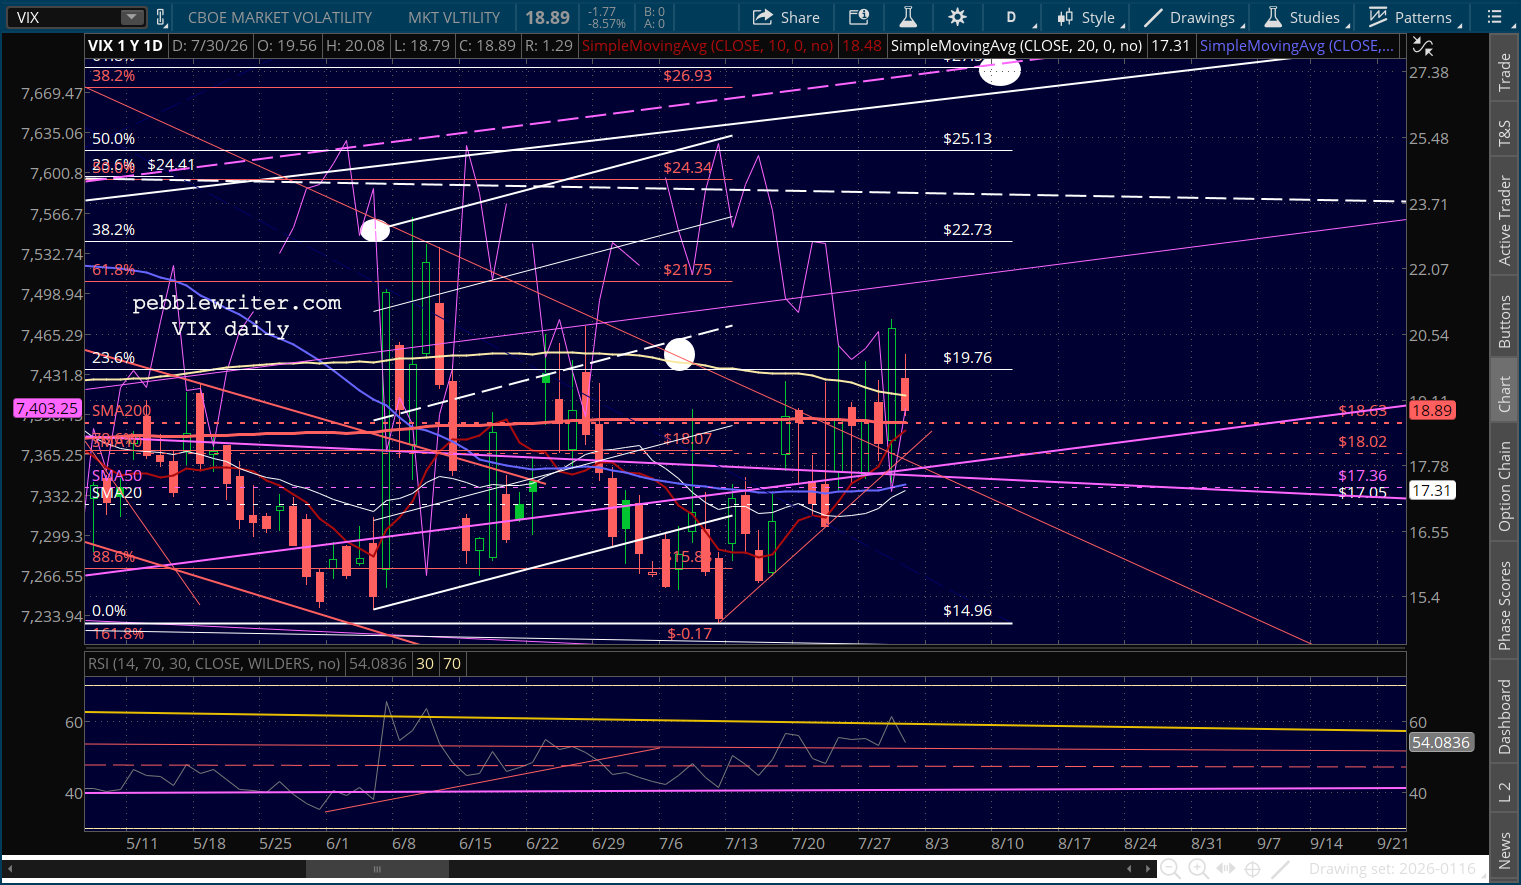
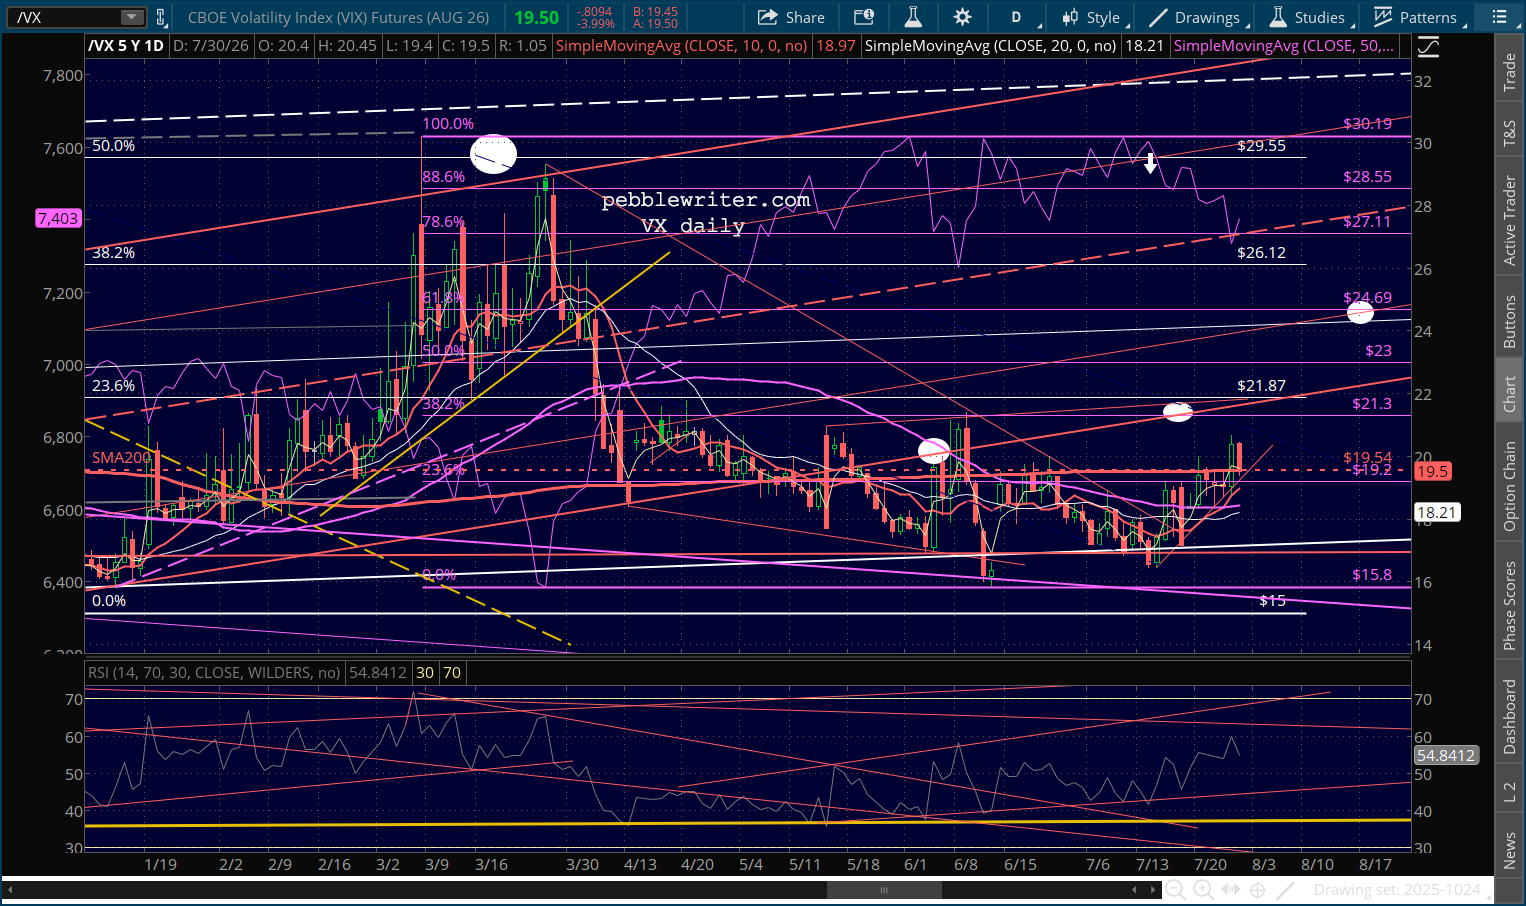
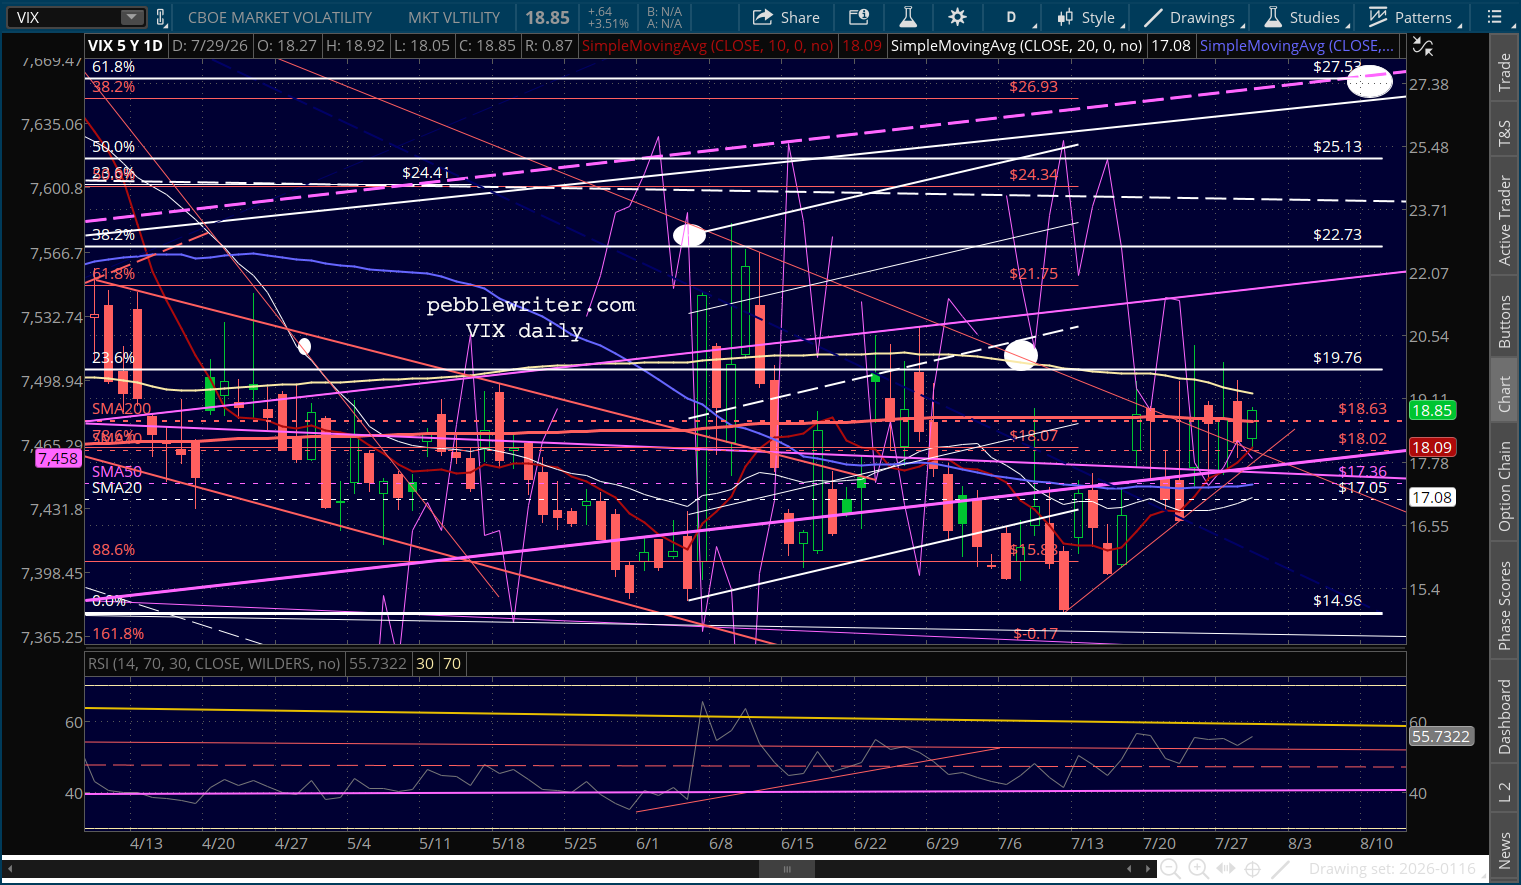
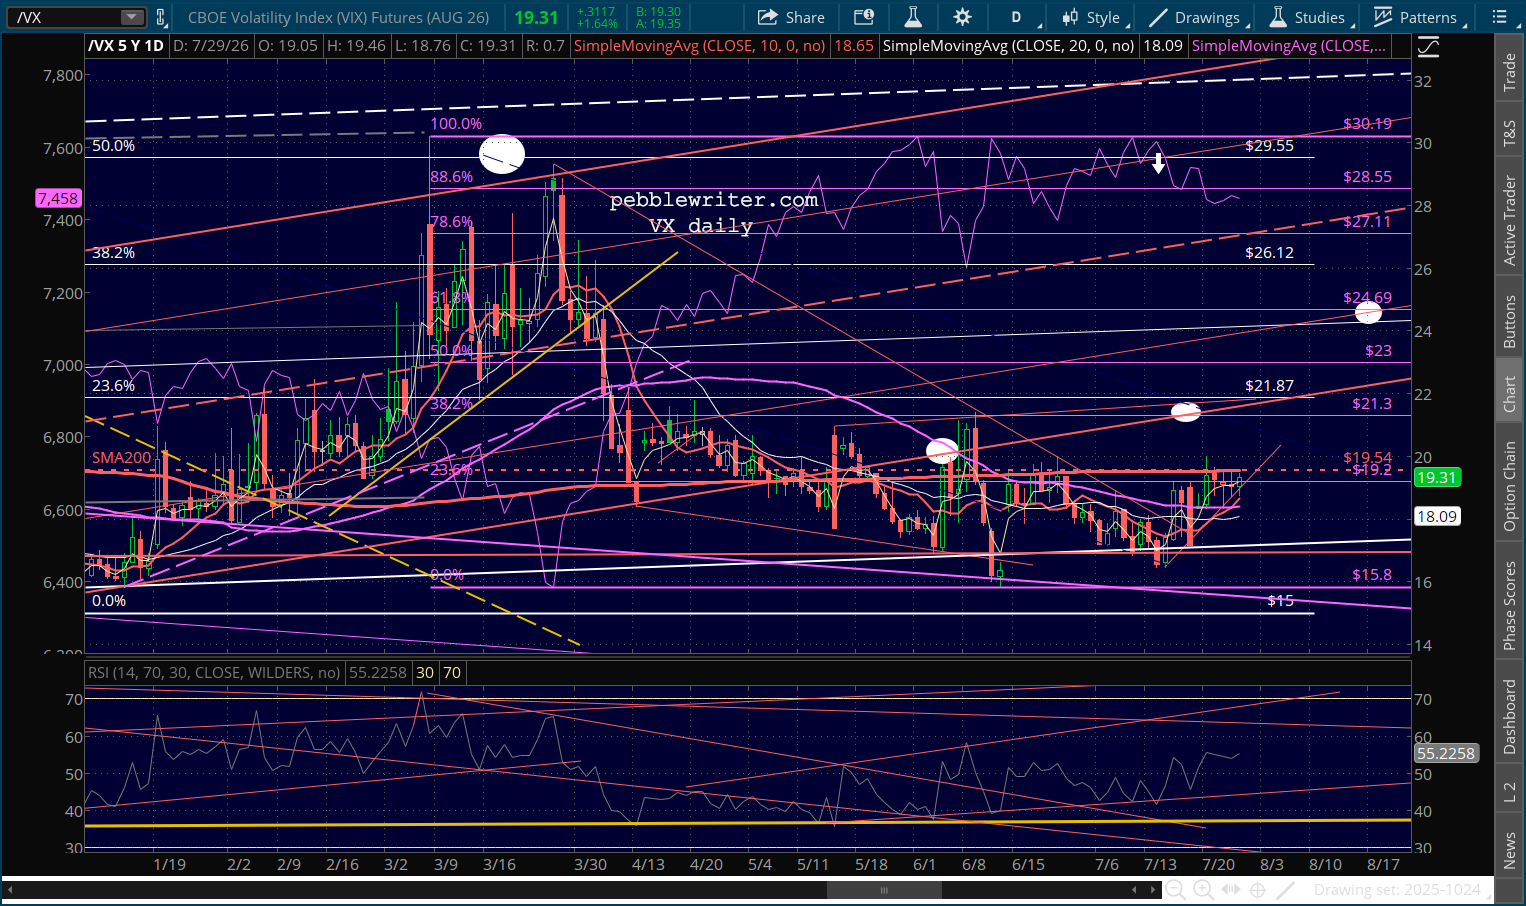
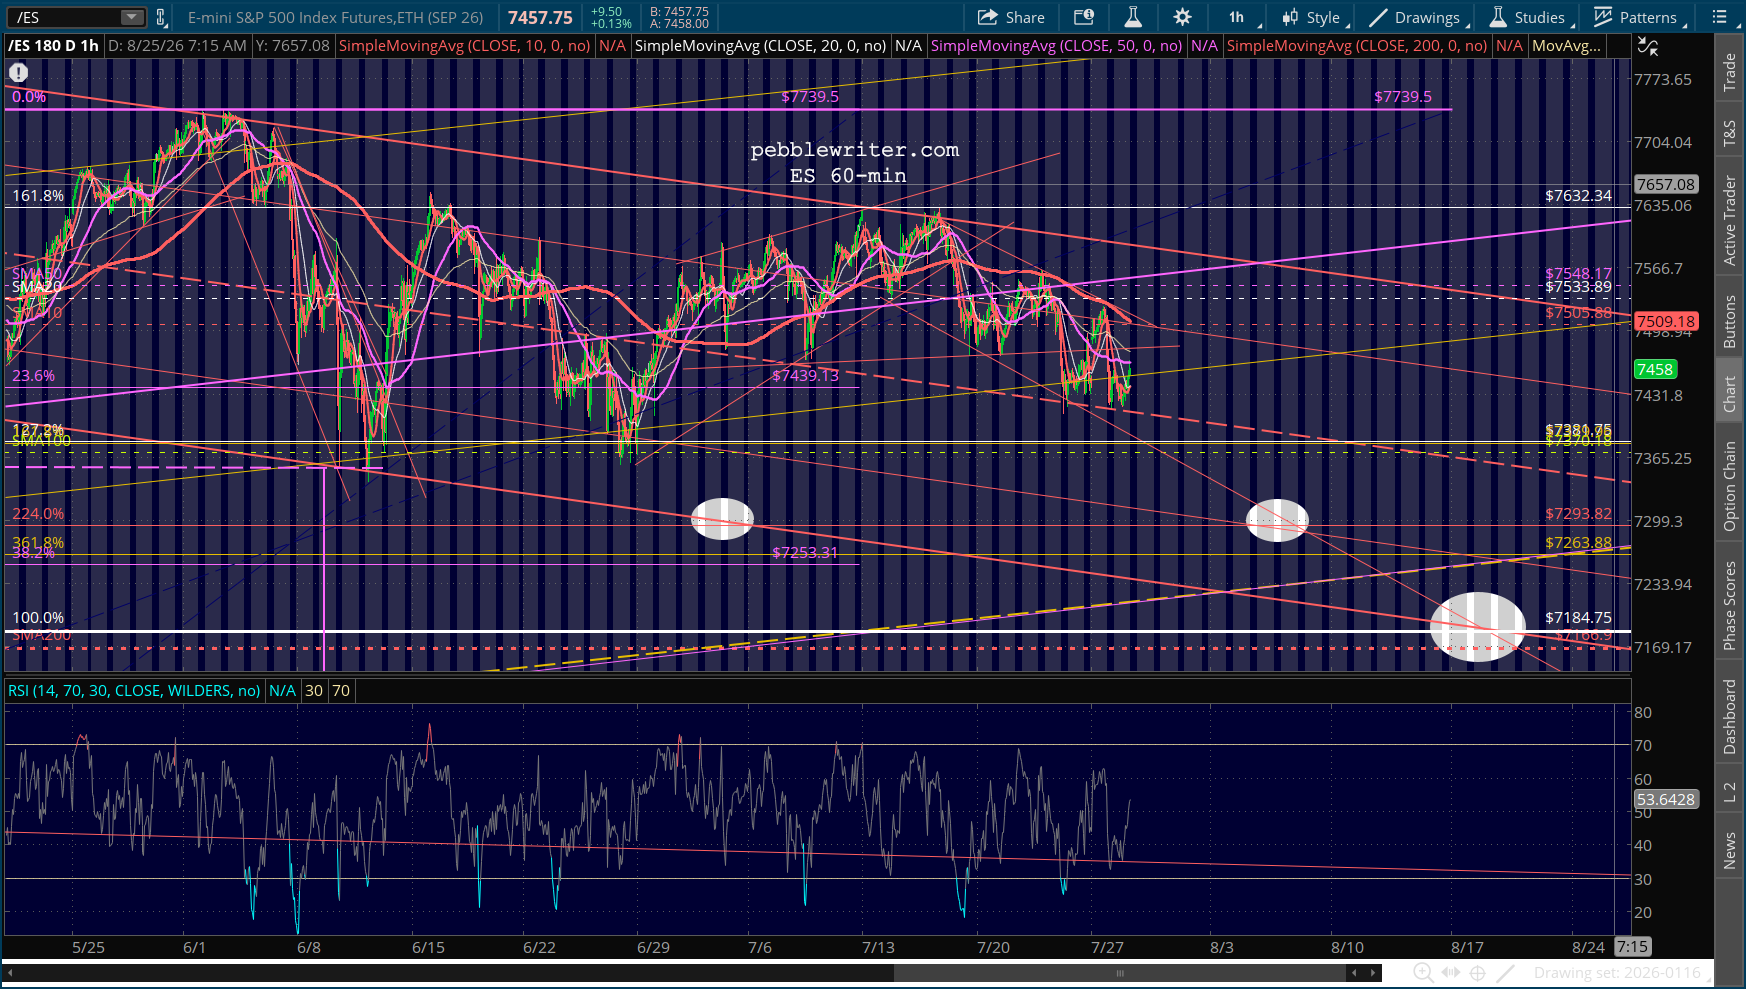
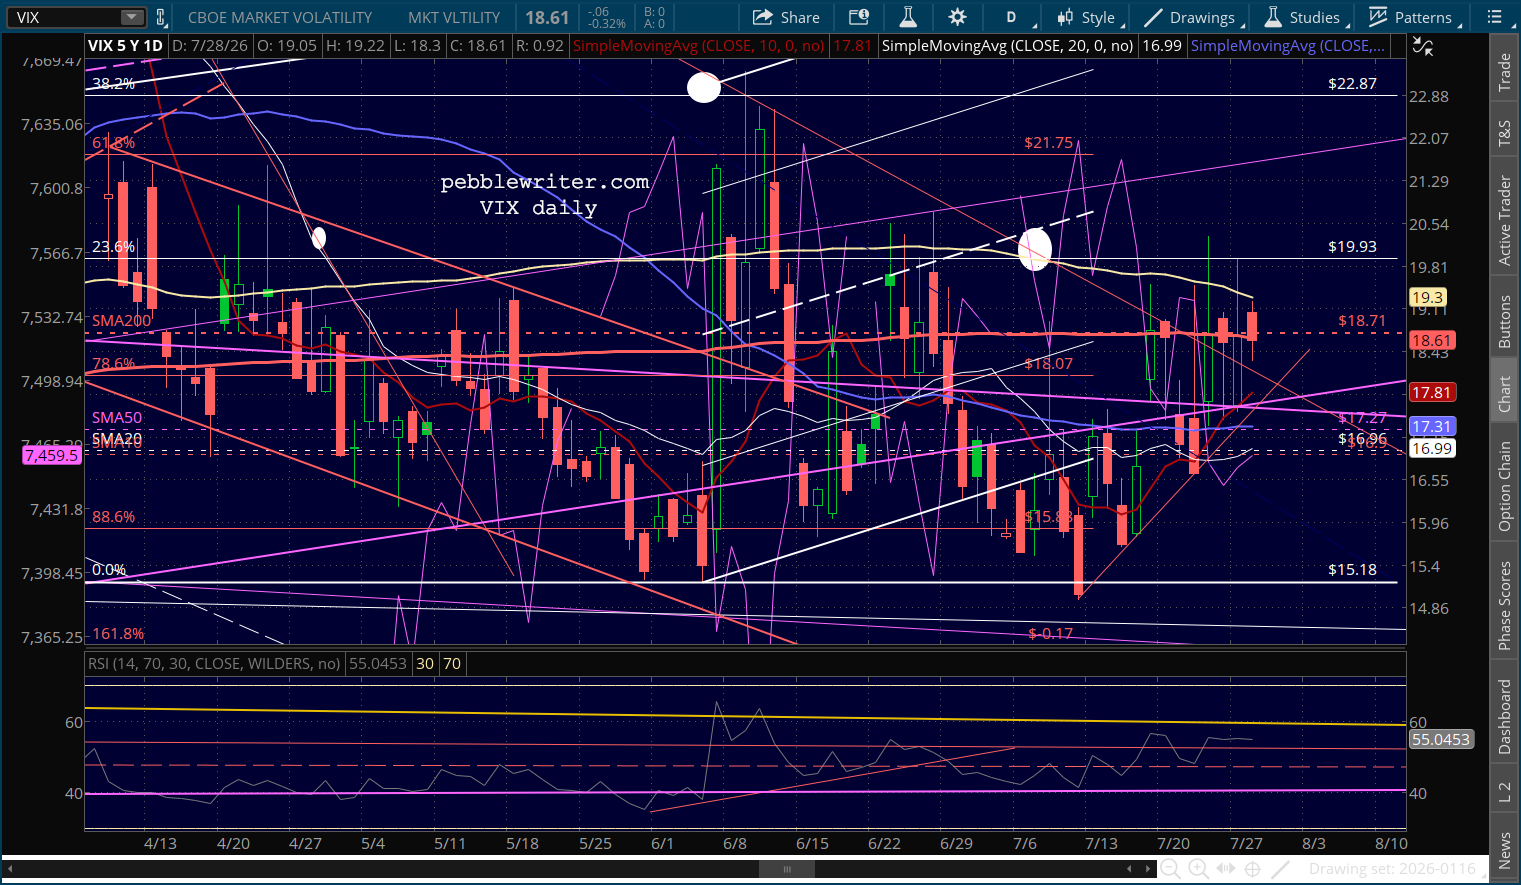
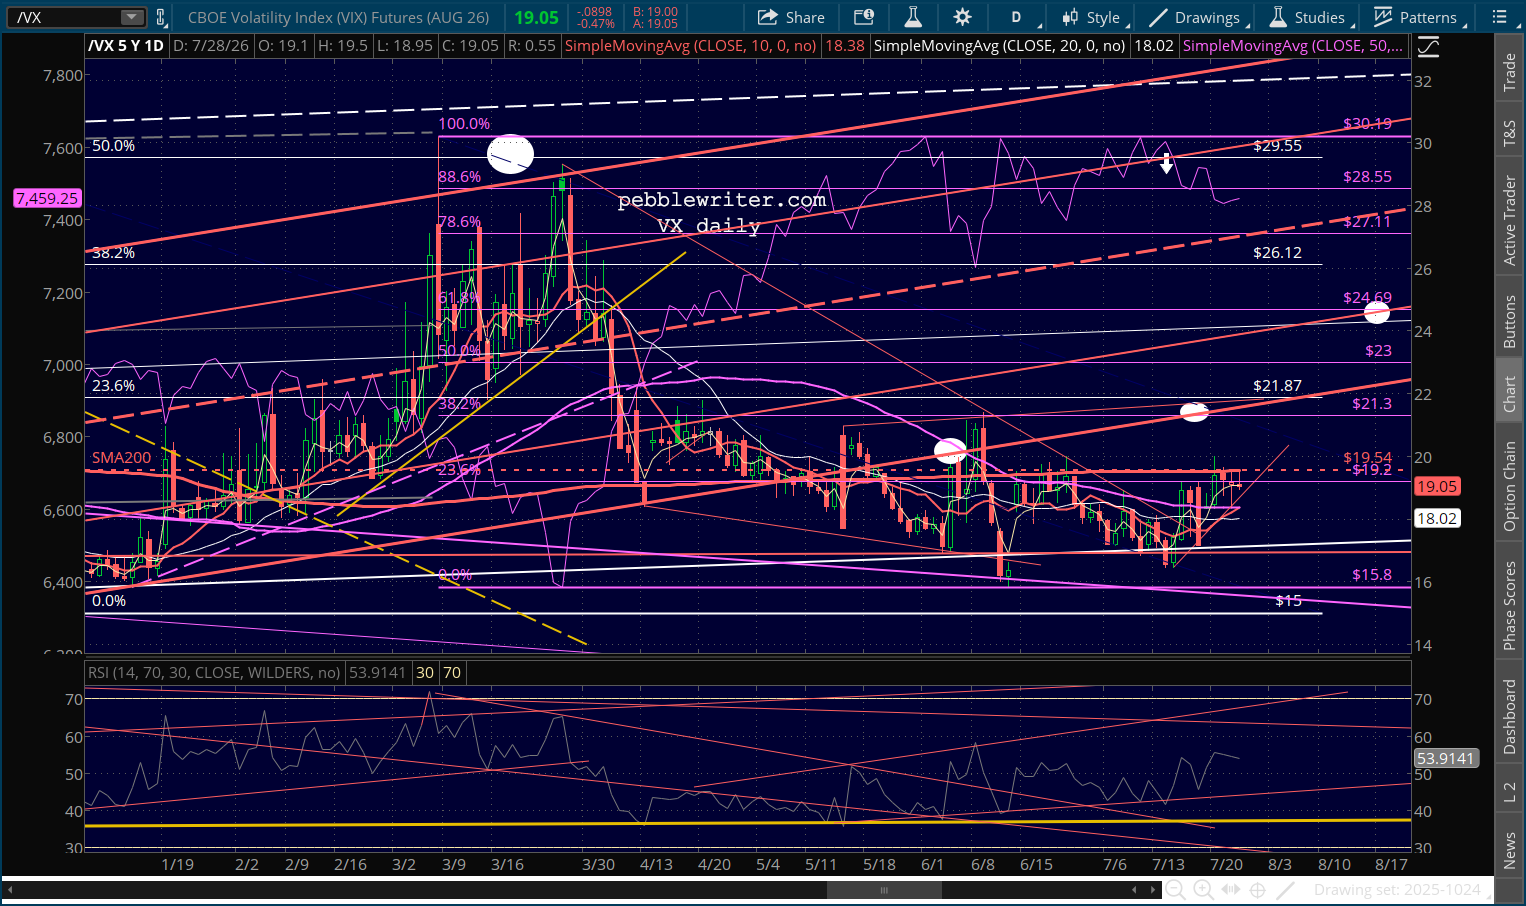
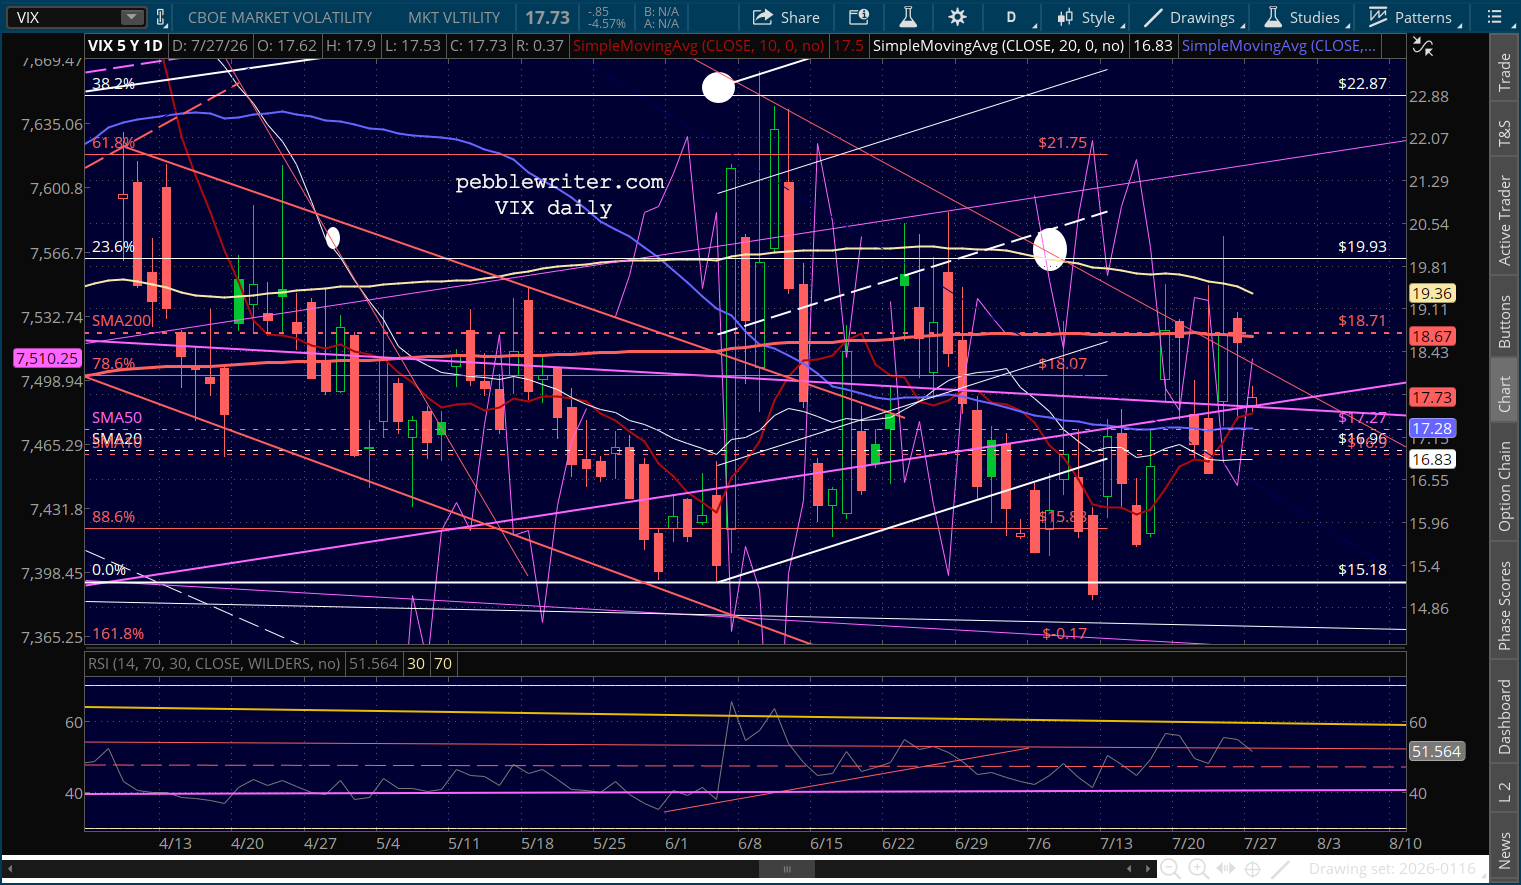
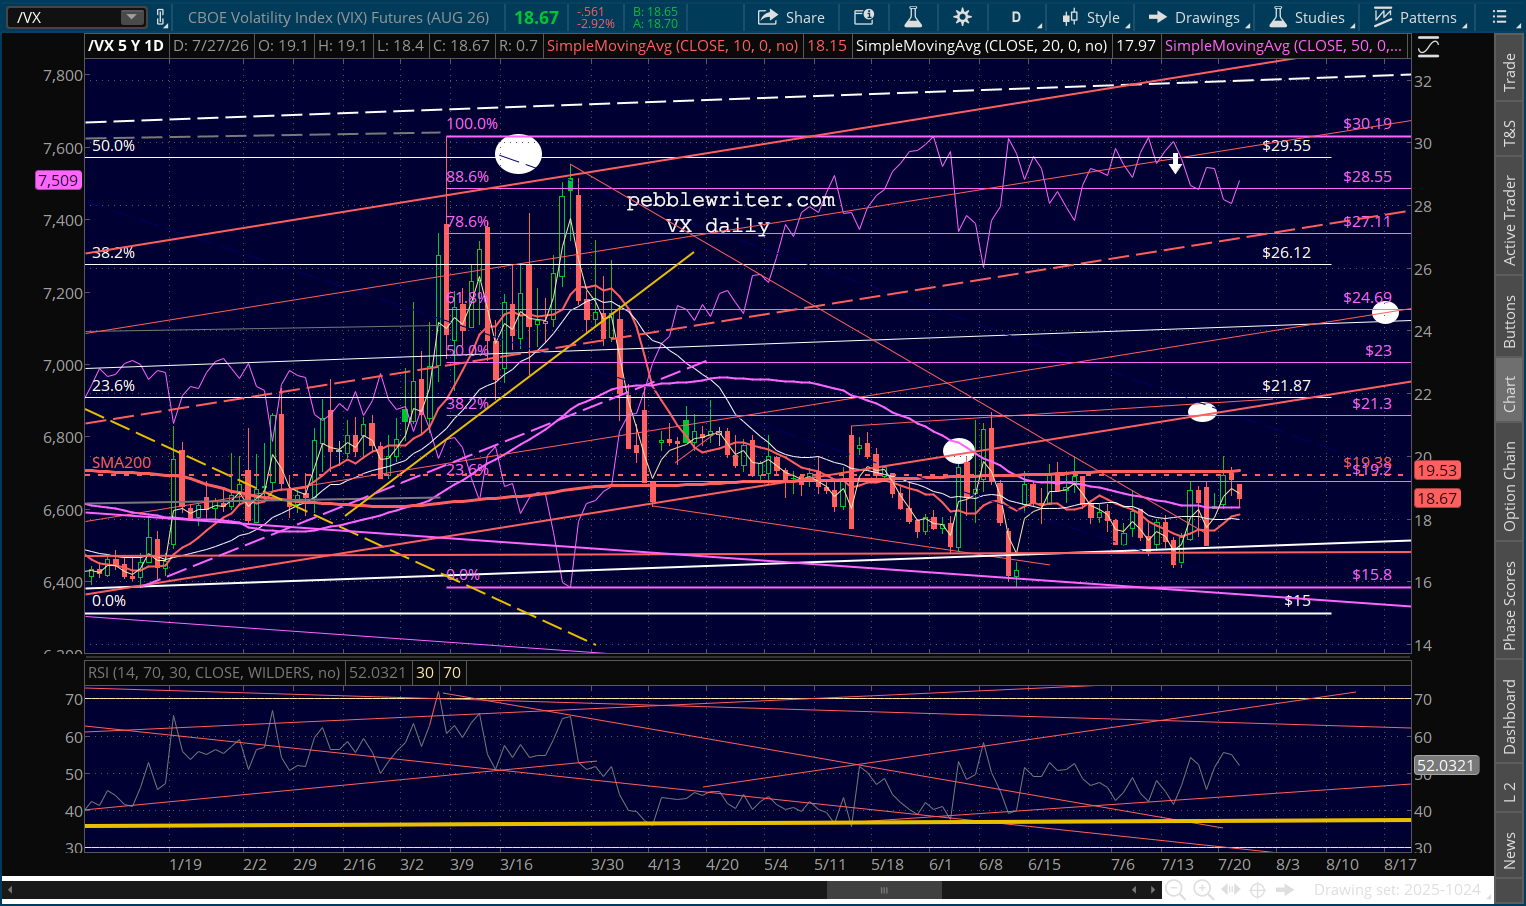
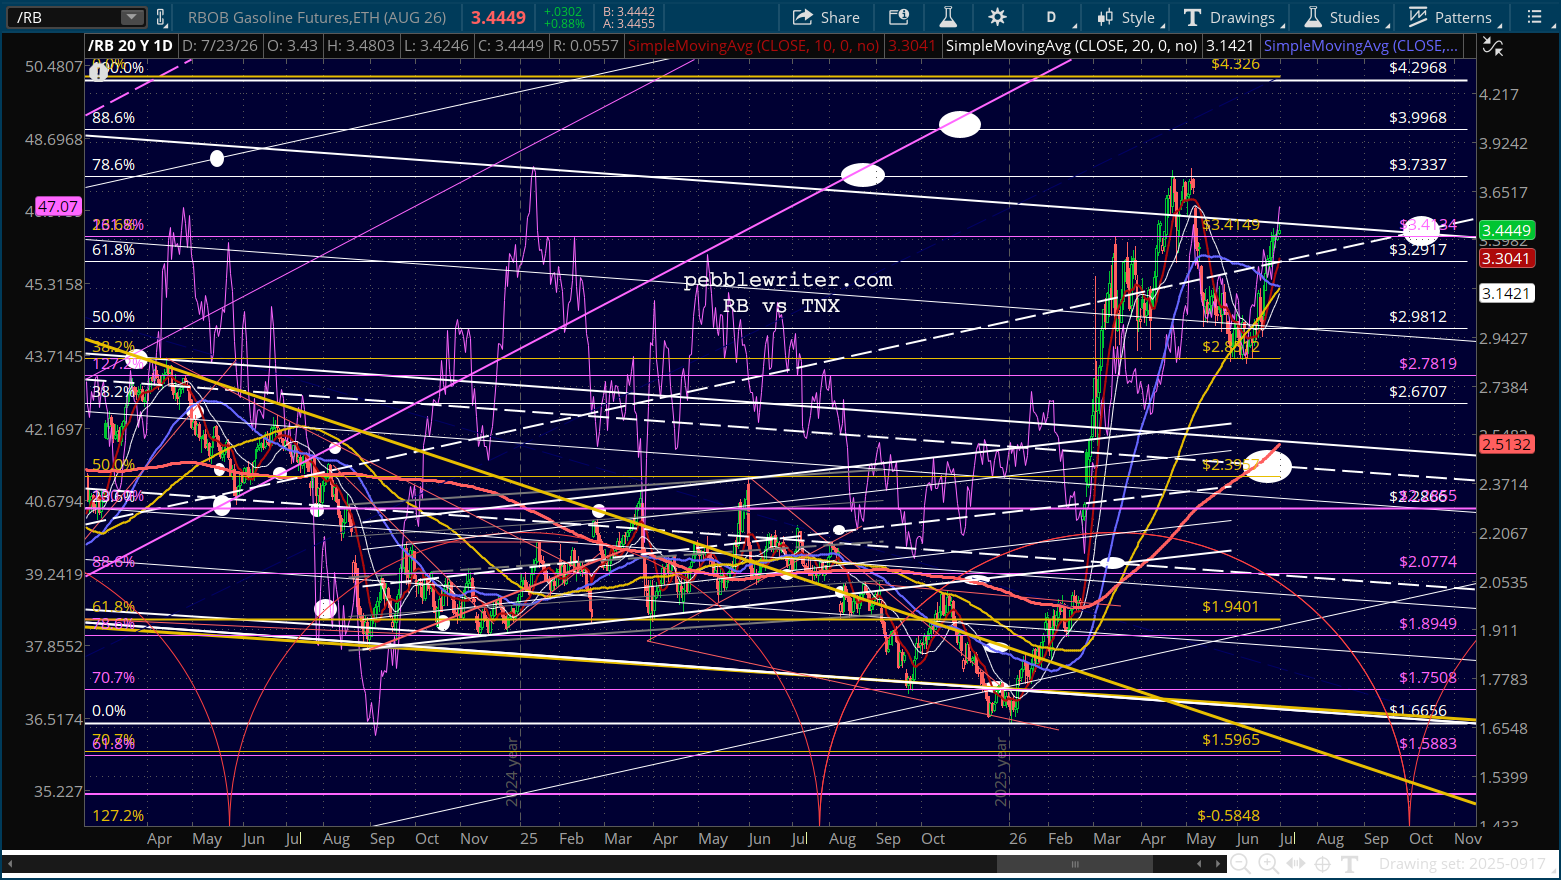
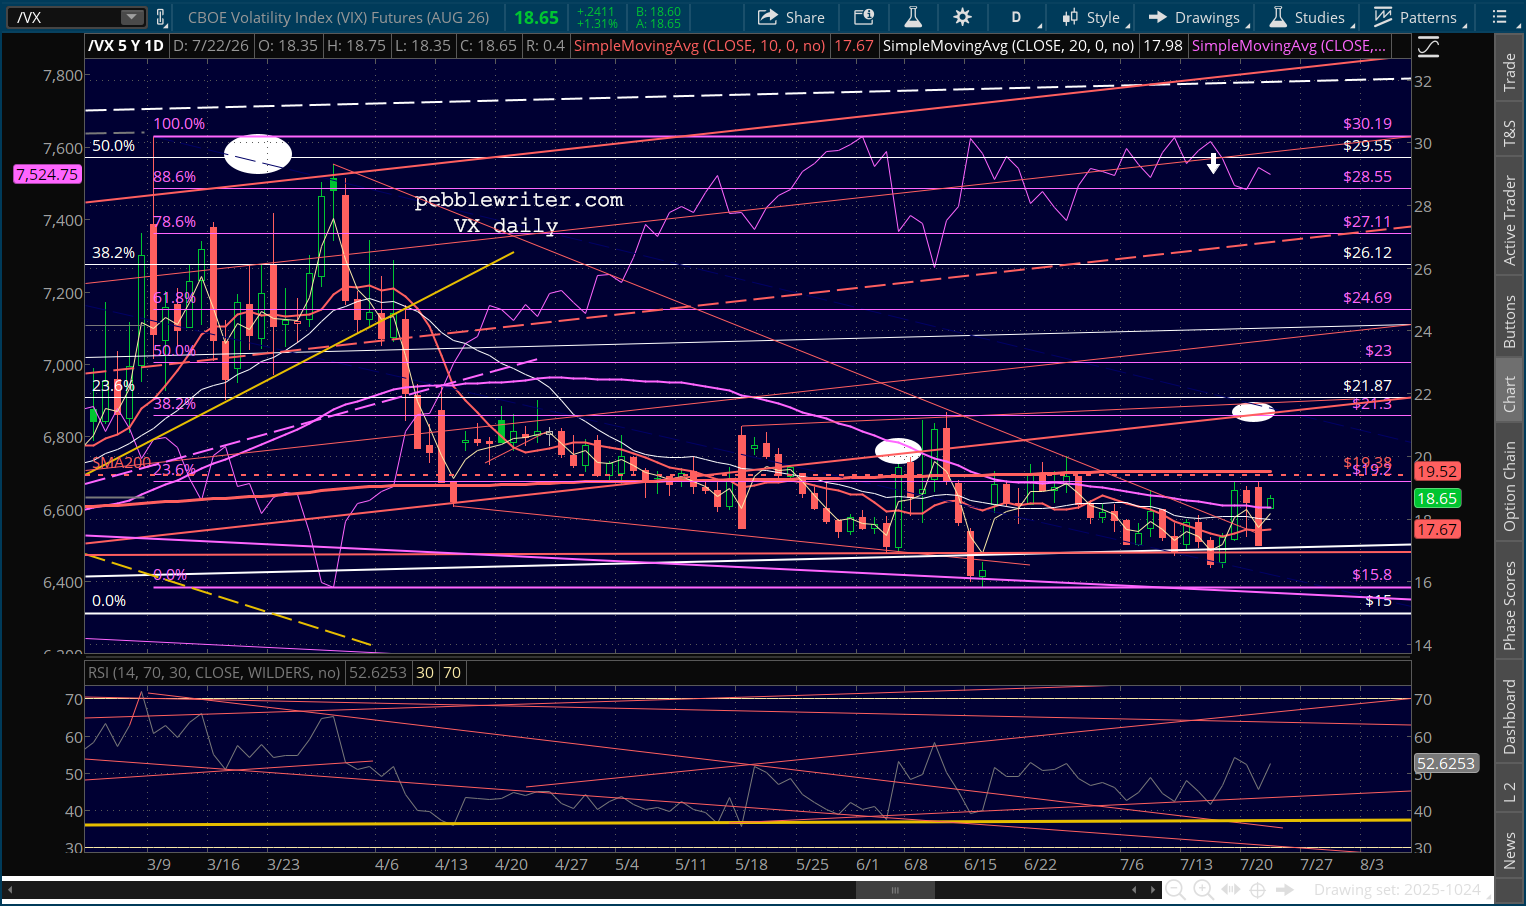
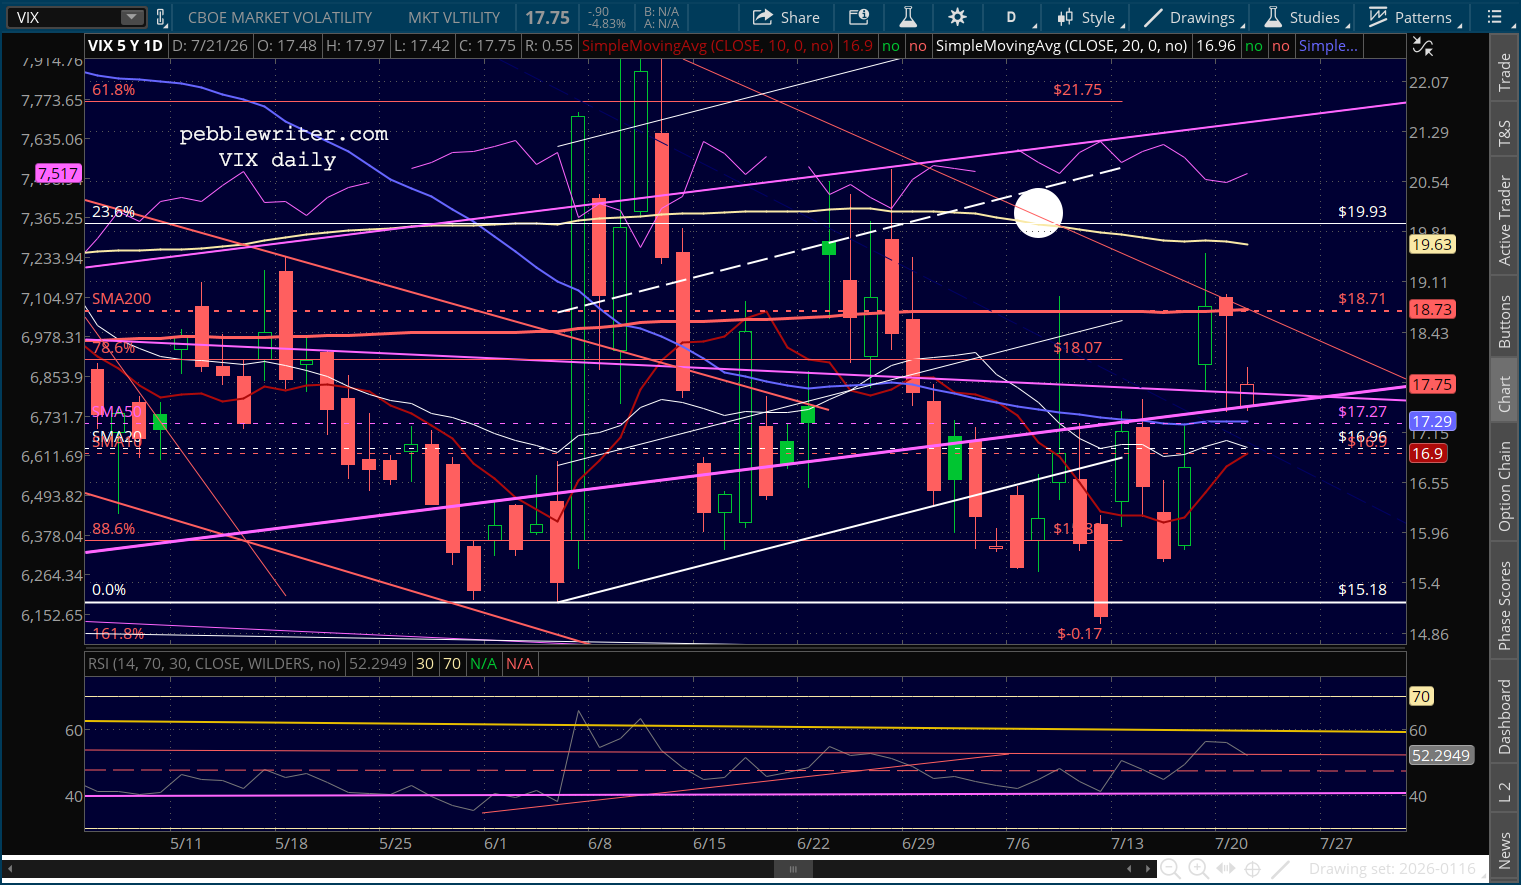
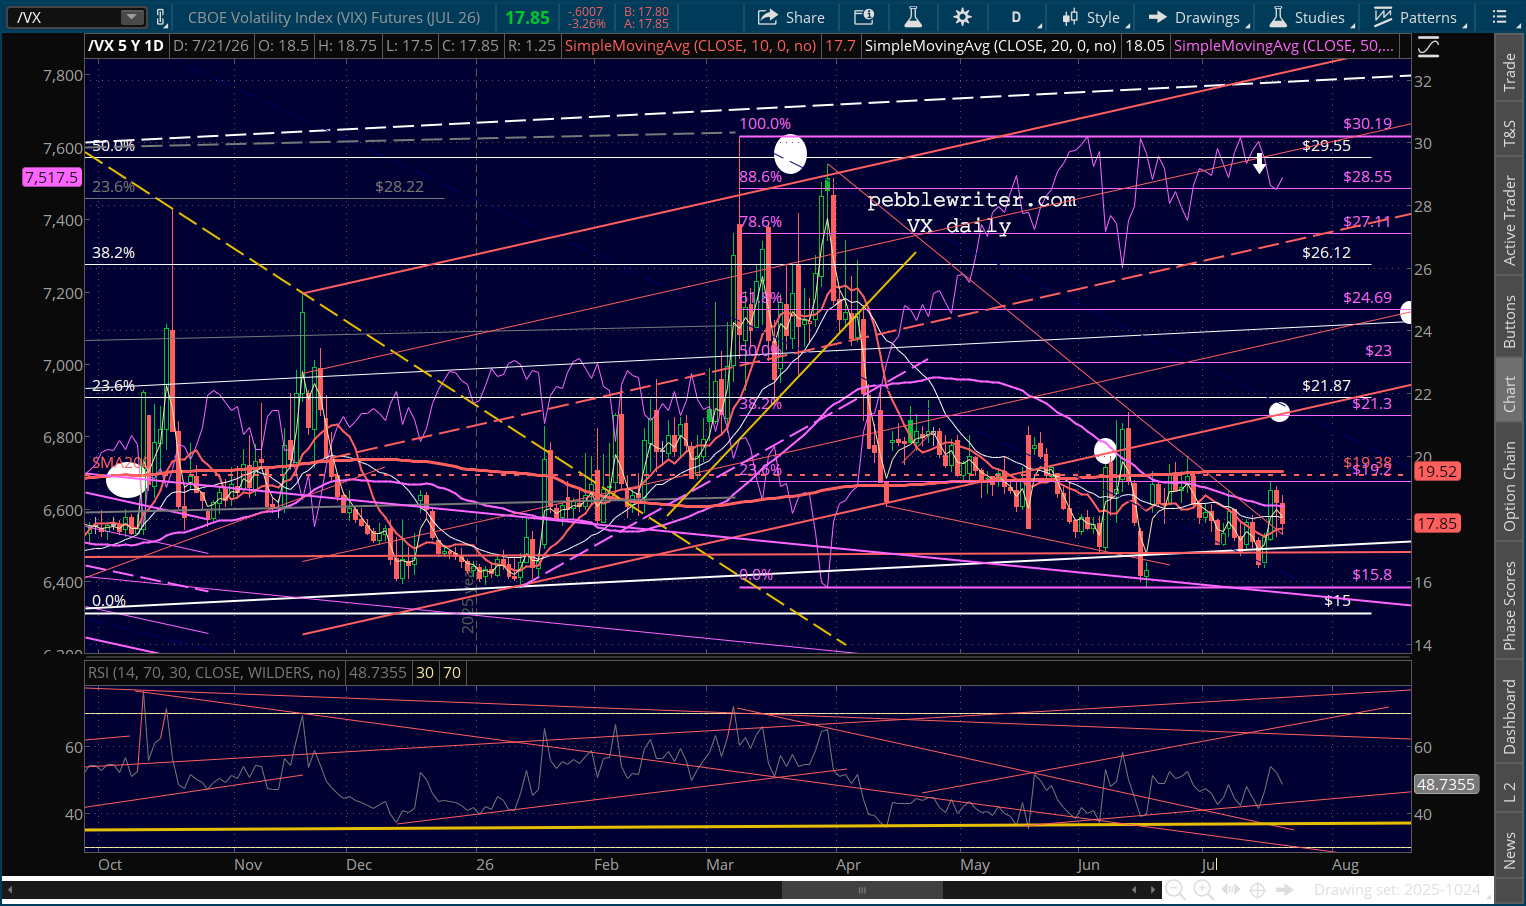
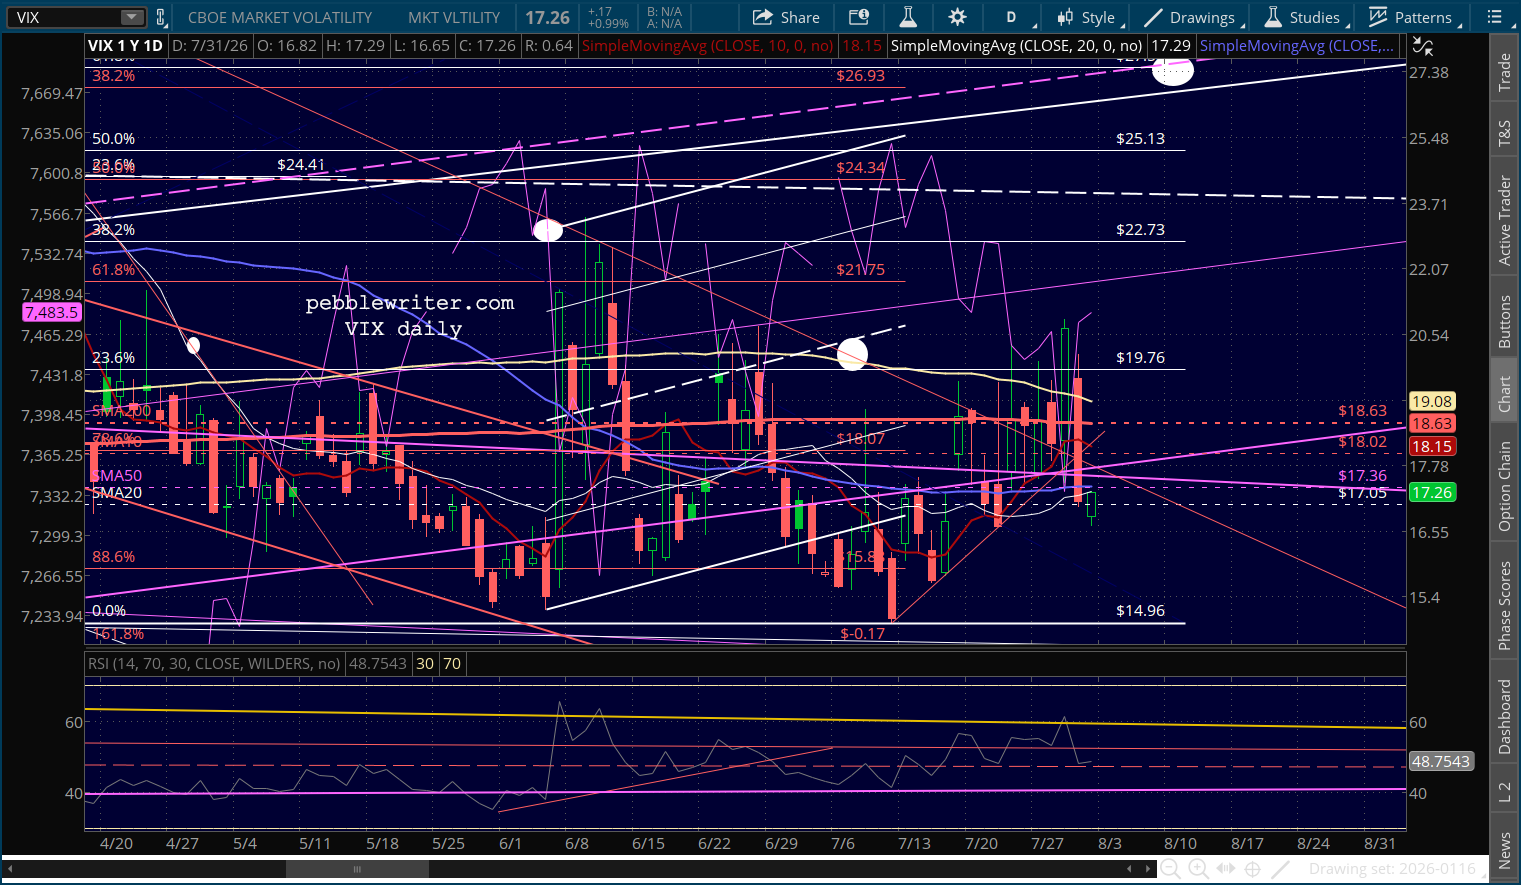
Another correction was averted in the usual way, with investors assured that there’s nothing to worry about. Volatility is under control…
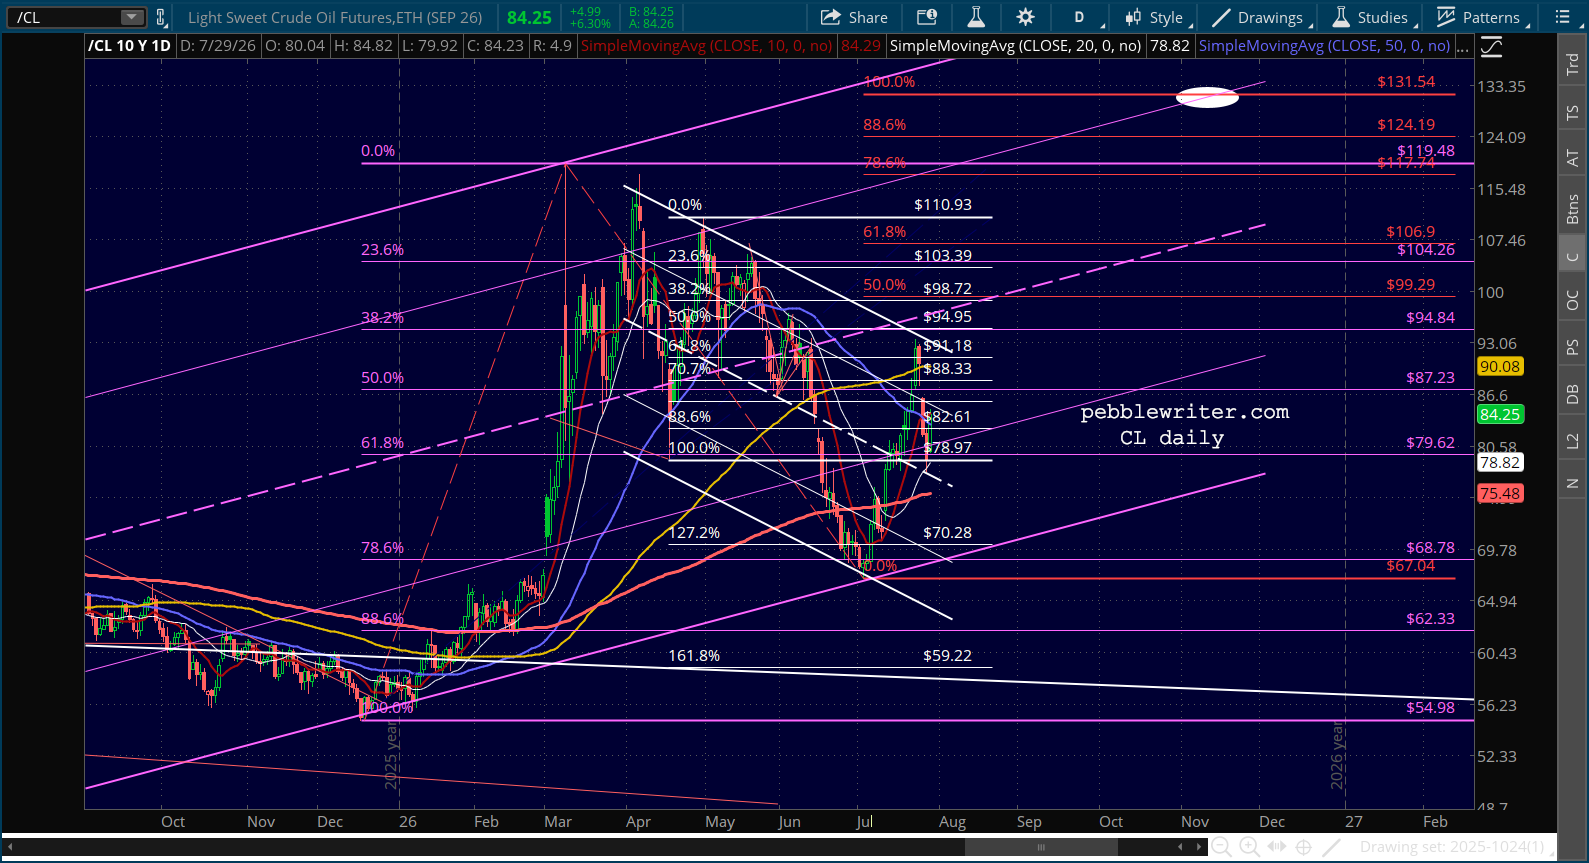
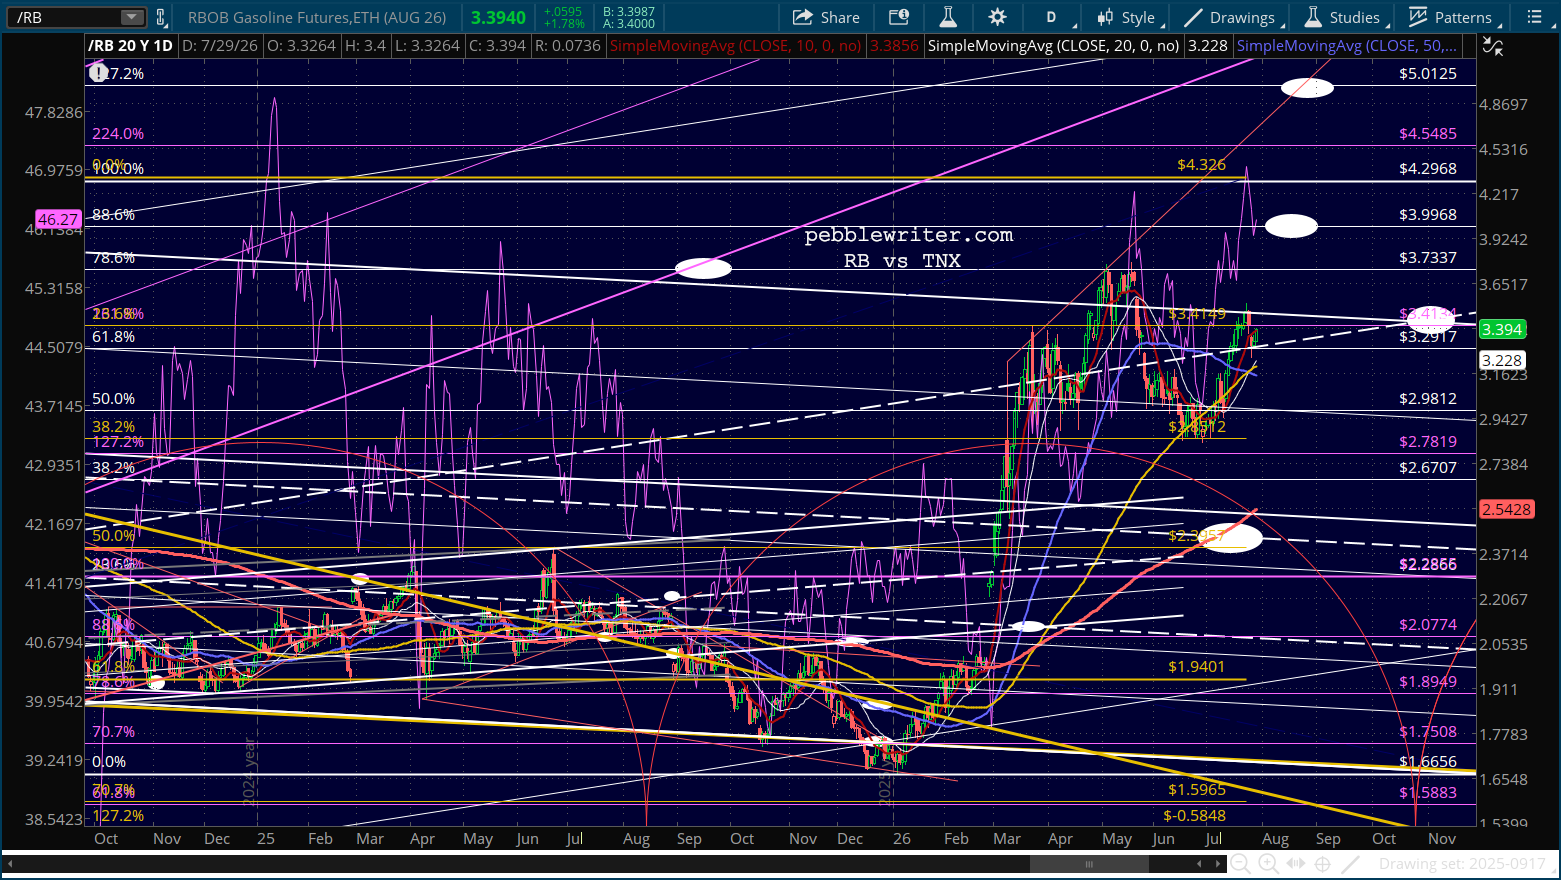
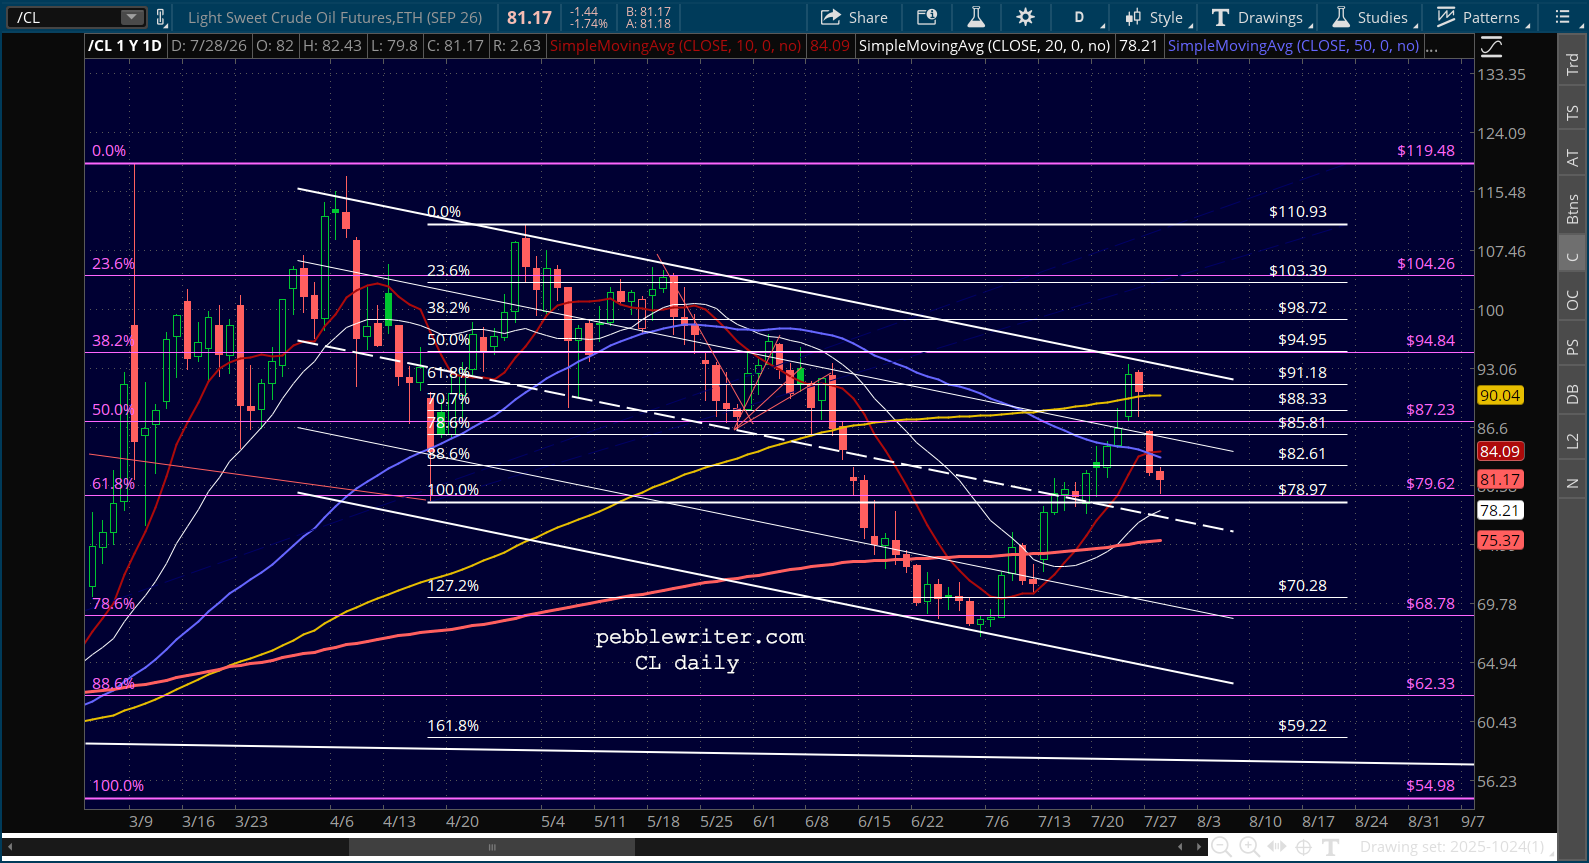
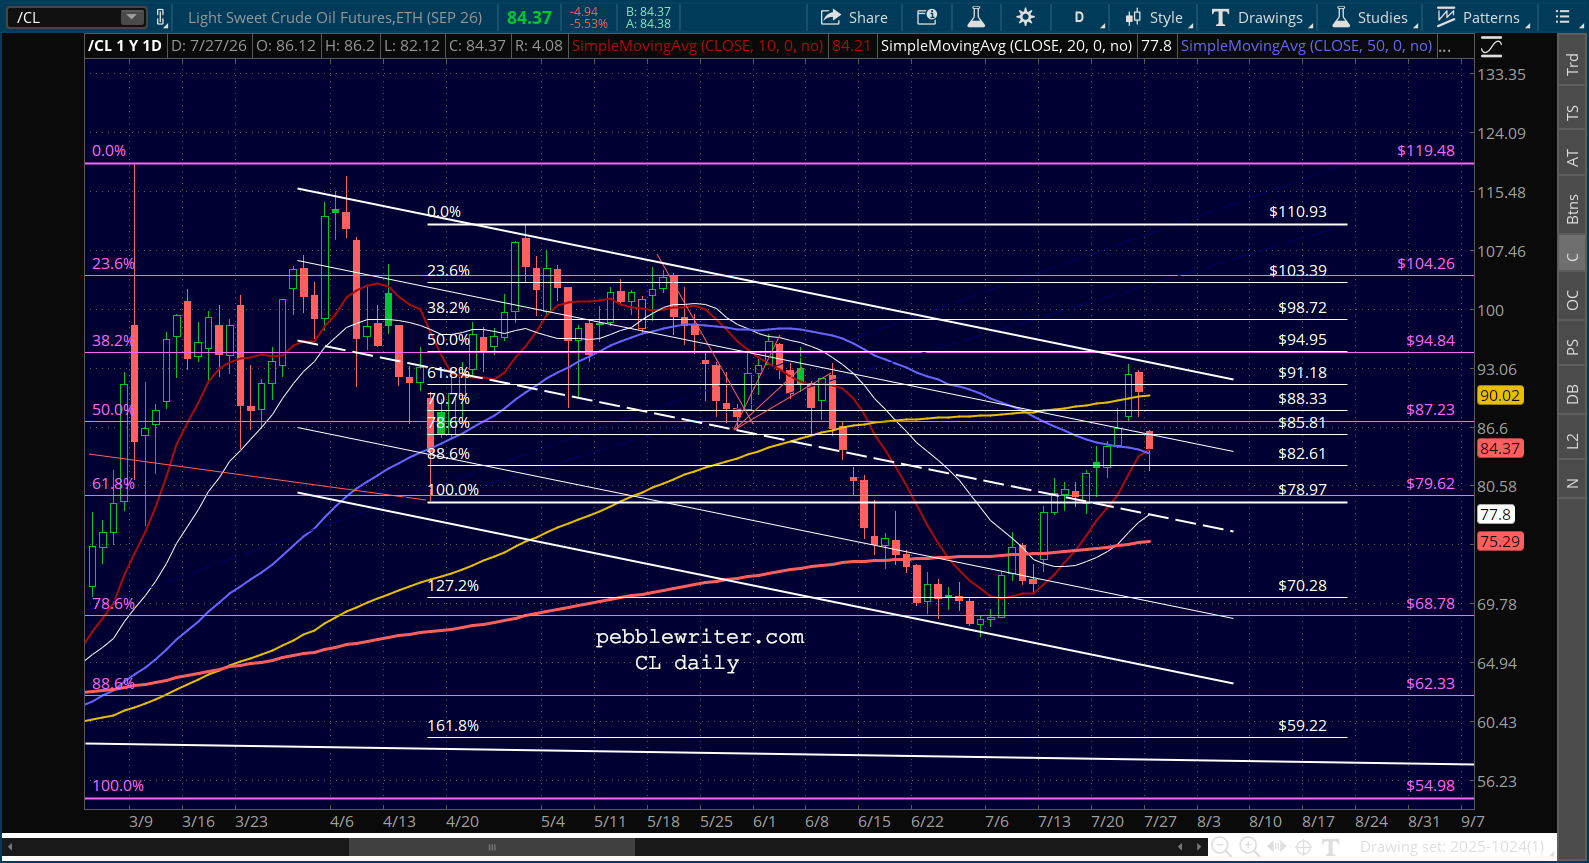
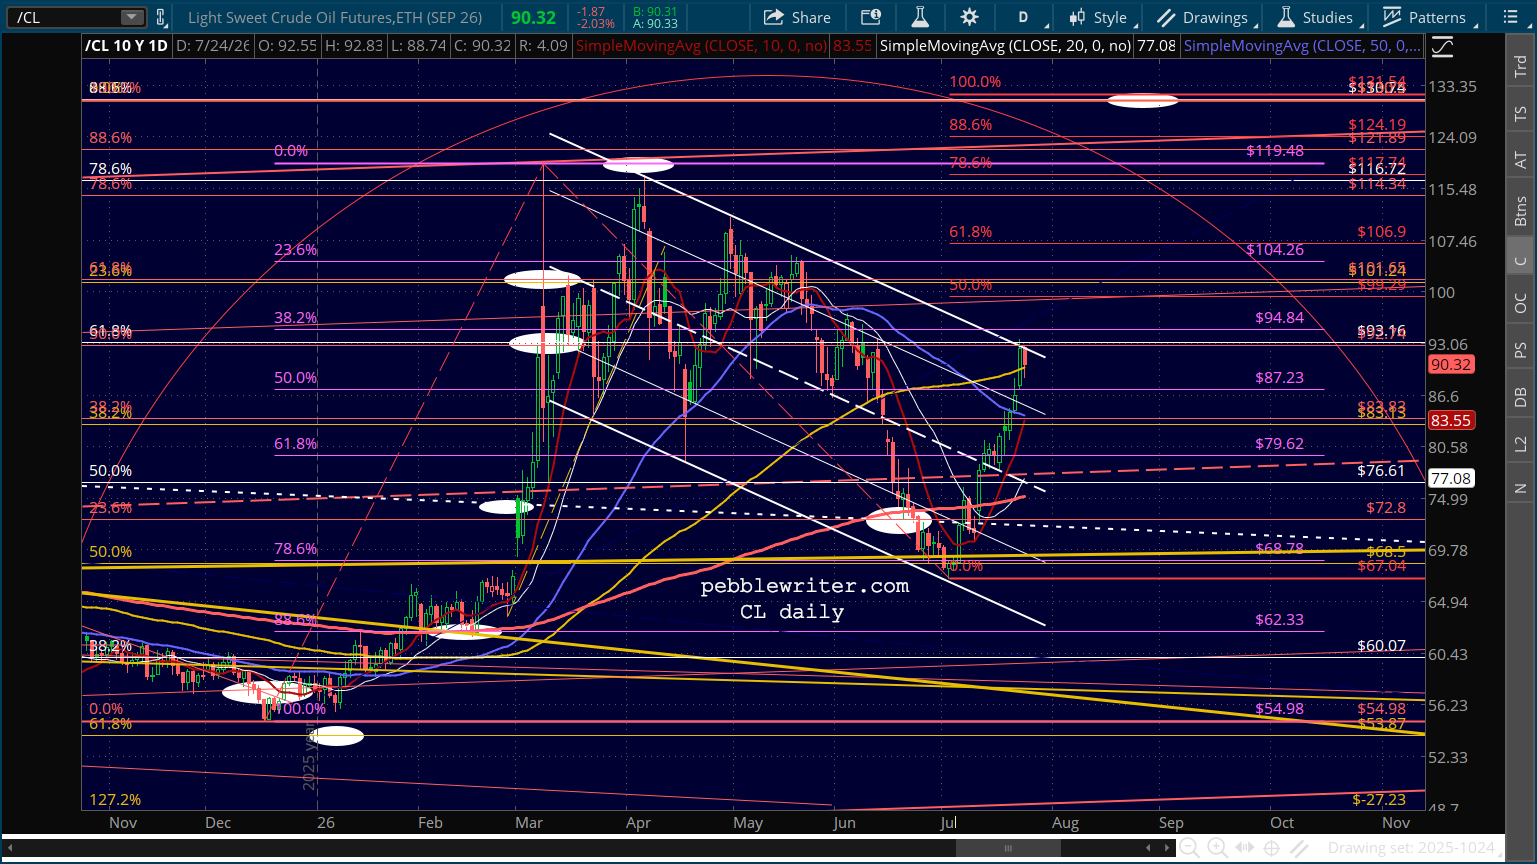
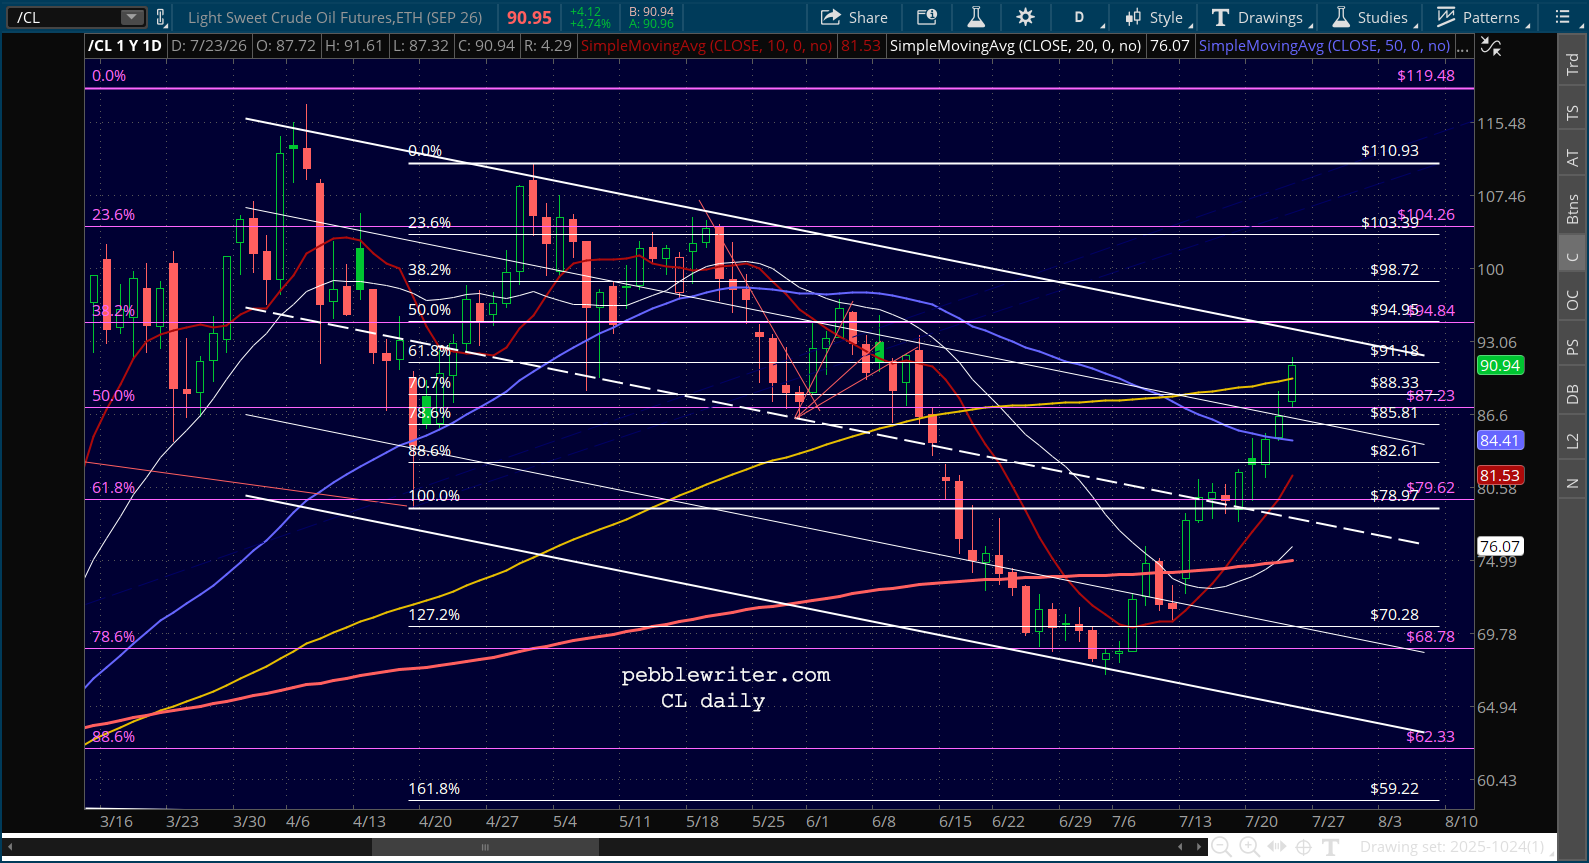
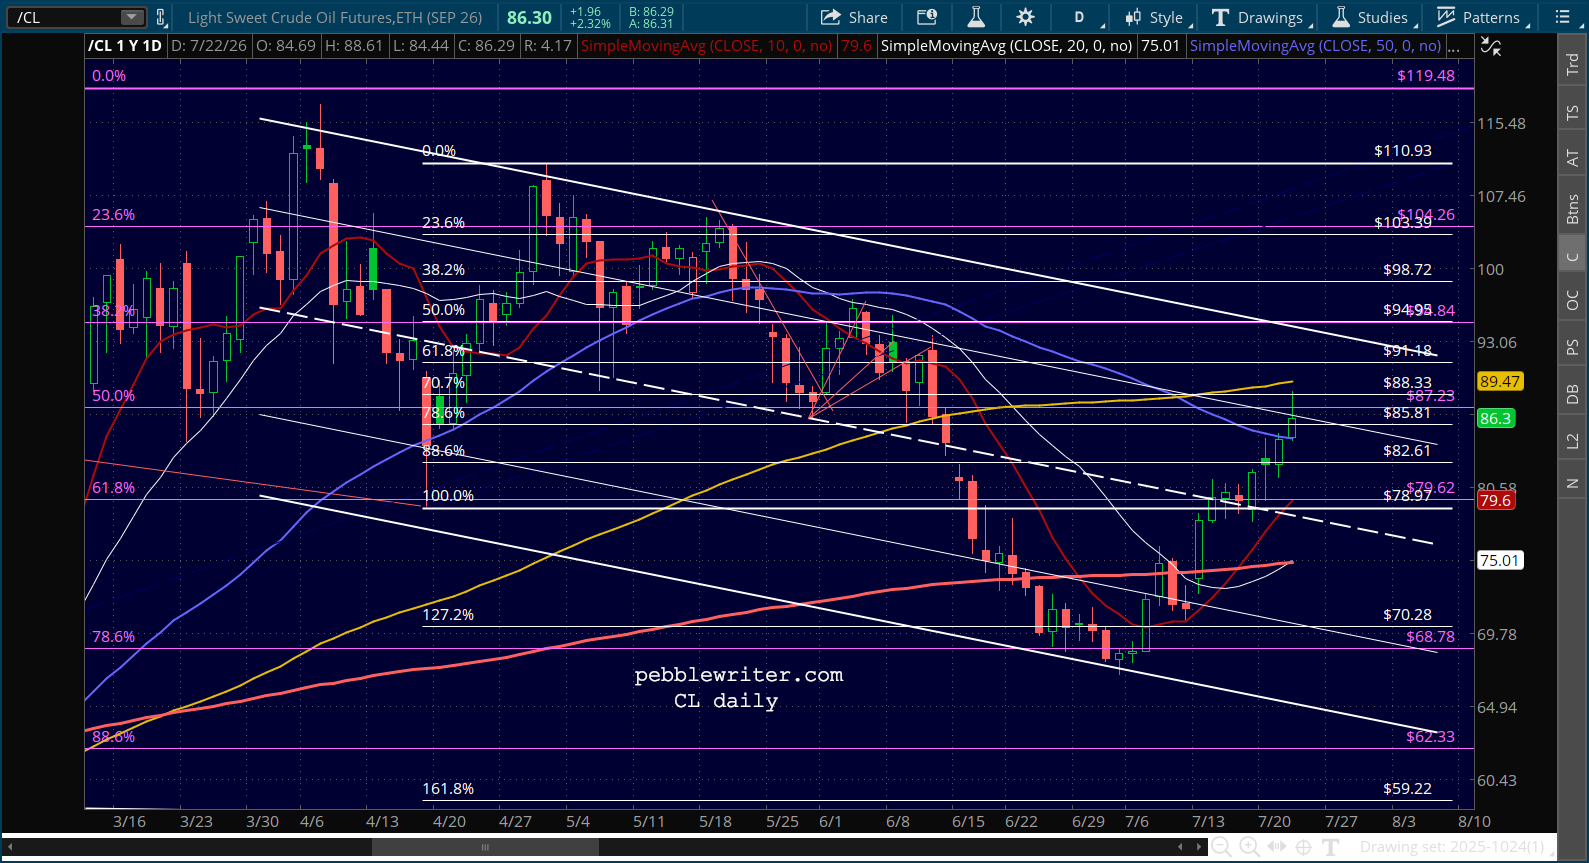
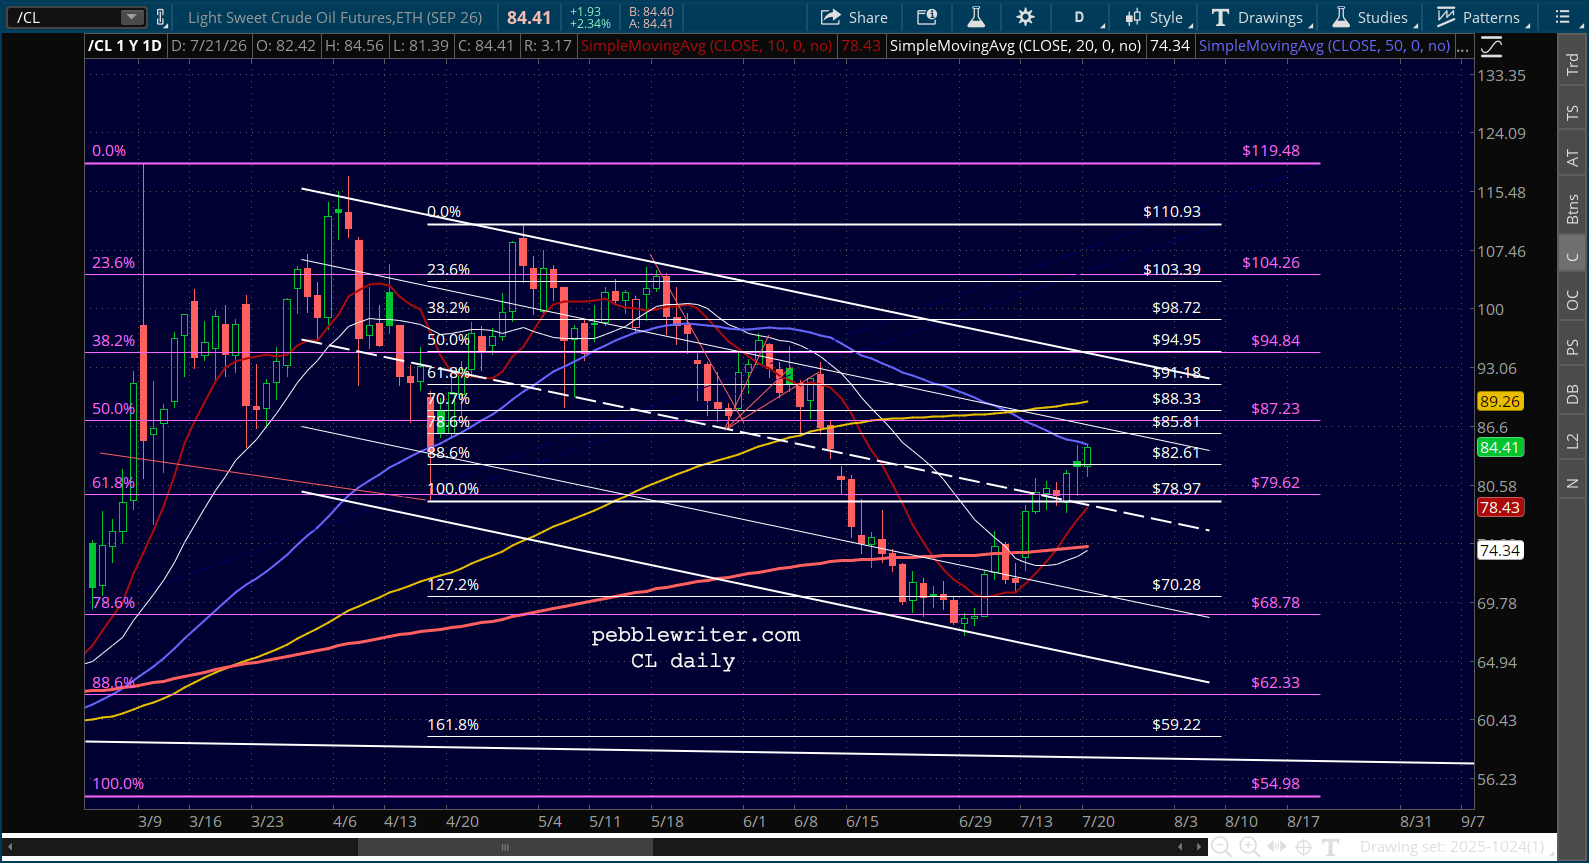
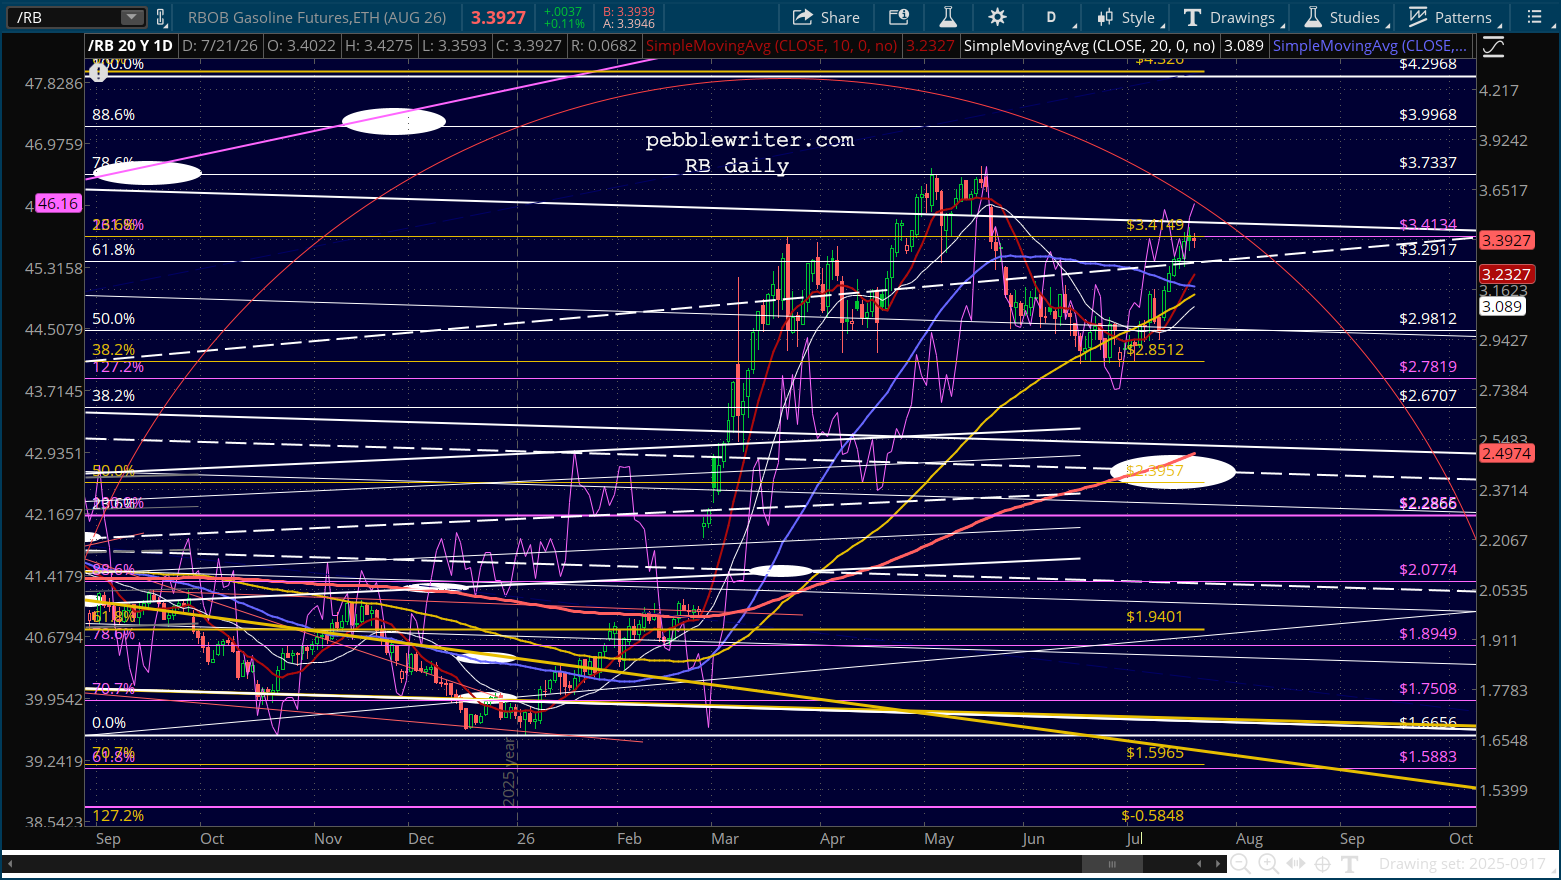
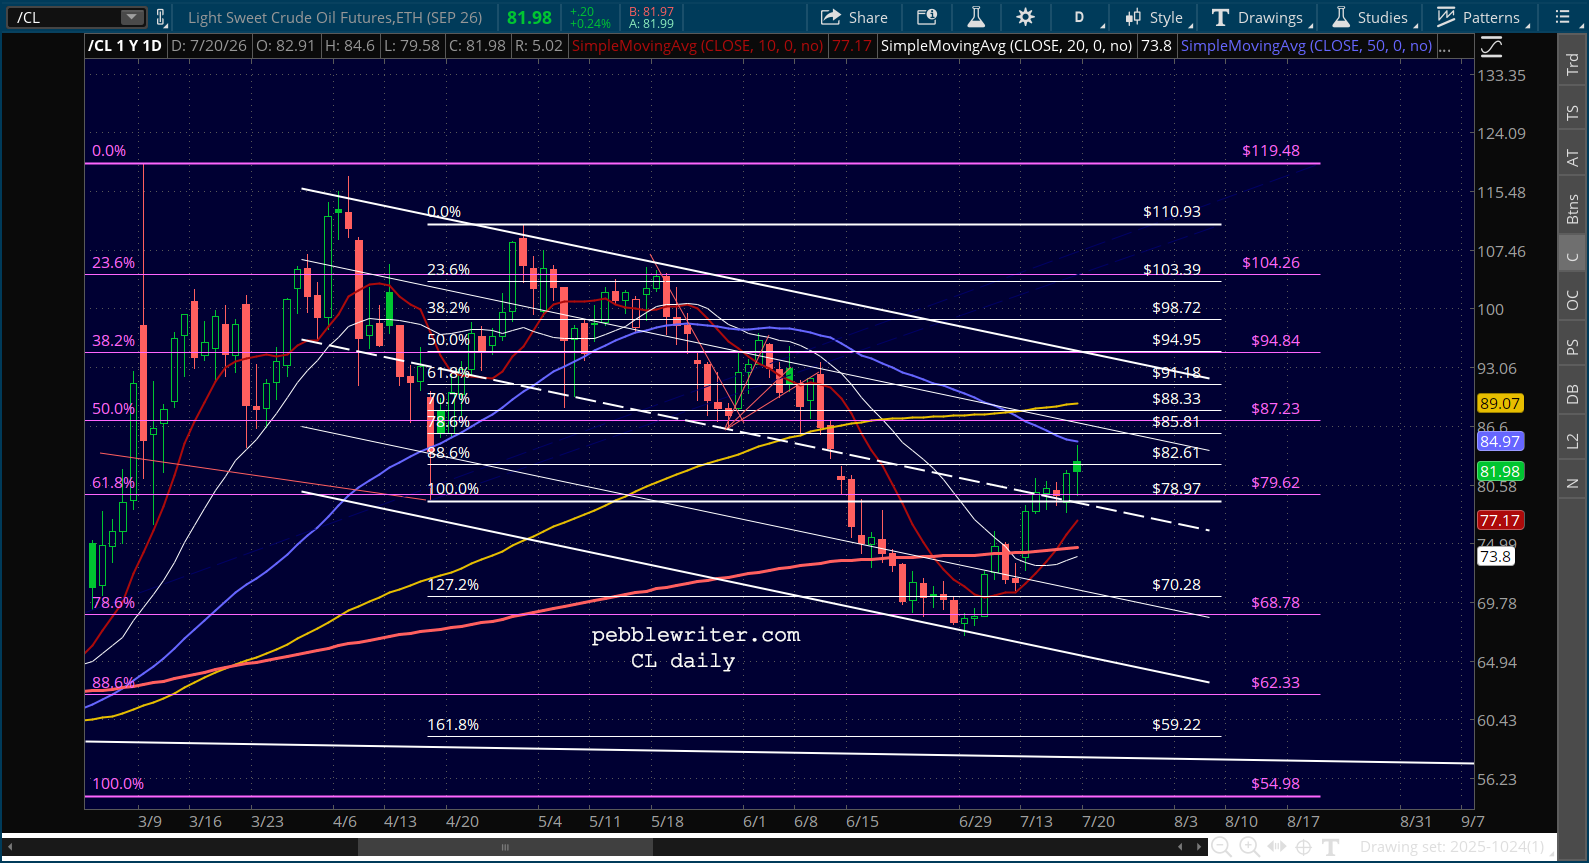
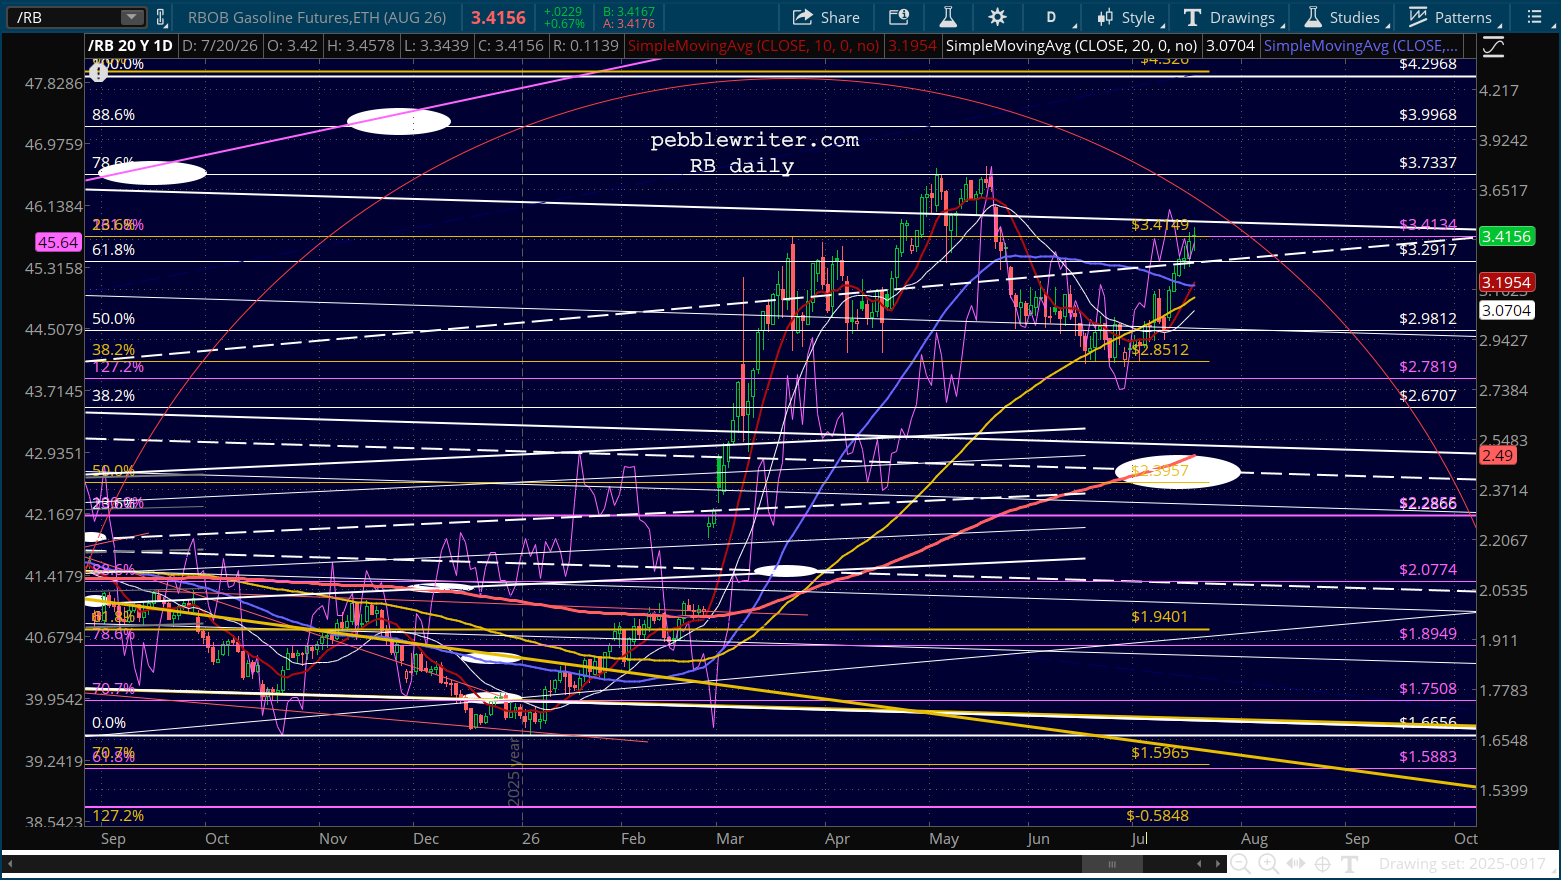
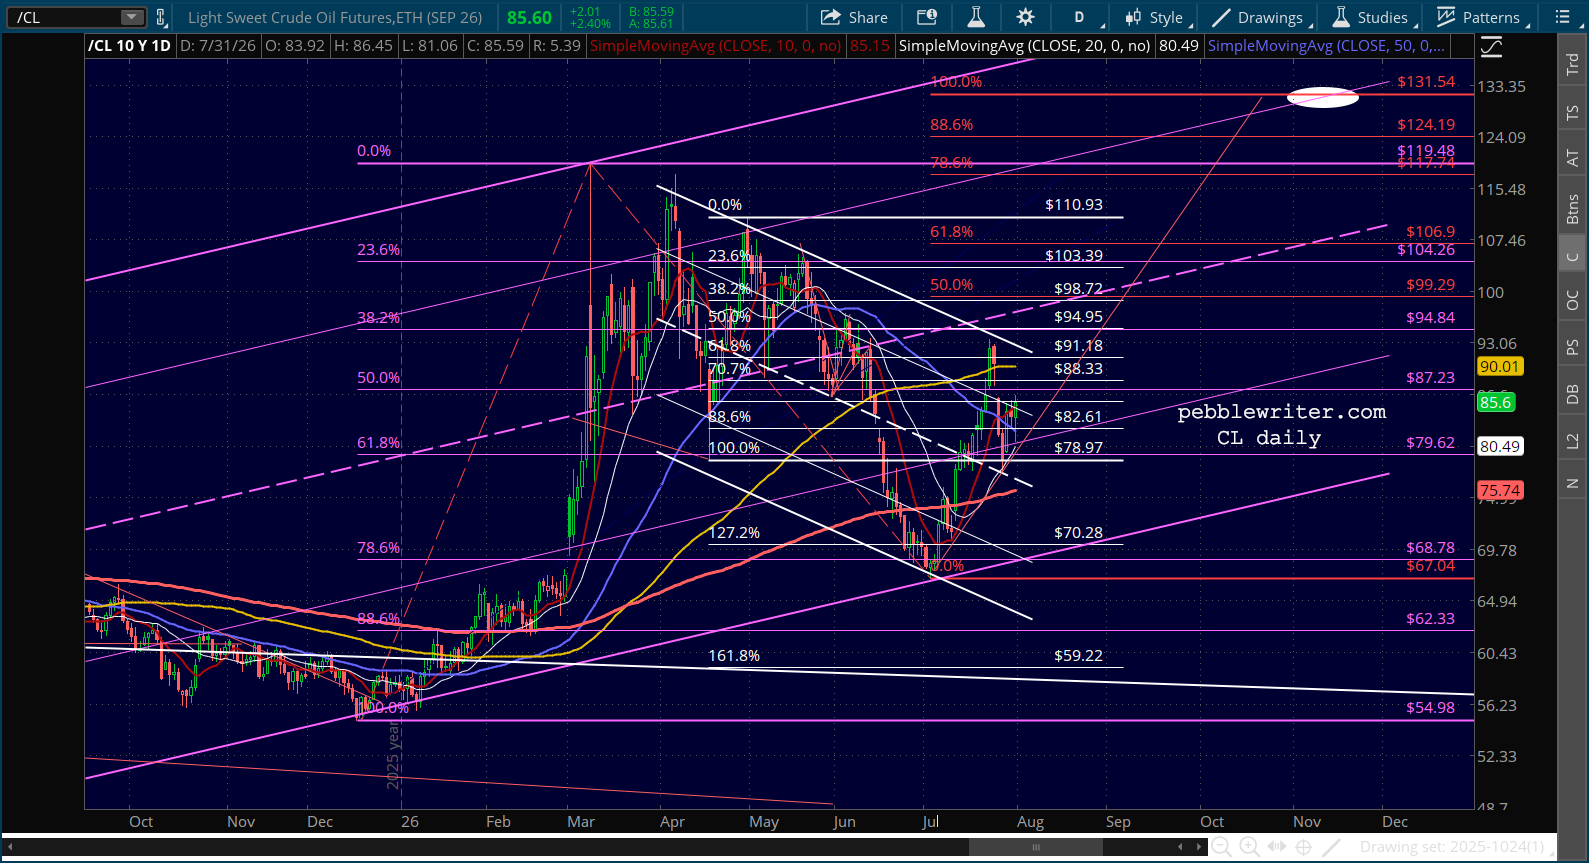
…oil prices are returning to normal…
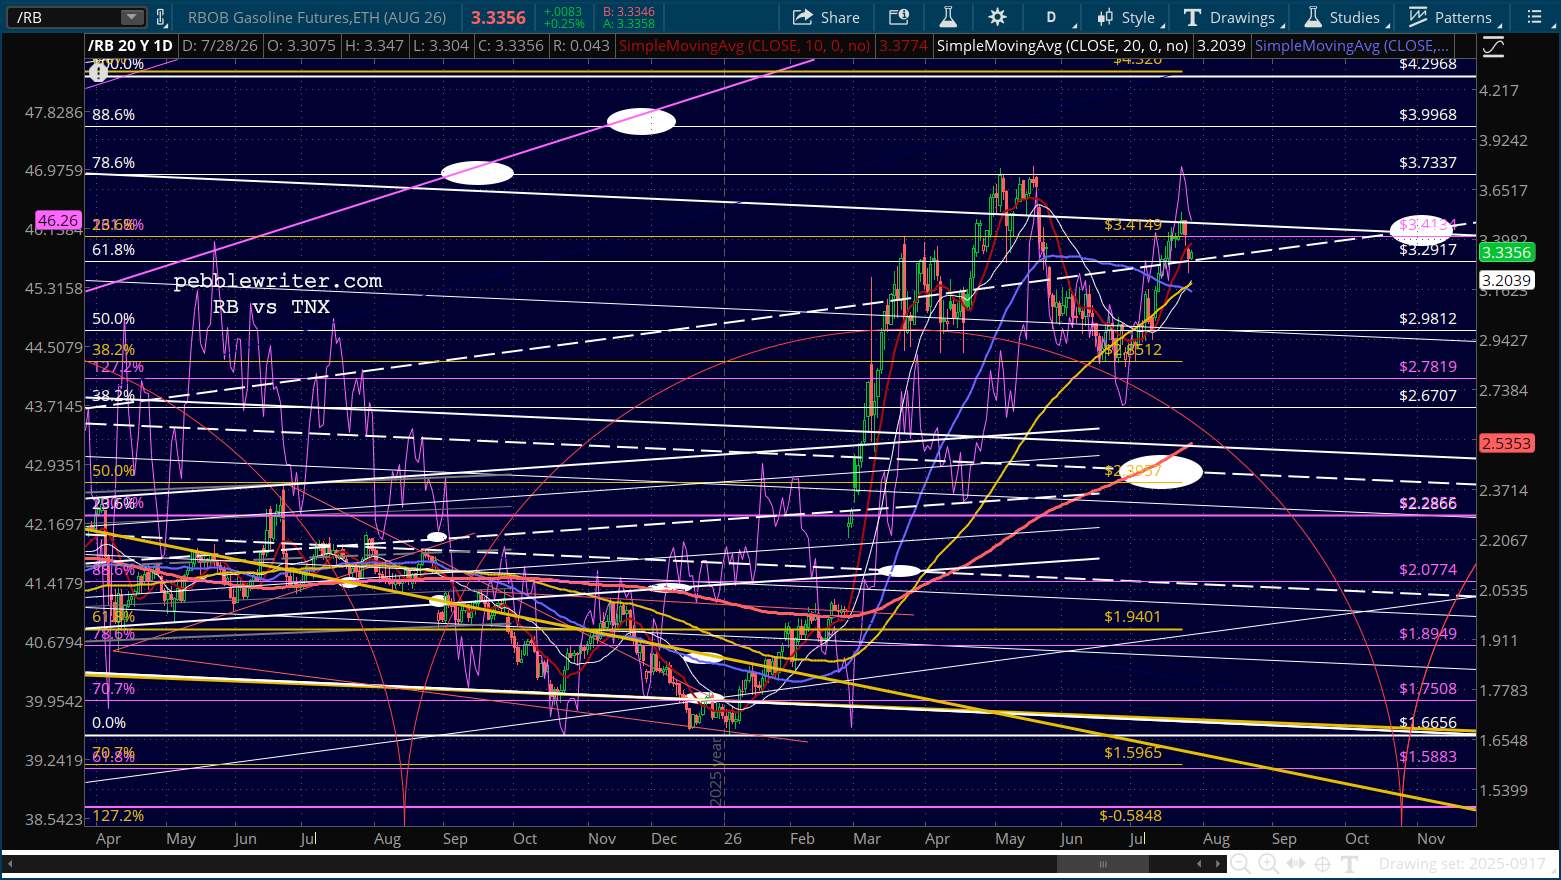
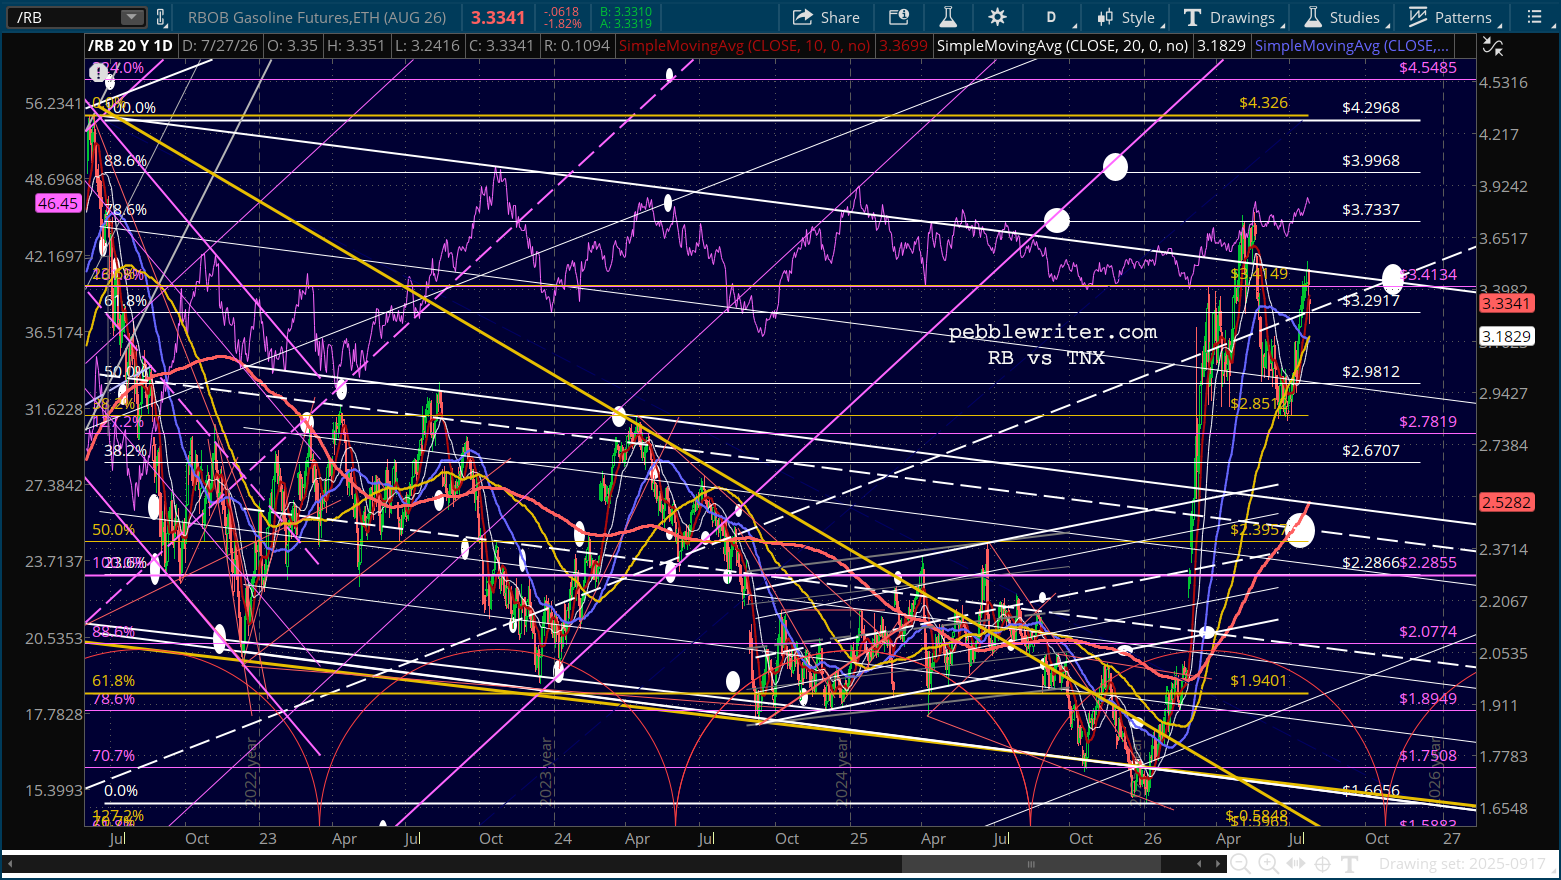
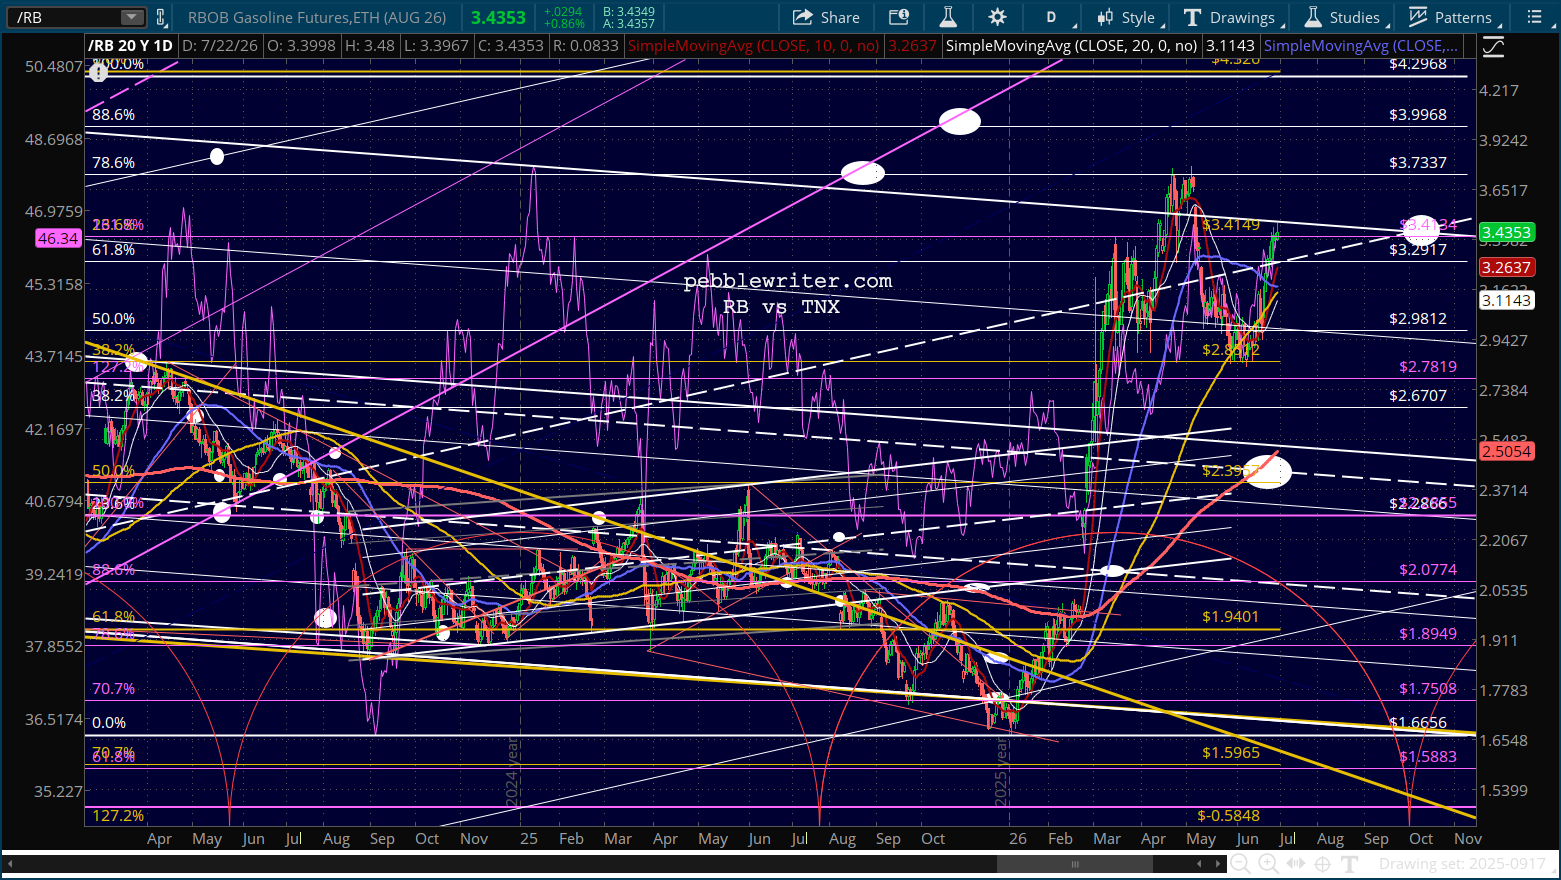
…inflation is under control…
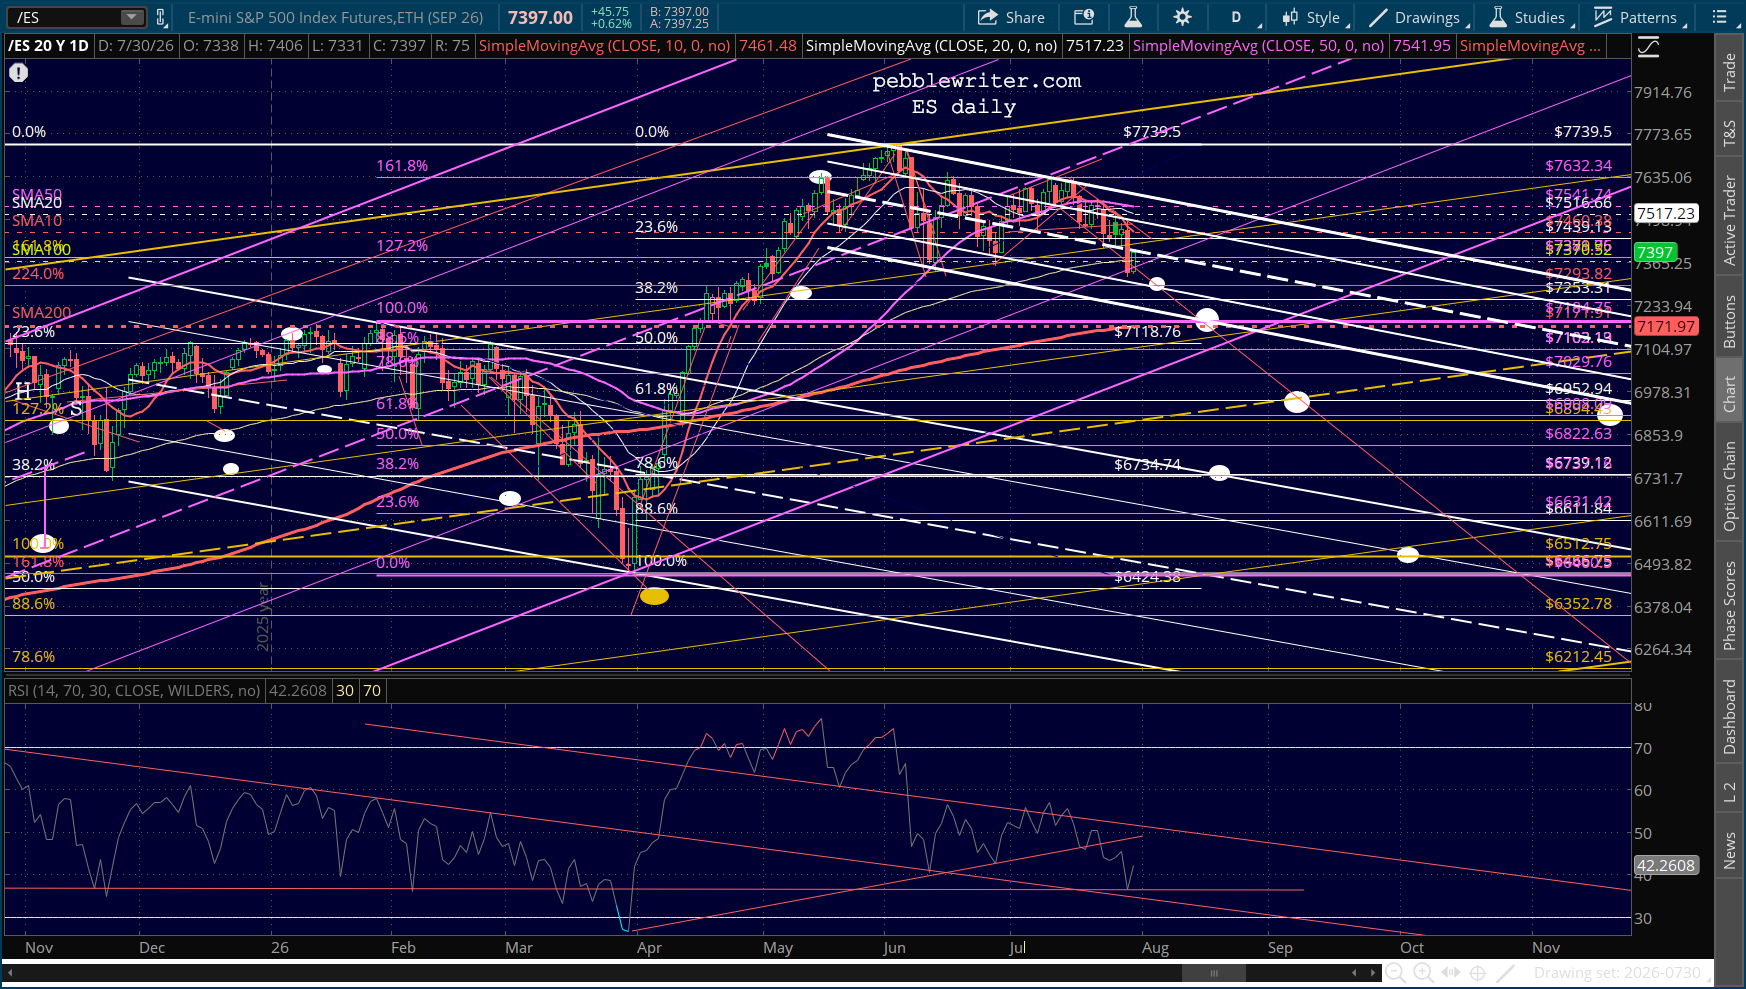
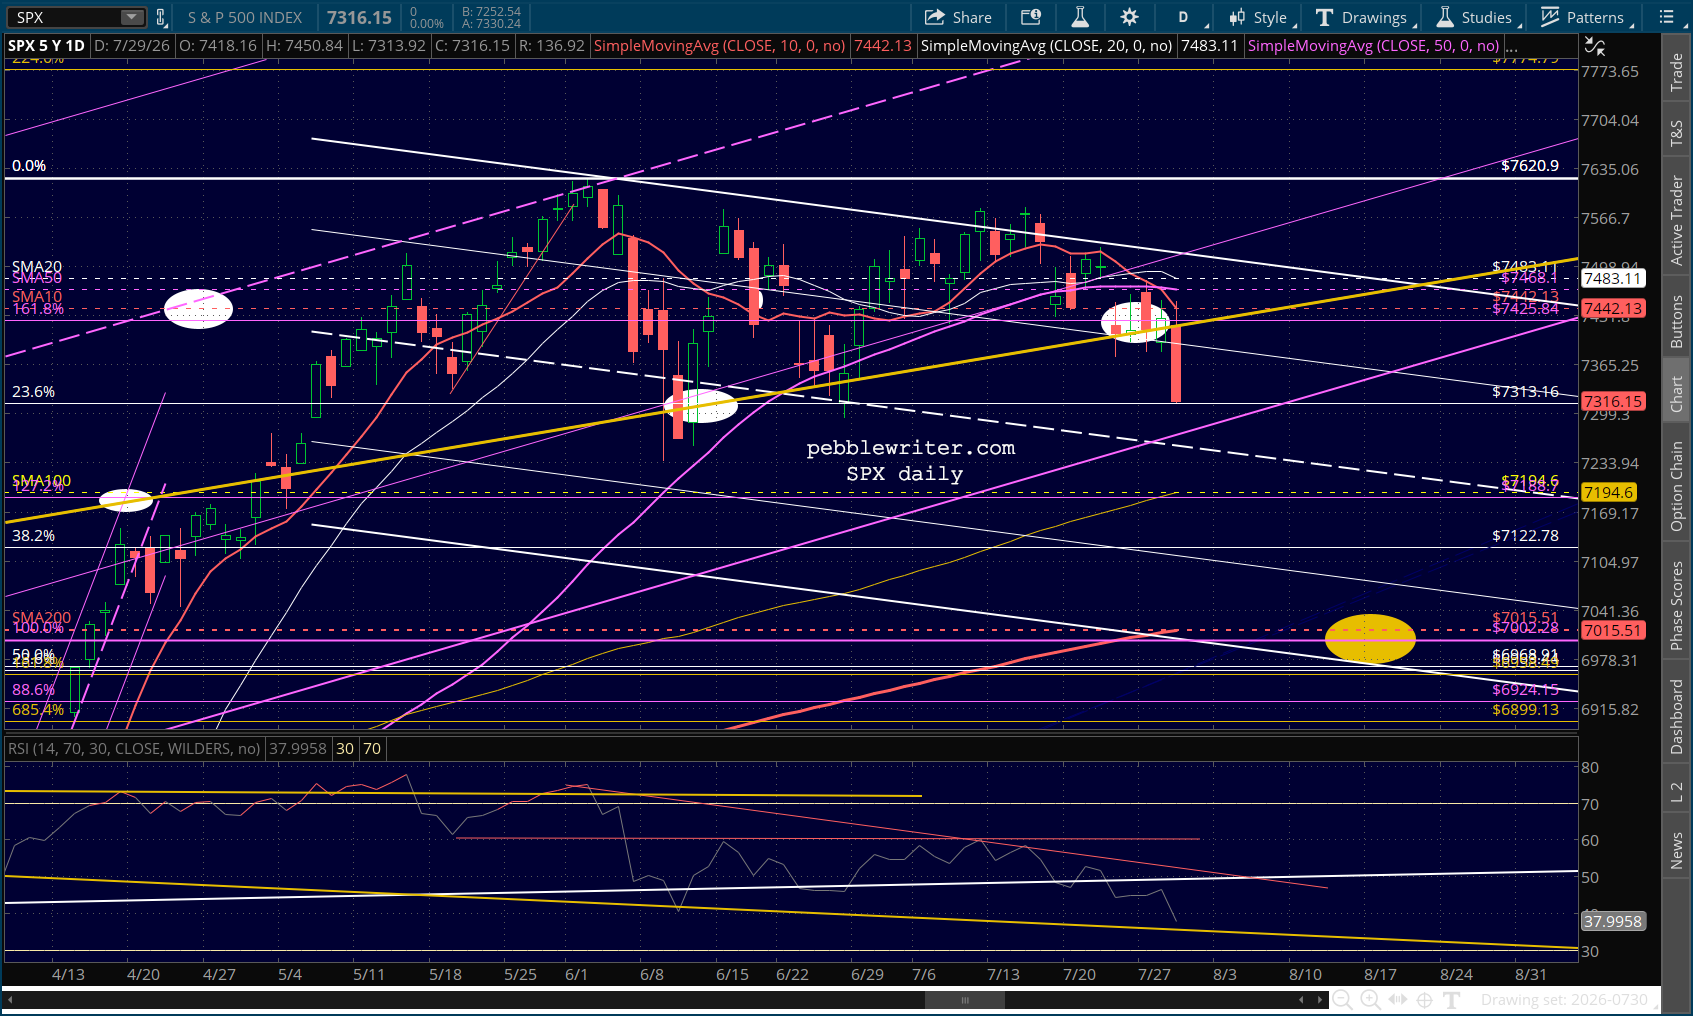
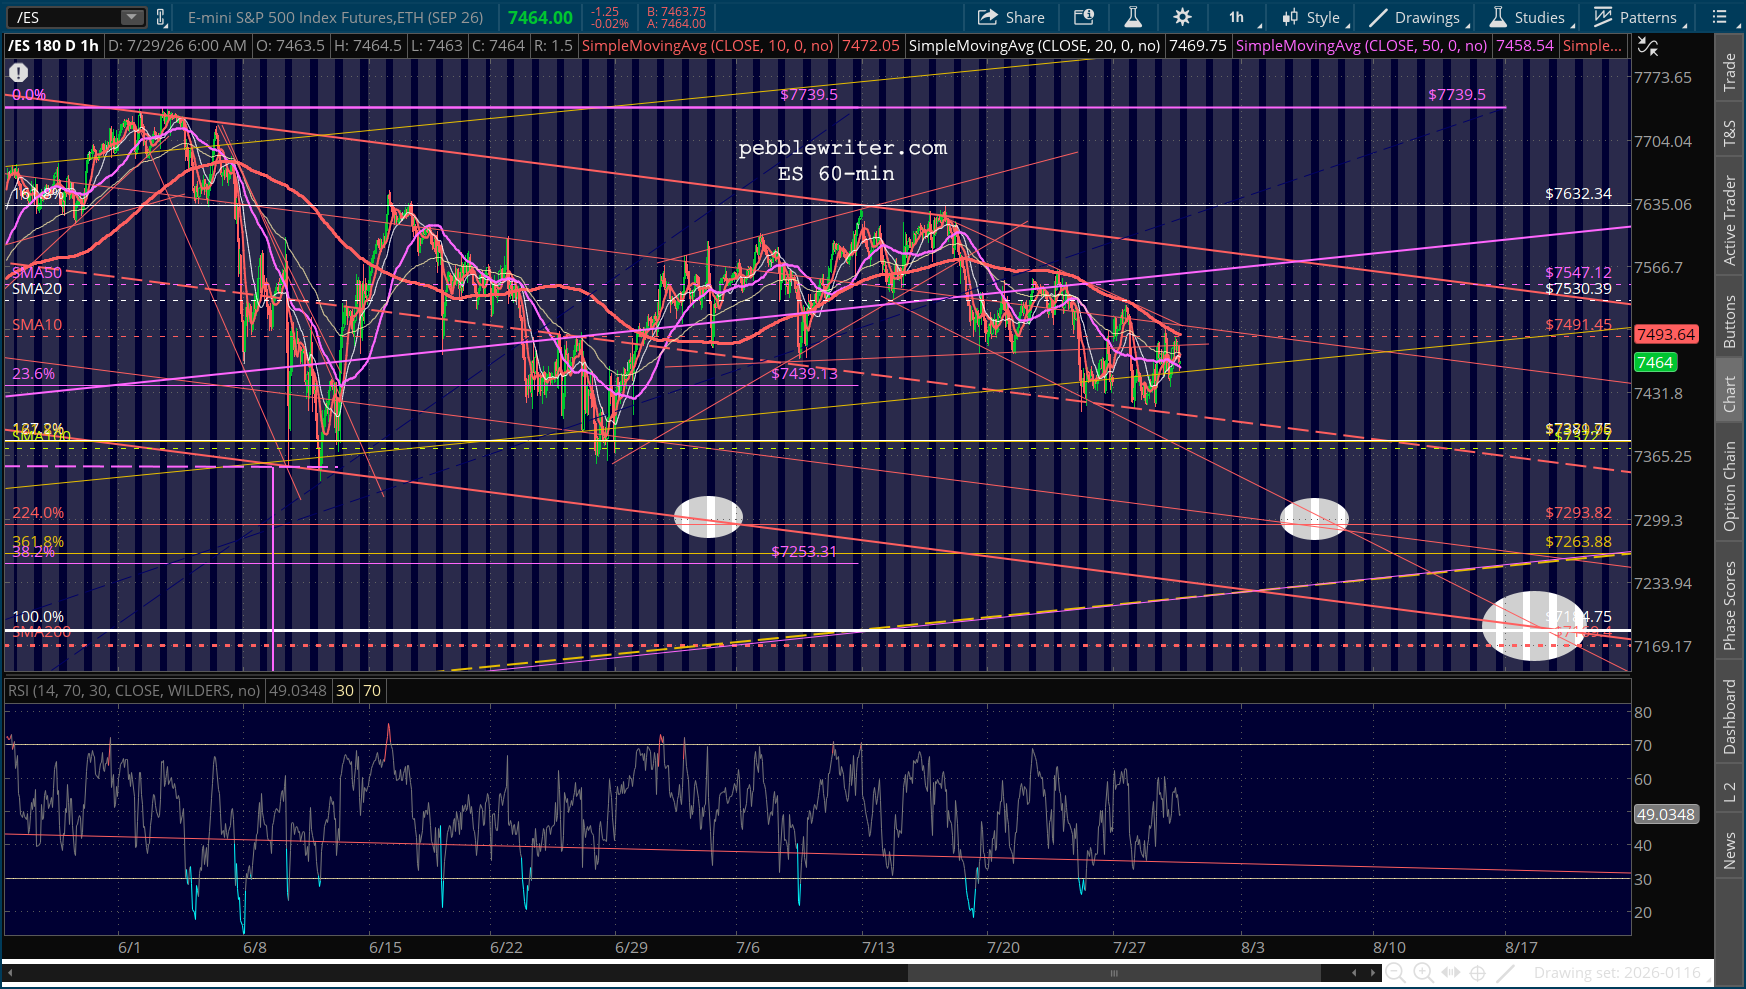
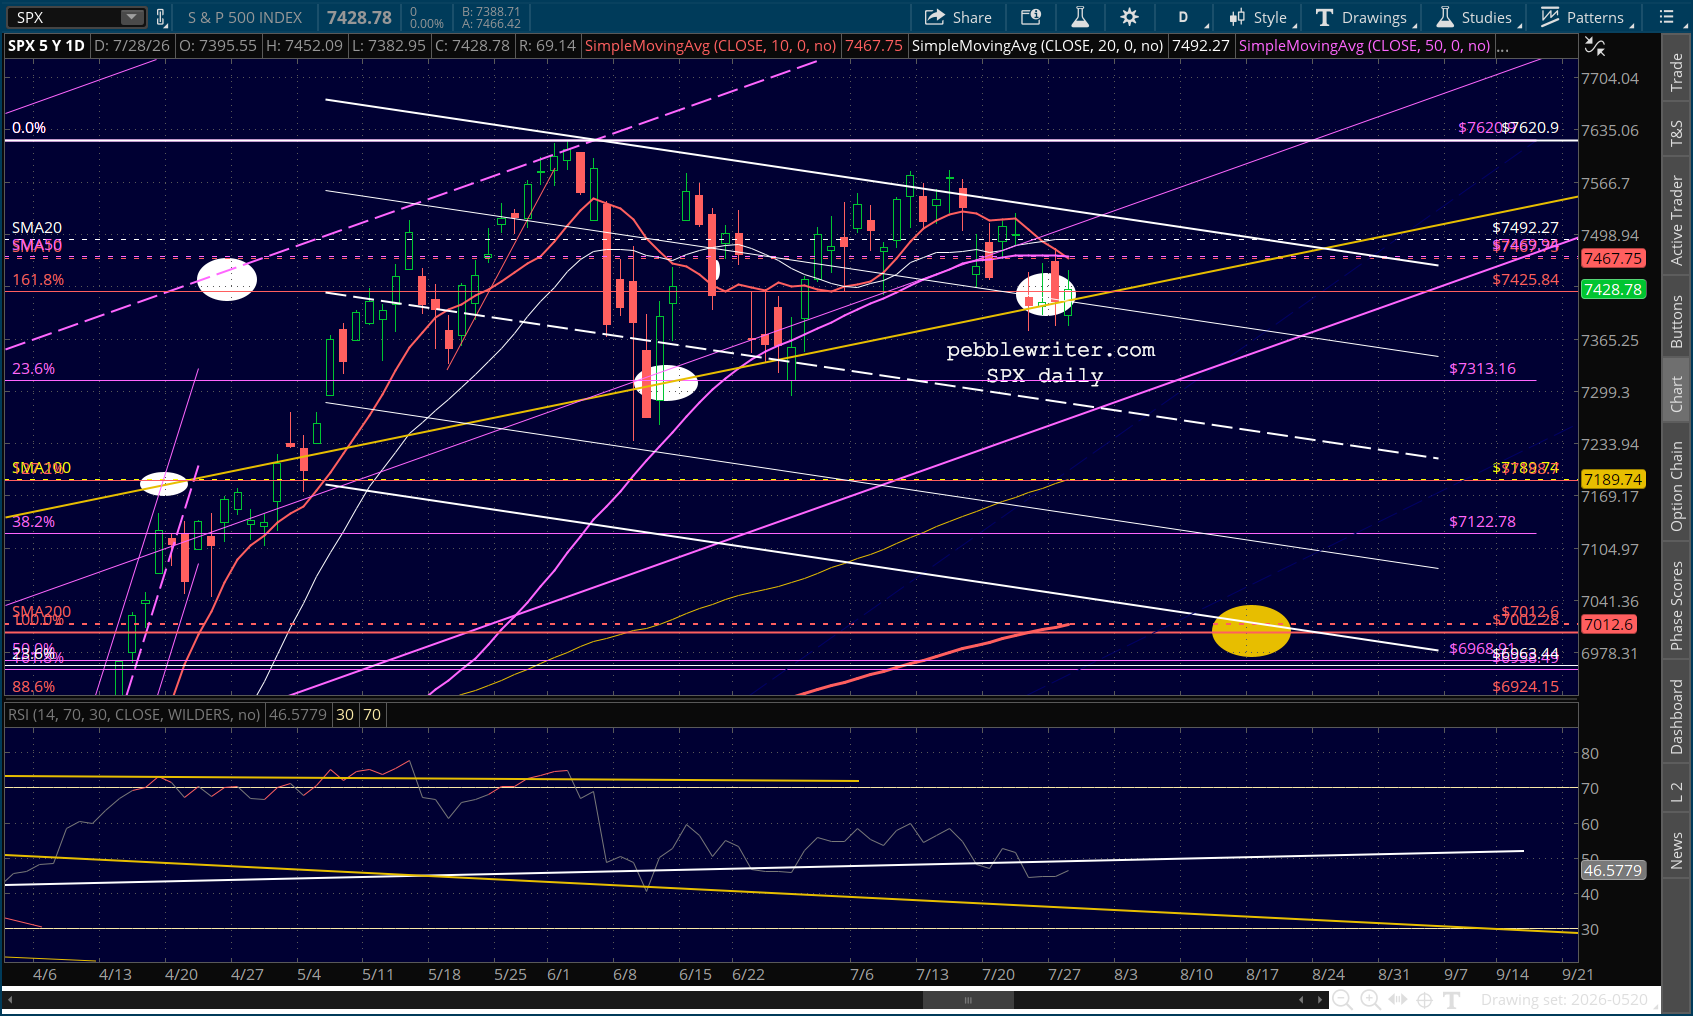
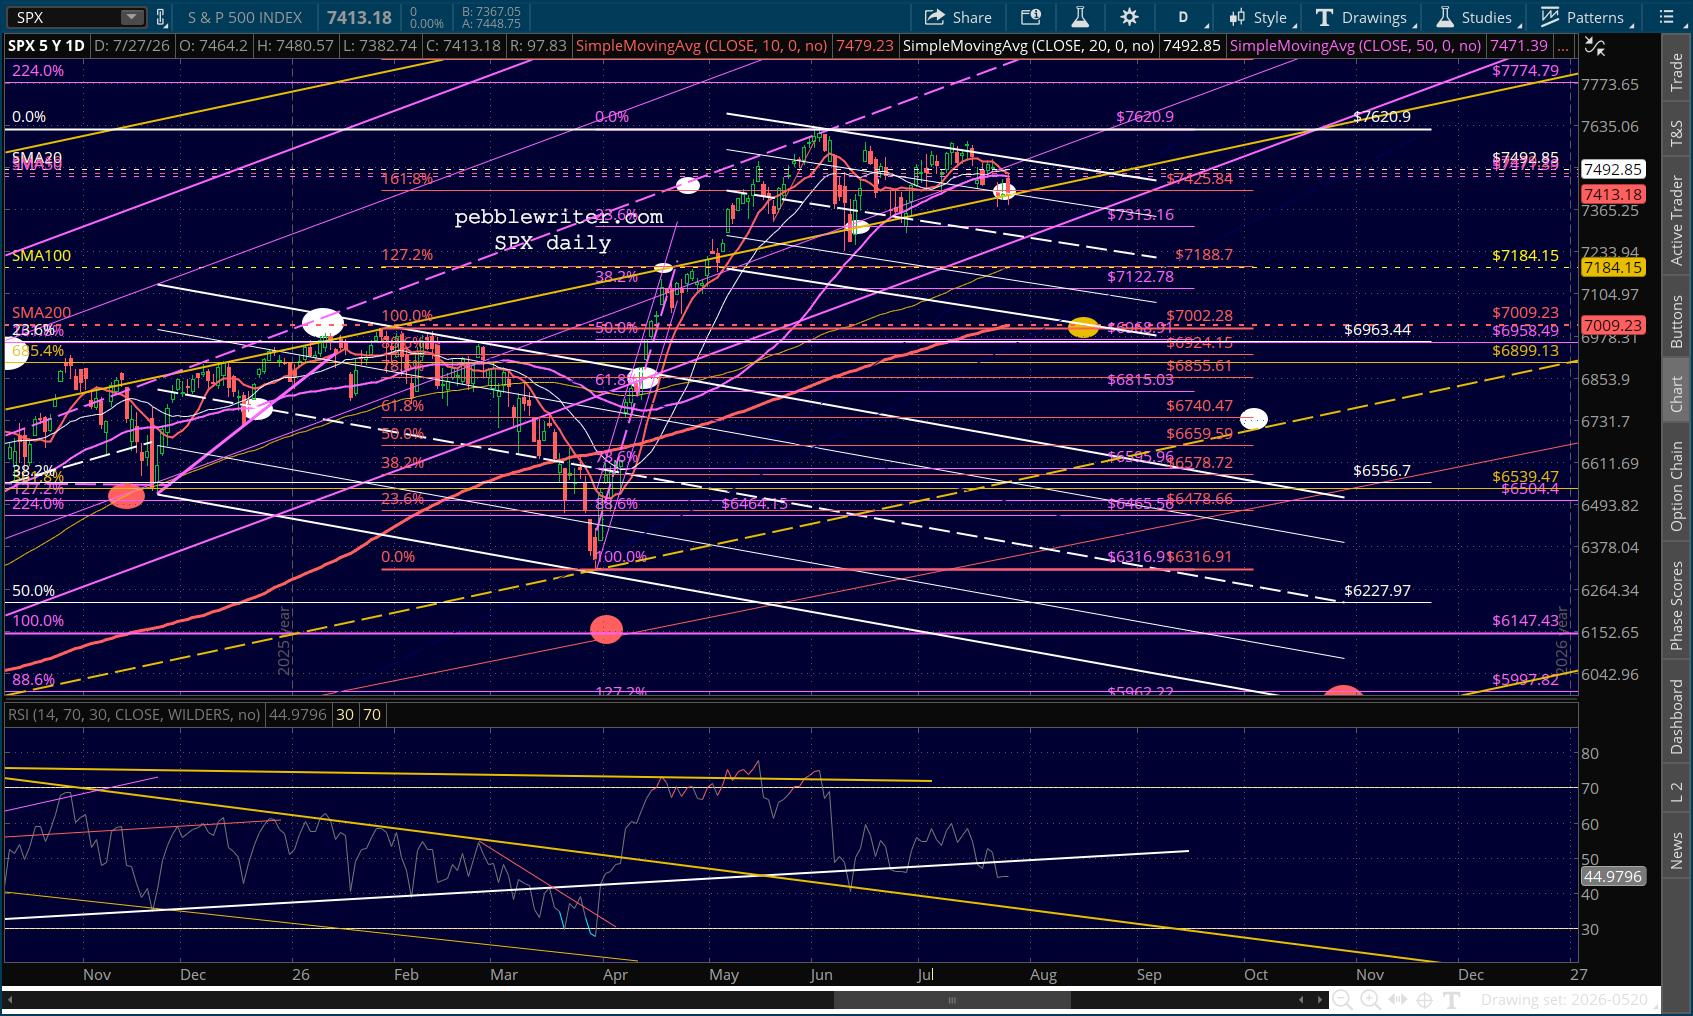
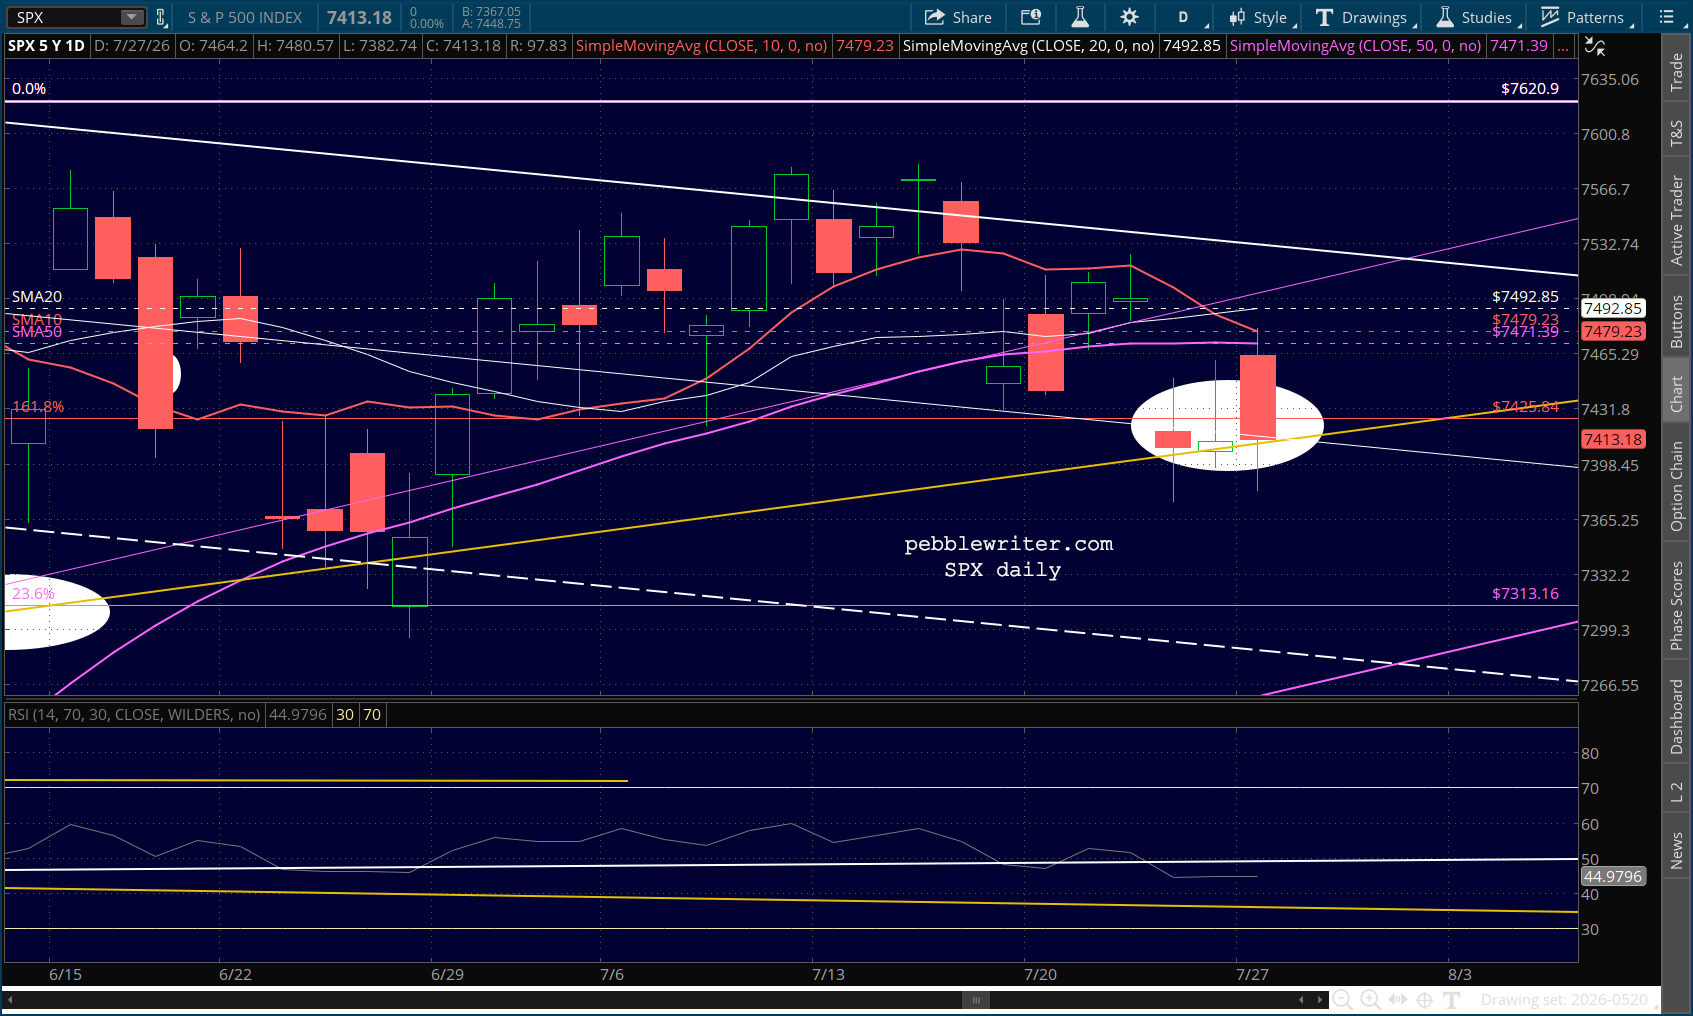
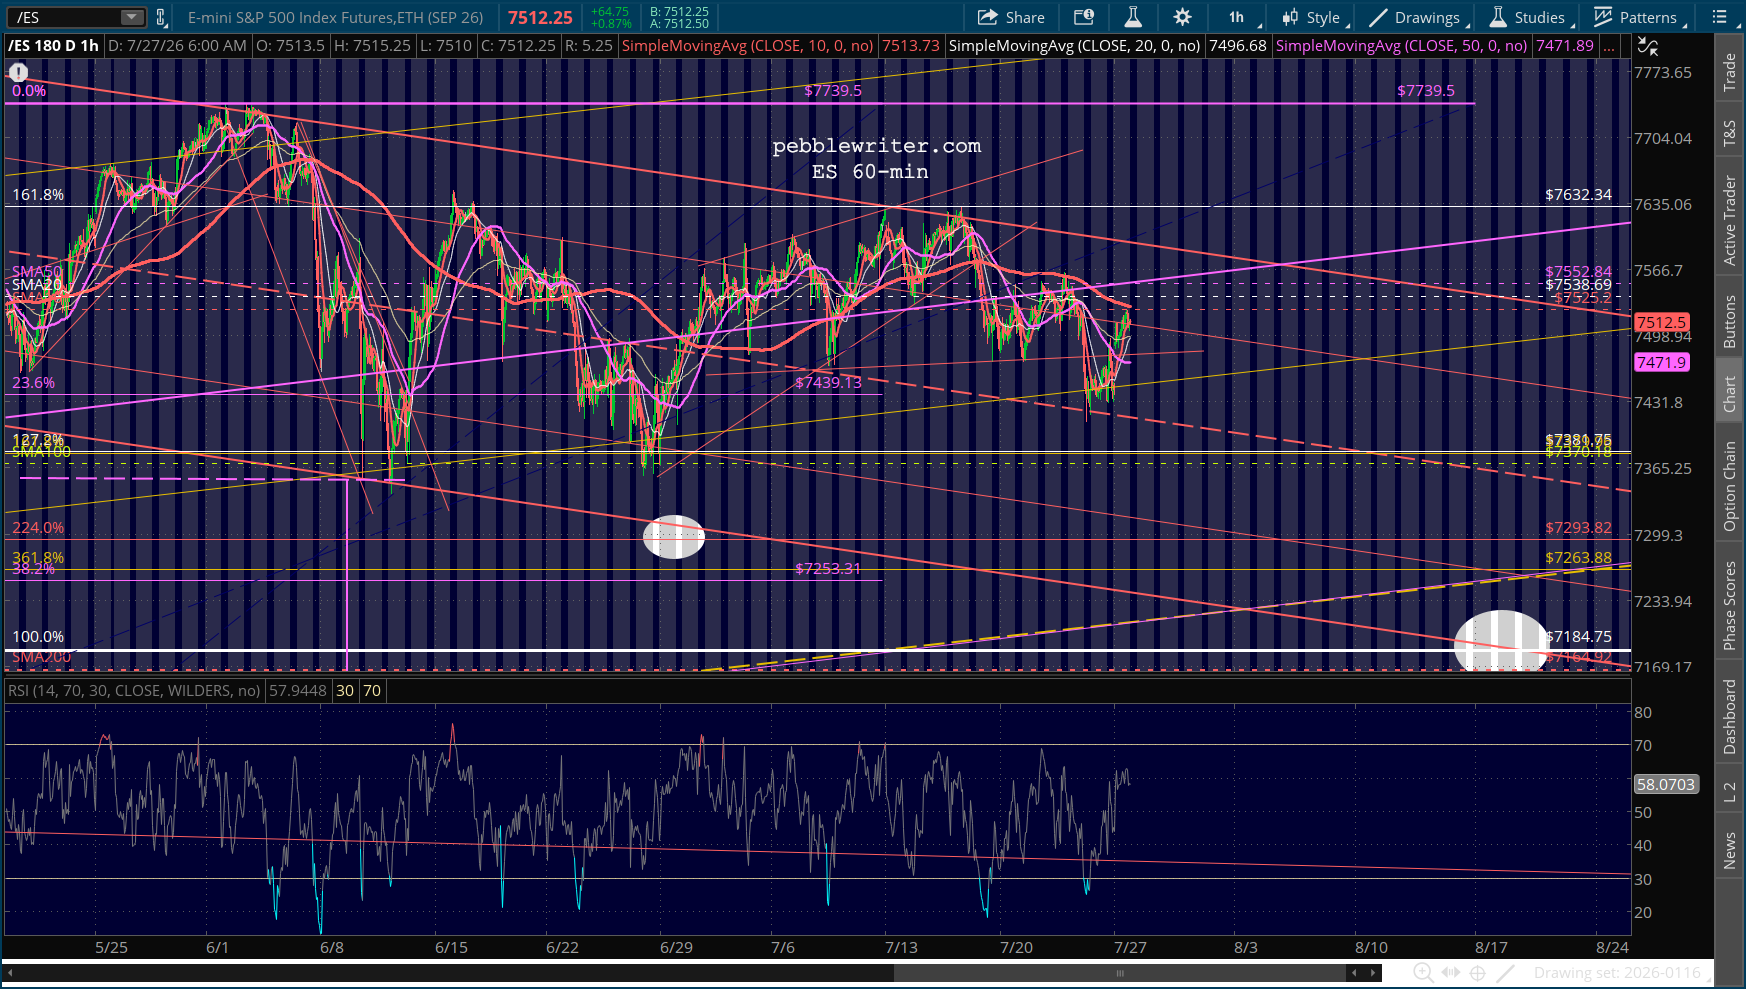
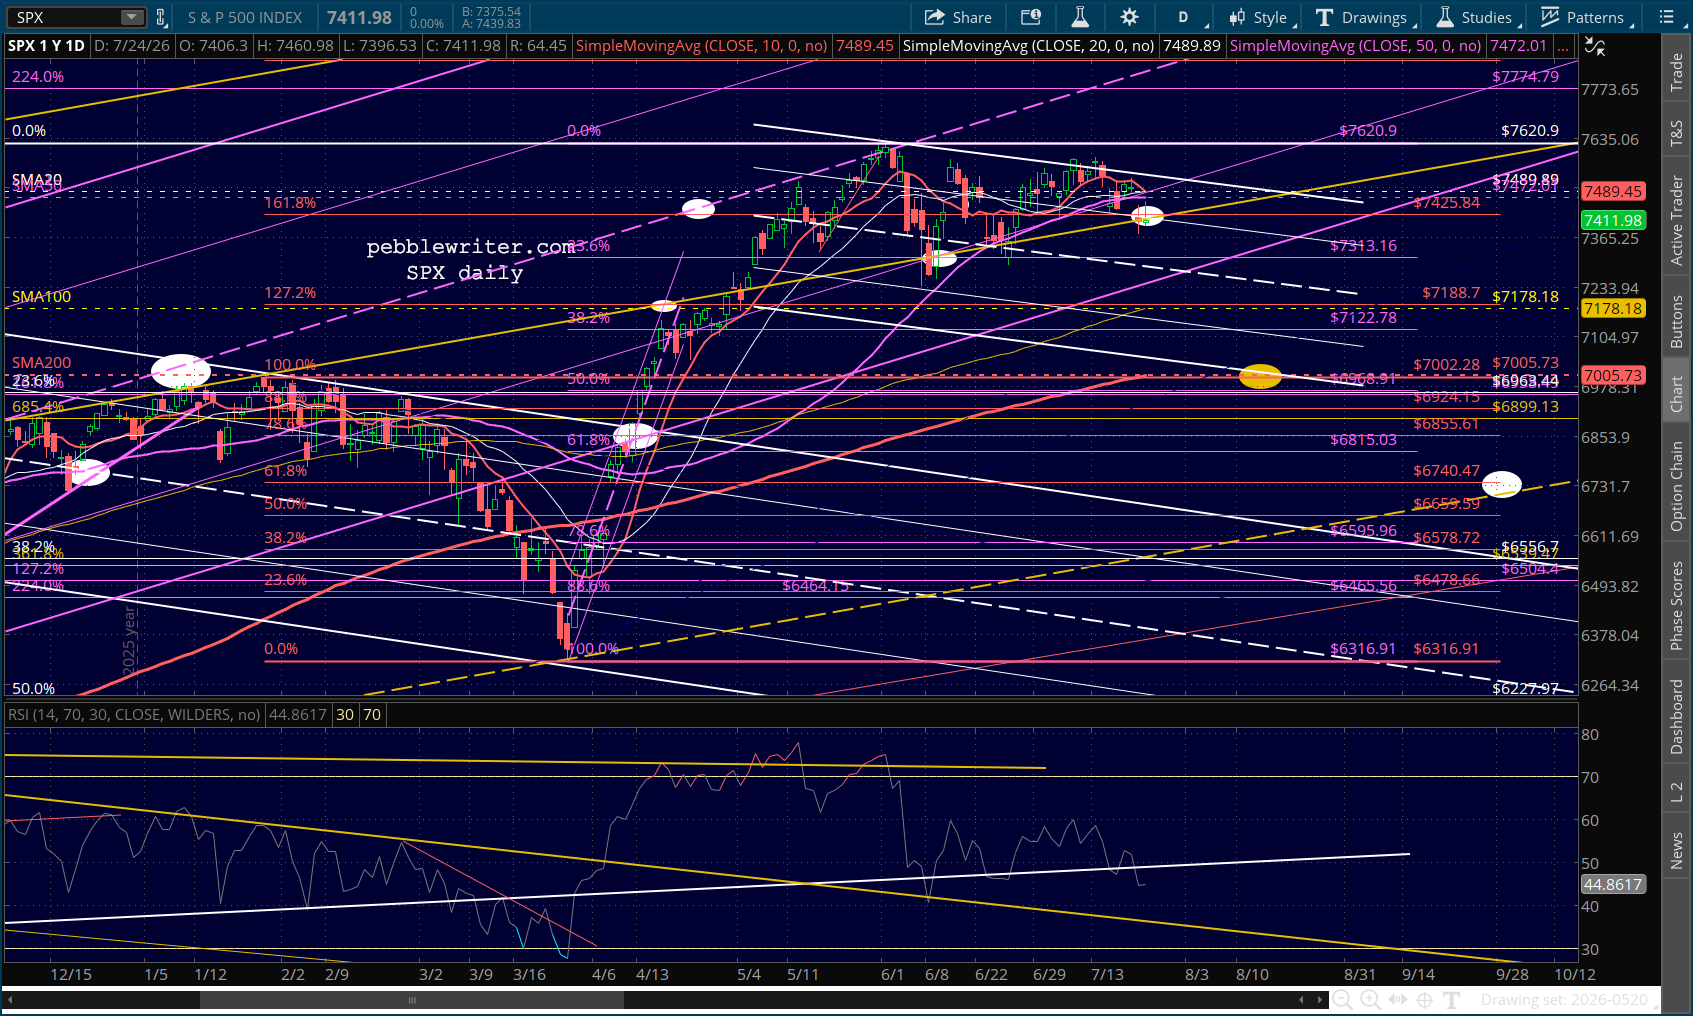
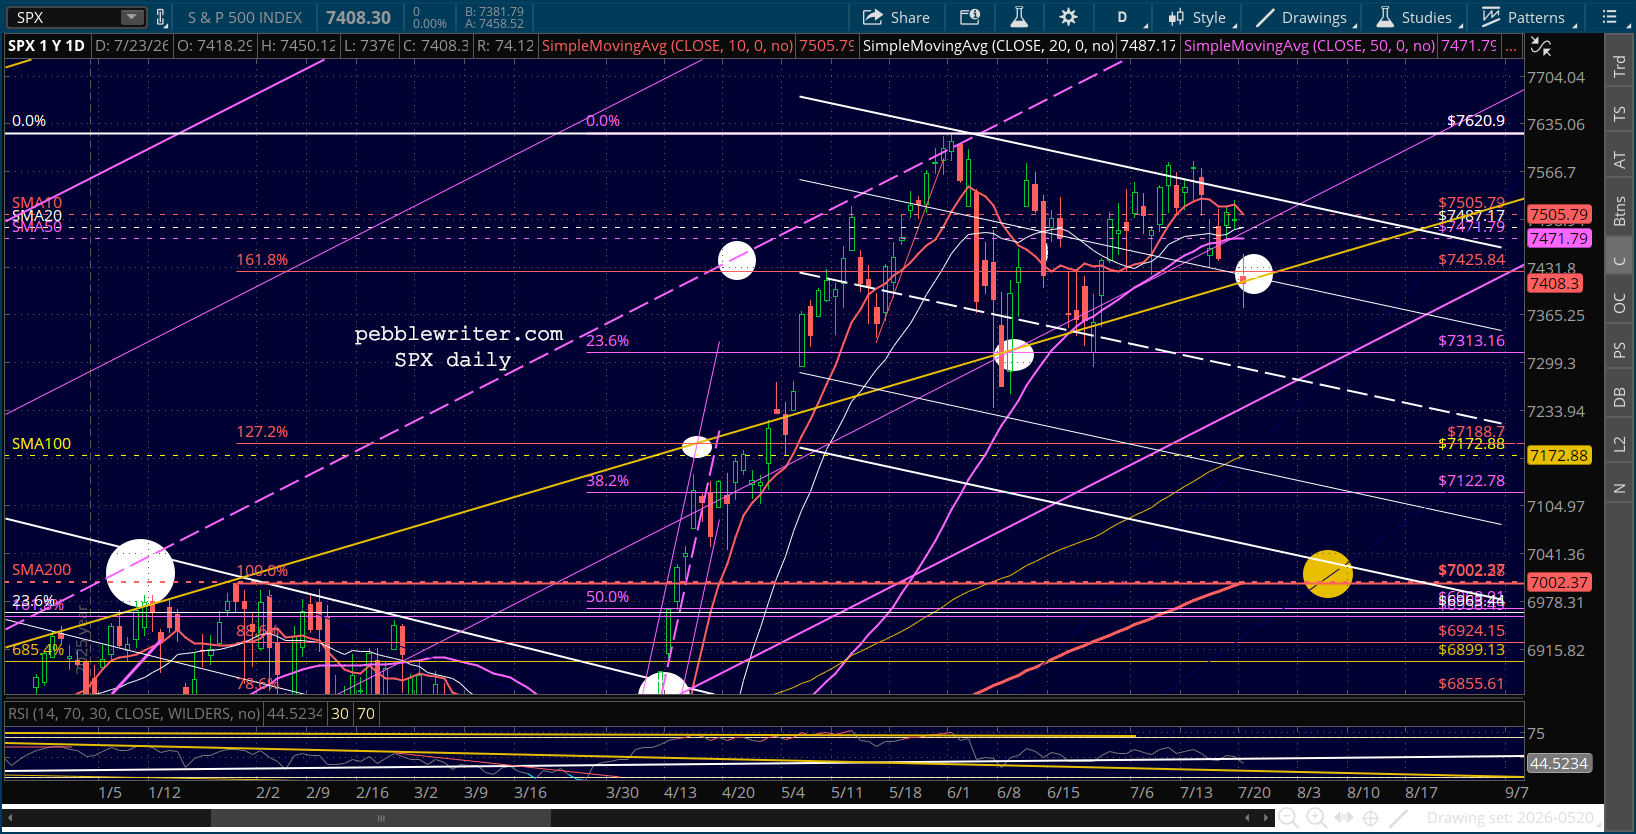
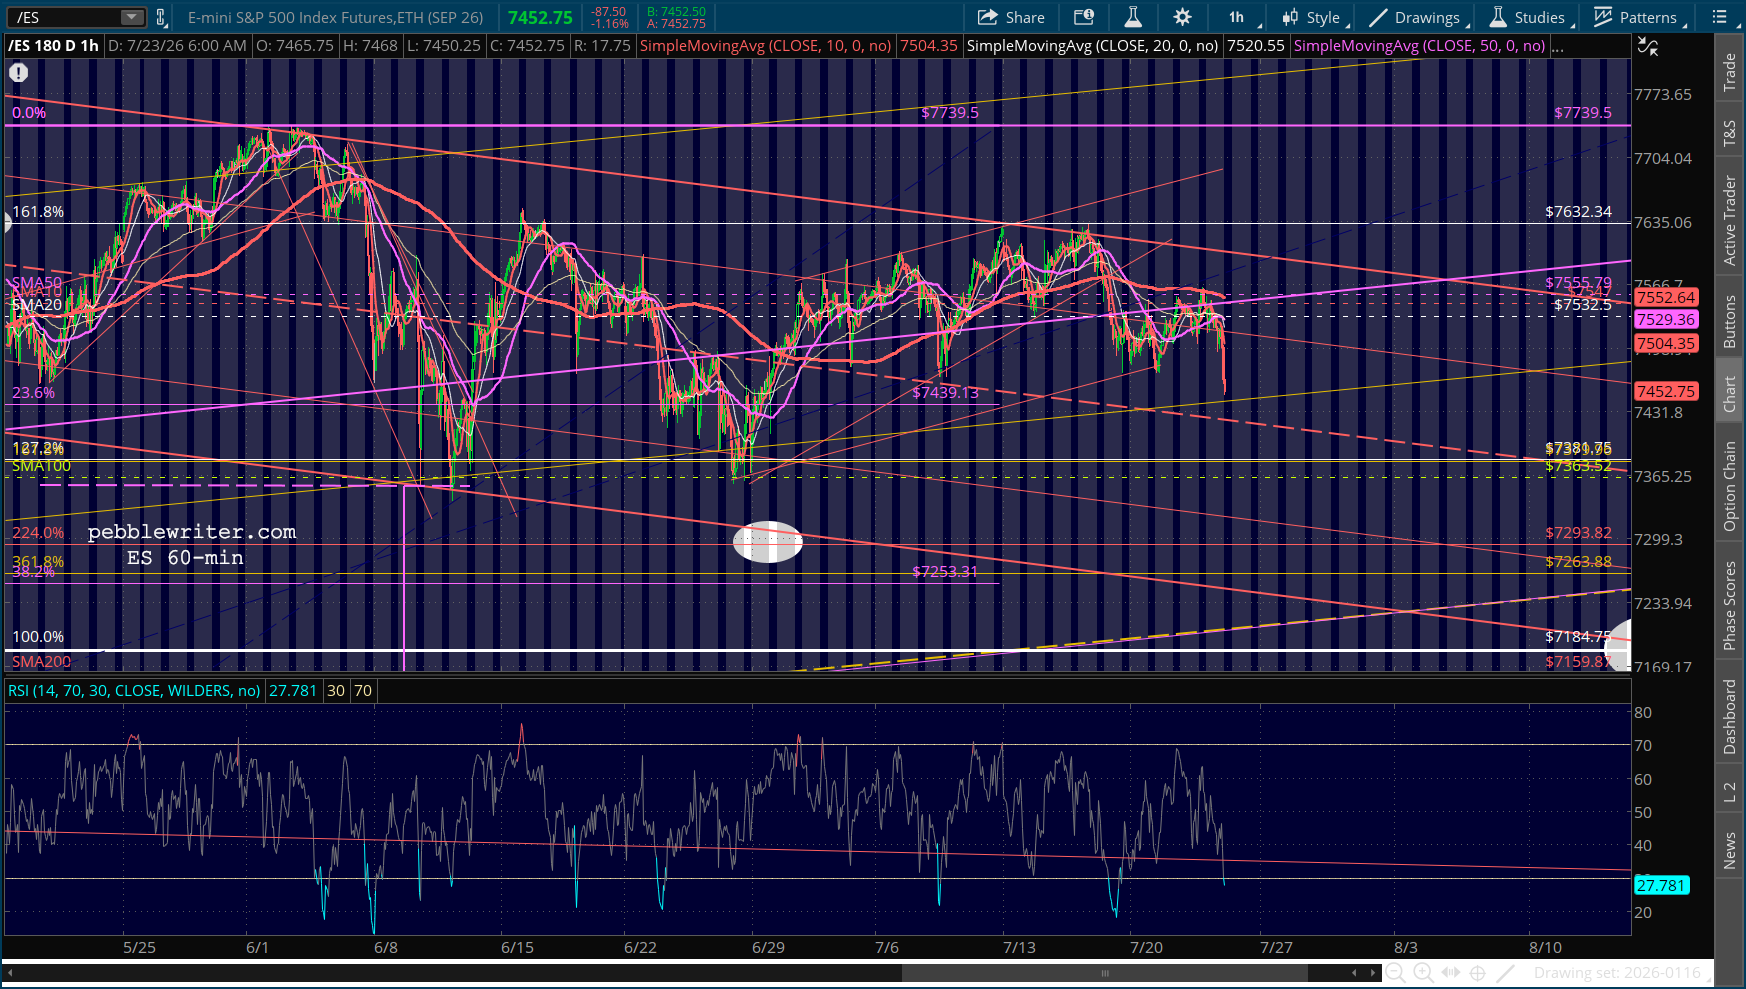
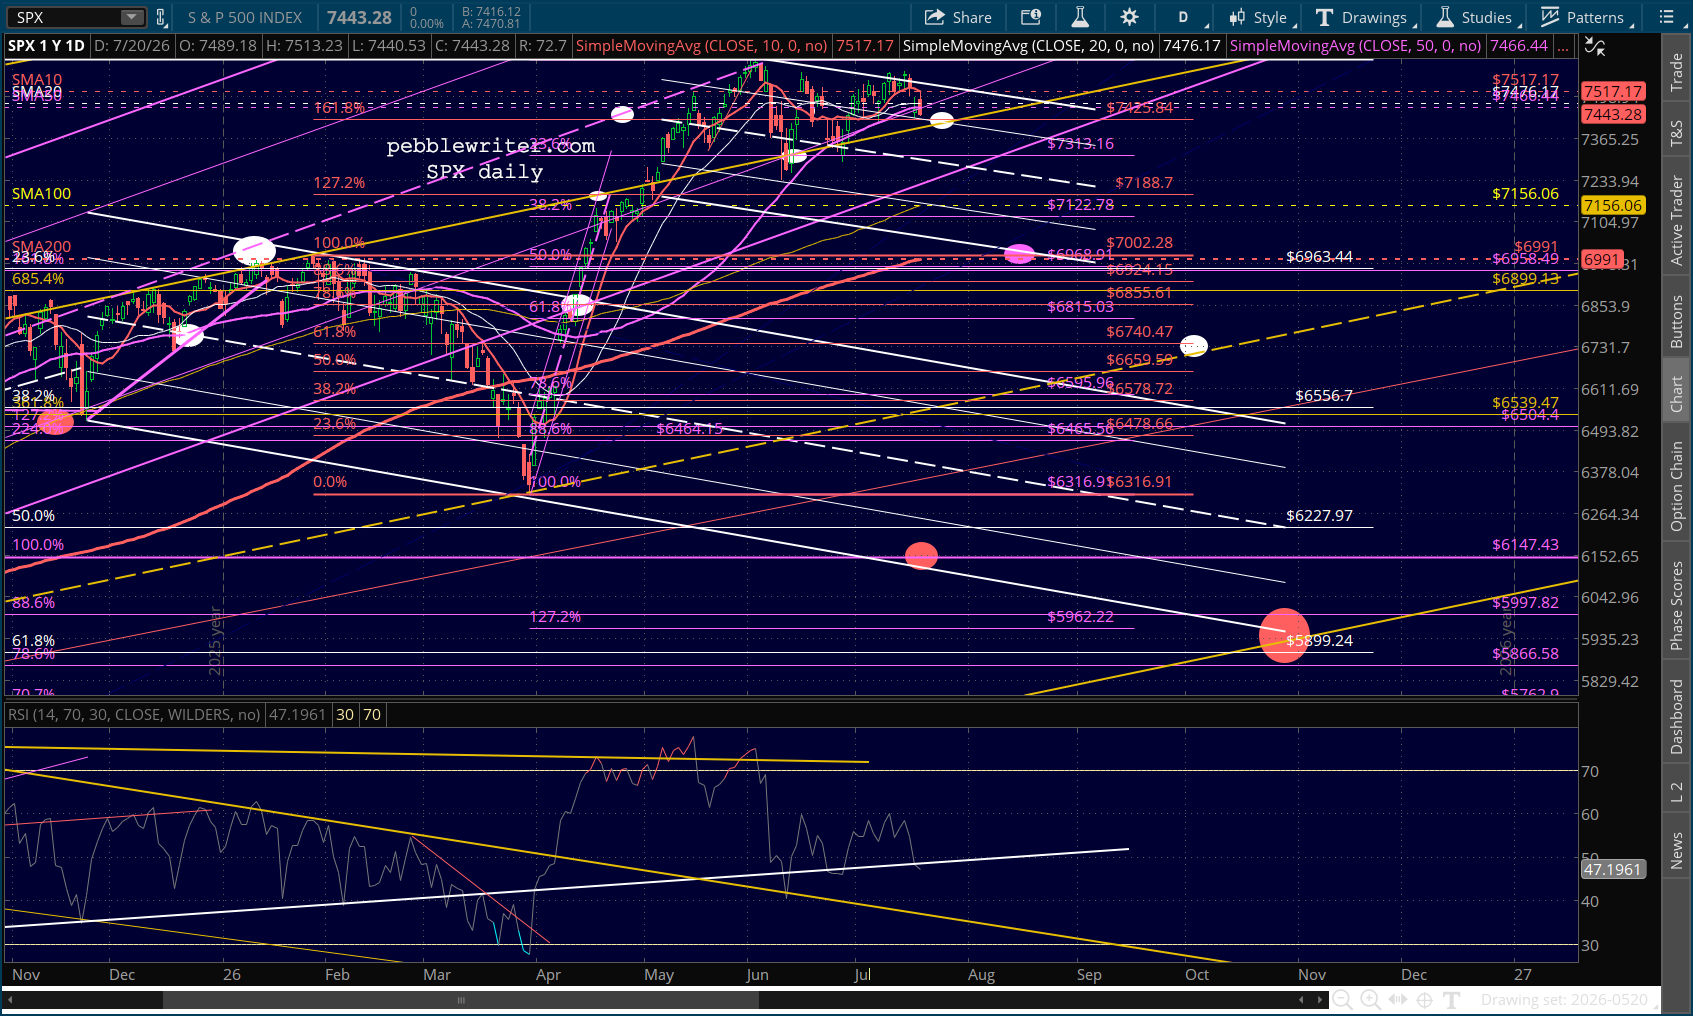
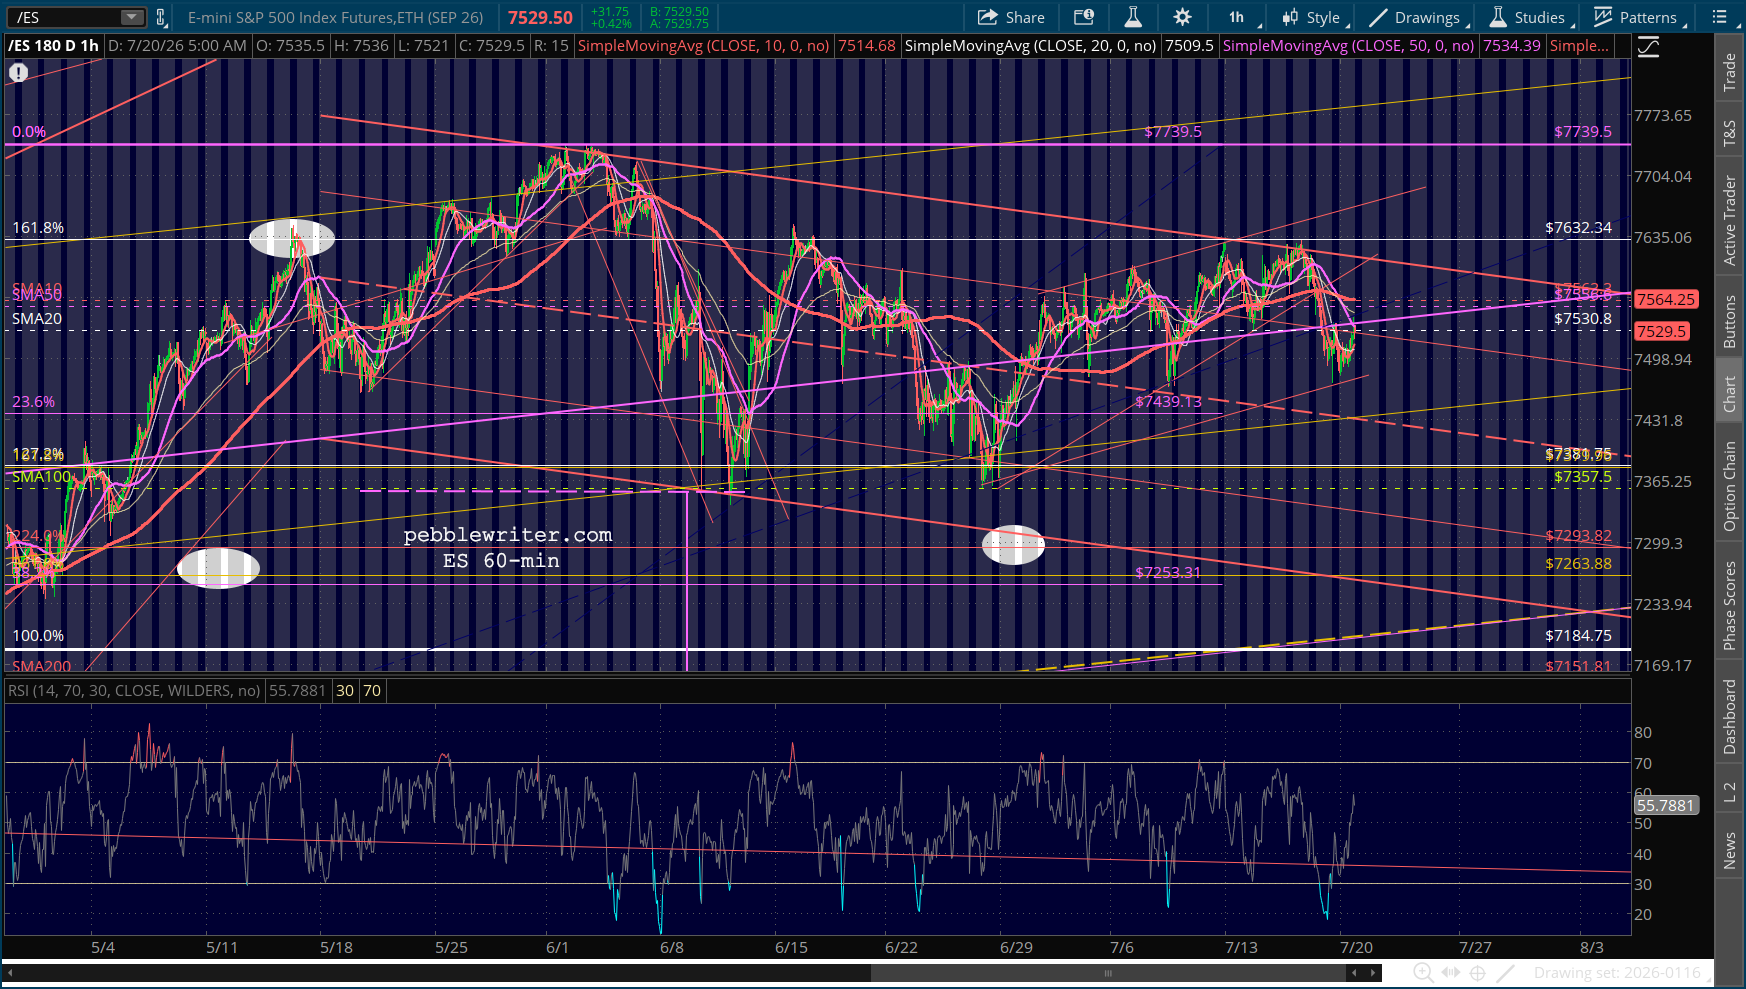
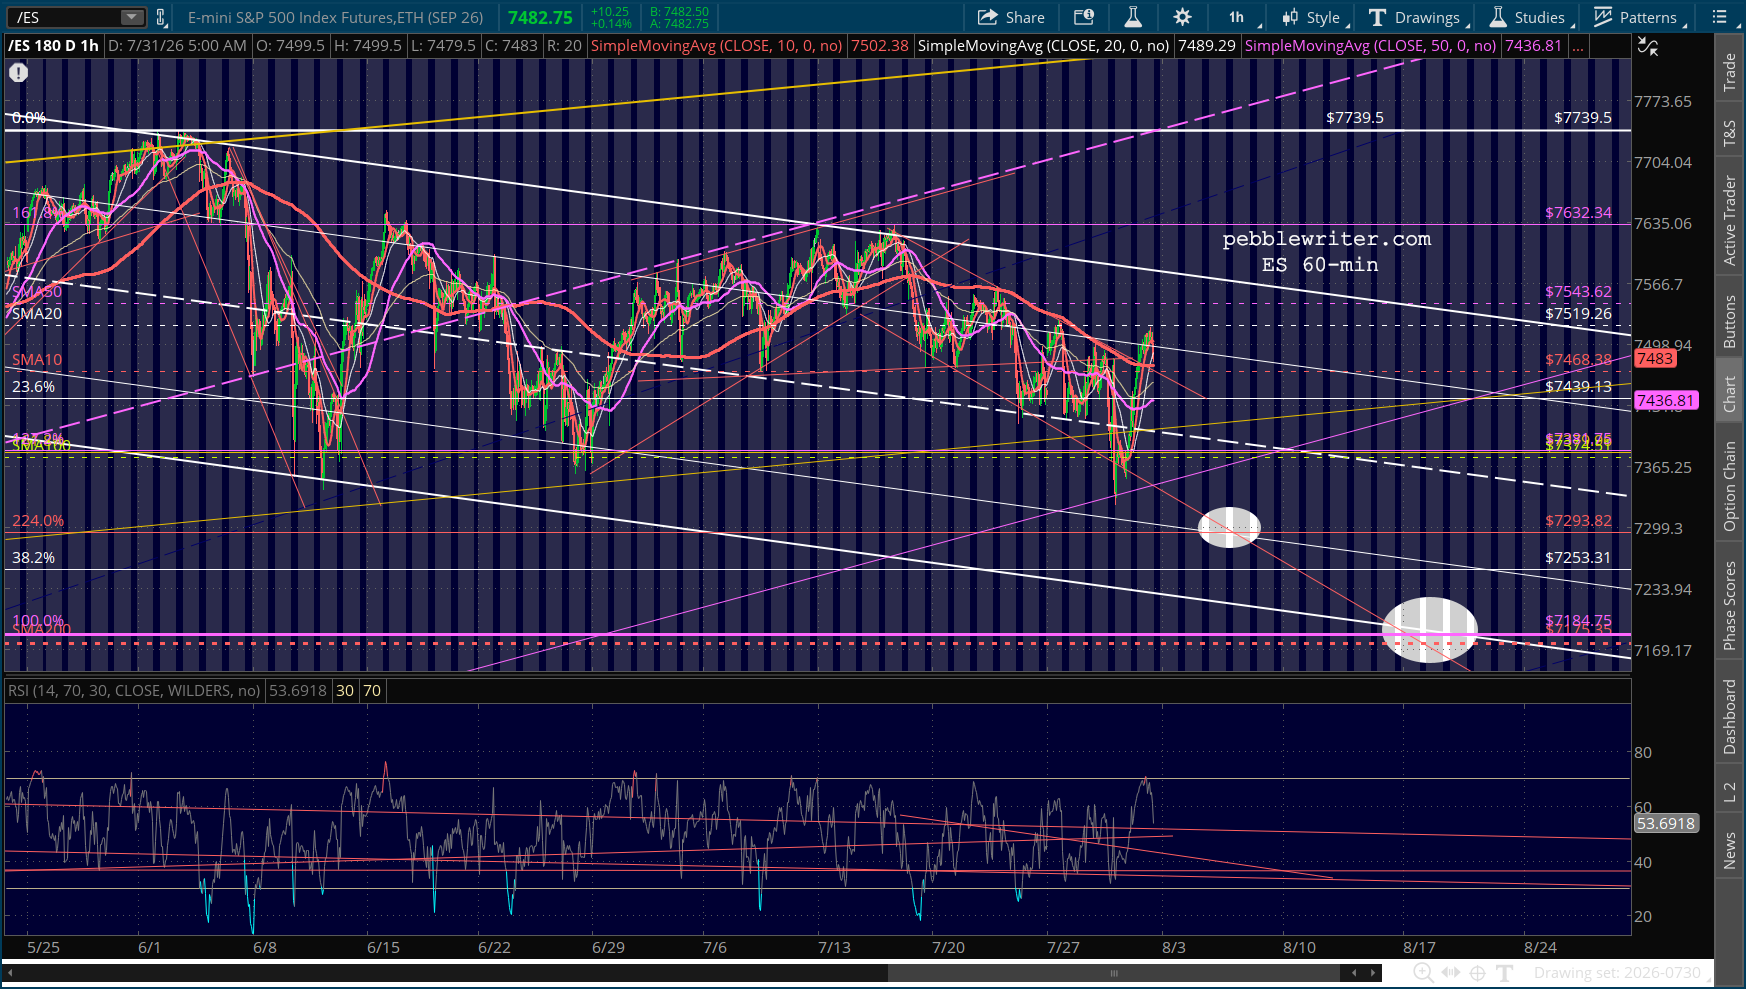
…and, the market is once again headed to new highs.
The reality is that all of these news flashes are just the lies the wolf wants you to believe. Lies like the weekly proclamations that the Middle East is no longer embroiled in war. We got another one last night. It took a great deal of restraint for Fox News to leave off the exclamation point.
Hamas agrees to complete disarmament under ‘historic’ Gaza agreement
If we dig a little deeper in practically any other news source website, we see that the so-called deal – involving the Board of Peace, no less – is only a draft of a deal, would take up to a year to be consummated, and would involve Hamas placing their most potent weapons in a depository managed by a new Palestinian authority. Not even Israel is rooting for this deal to happen.
It’s another nothingburger dreamed up by the White House to calm the markets and reduce the amount of money the Treasury has to spend to keep a lid on oil futures. They trot these stories out weekly (e.g. the Iran War has ended 15-20 times so far) or whenever the stock market wakes up with a hangover and realizes it drank way too much last night.
By now, it has dawned on everybody that Trump didn’t select Kevin Warsh as FOMC chair in a rare commitment to integrity and fidelity. Just like we all thought, there was an agreement (wink, wink) that interest rates needed to decline — or at least not rise — regardless of the inflation picture, and definitely in time for the midterms.
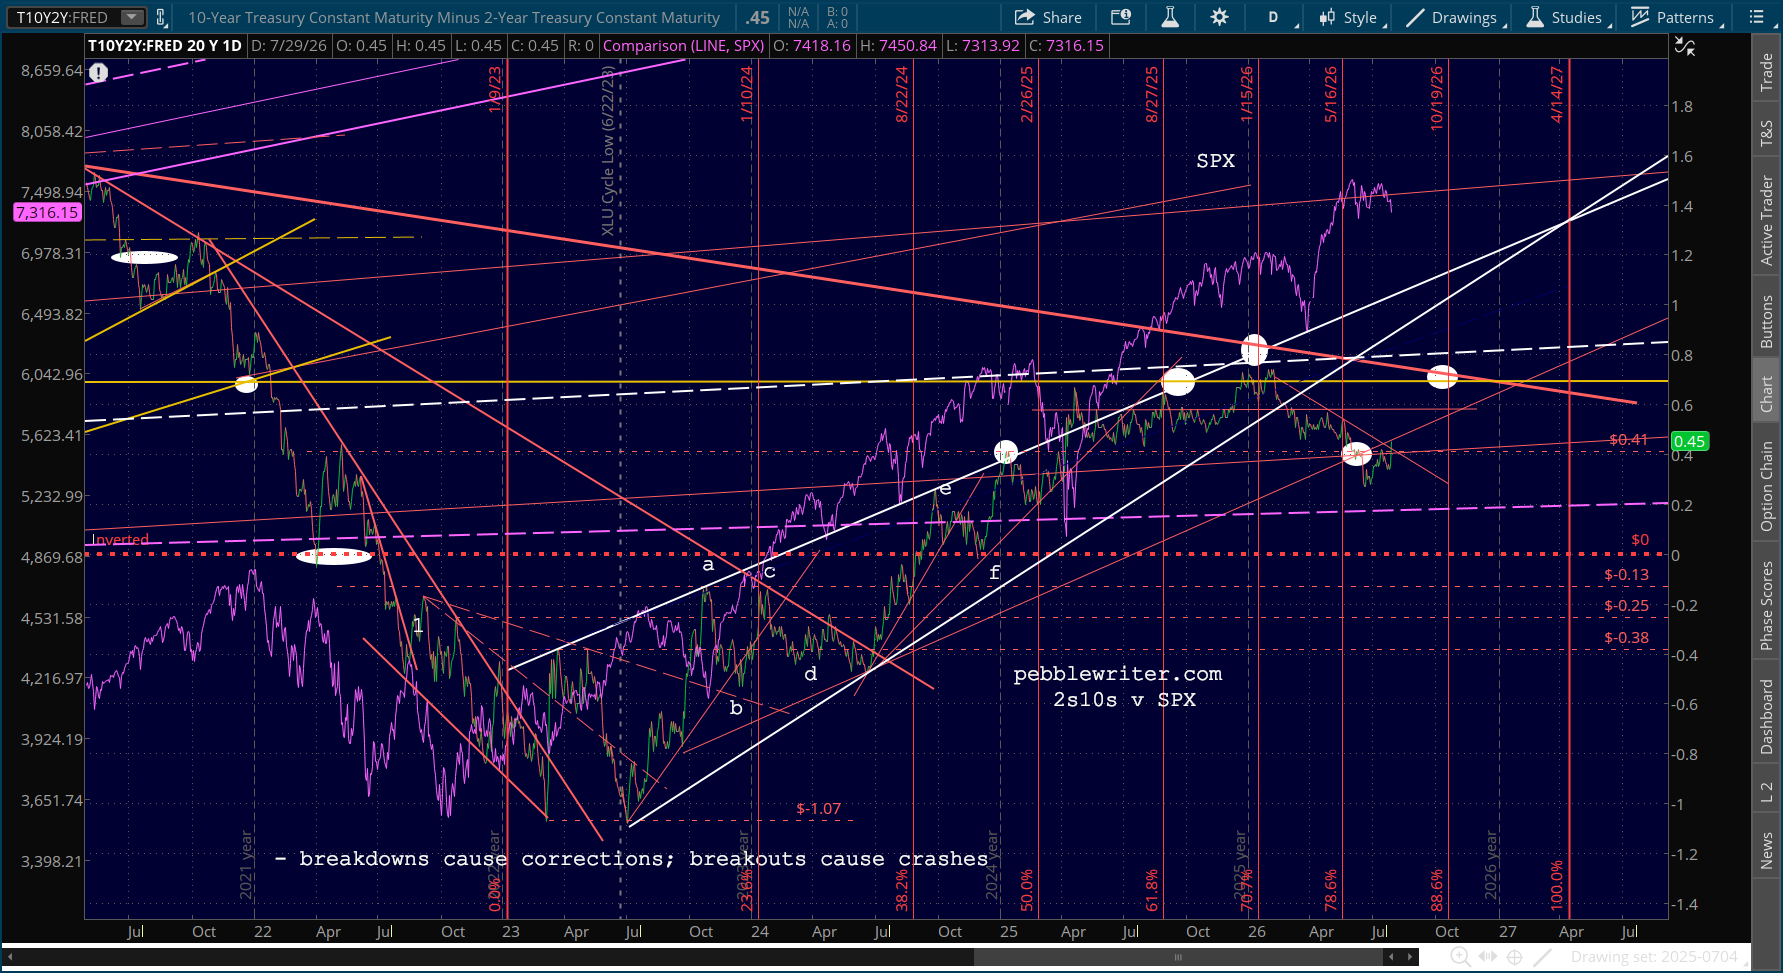
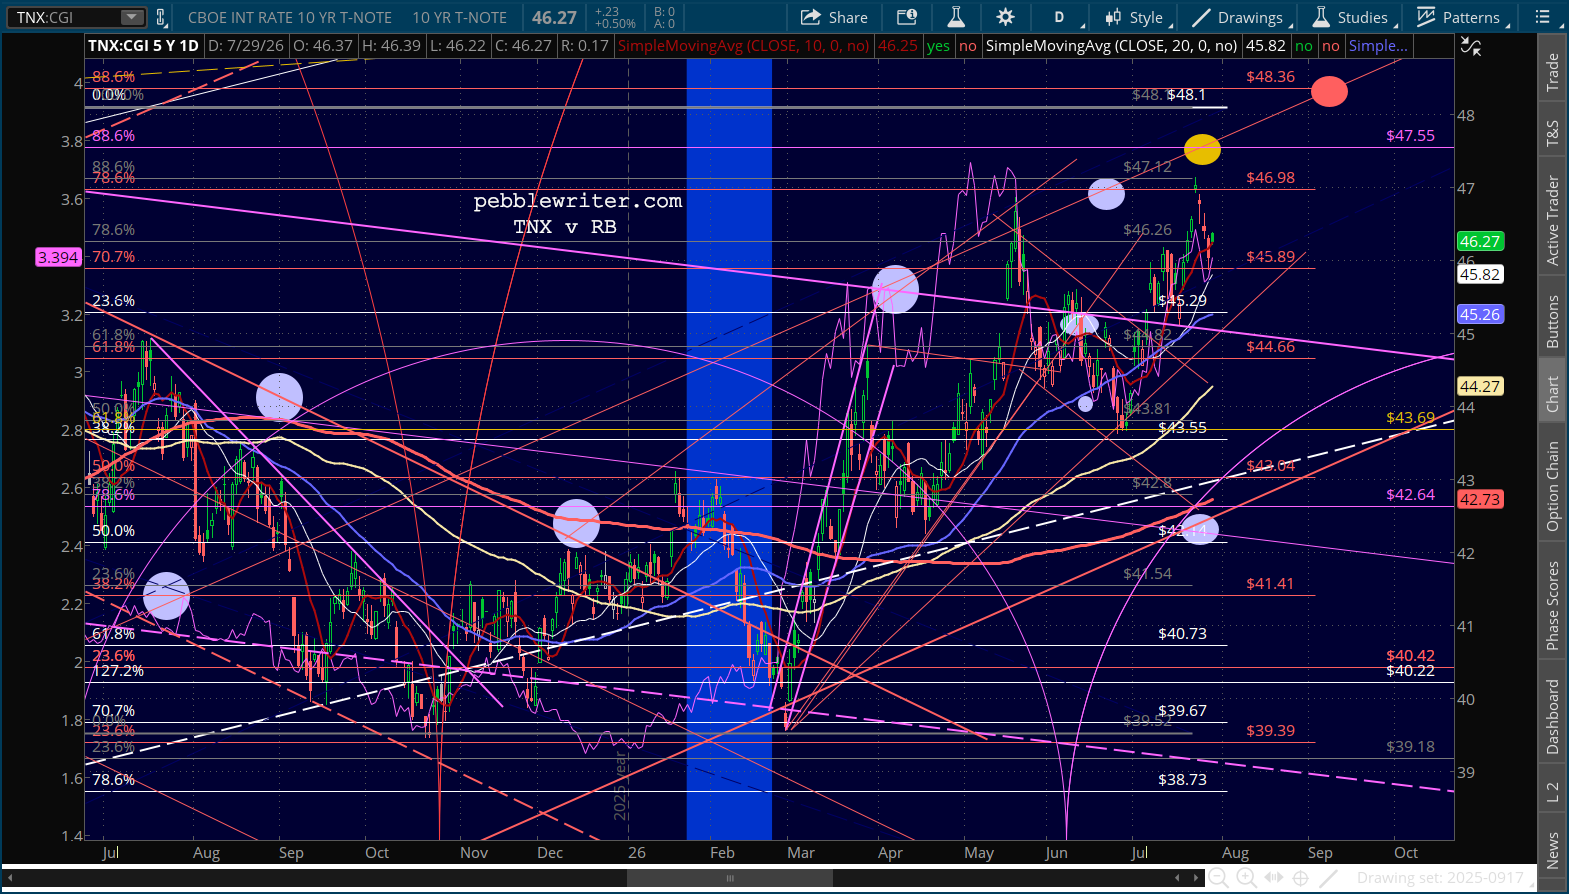
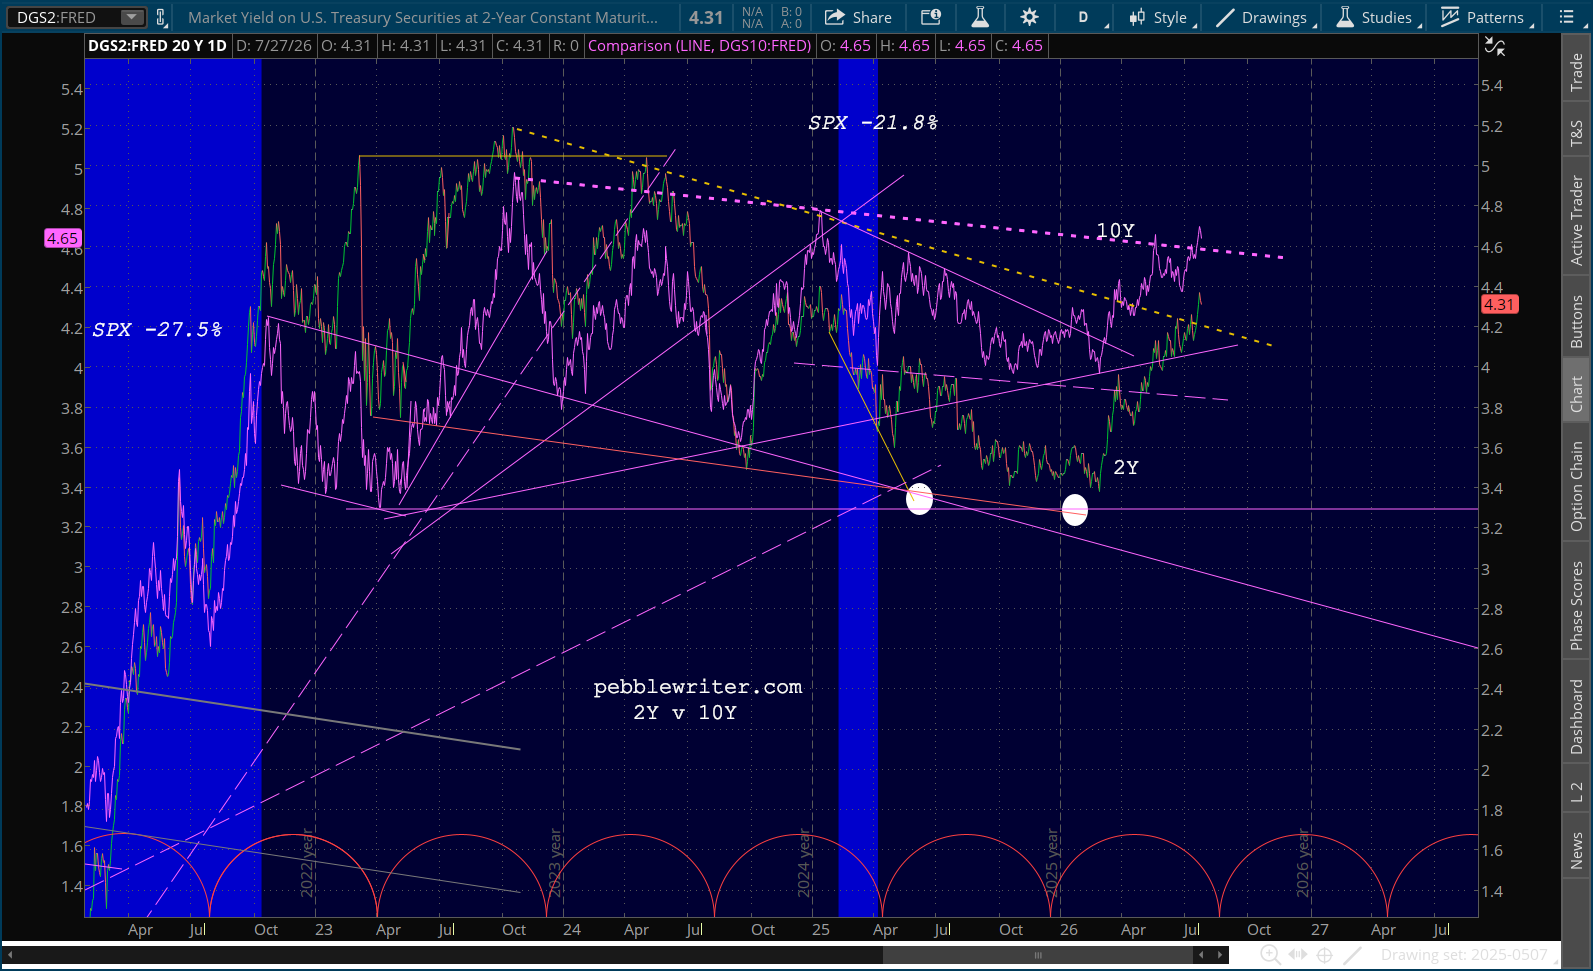
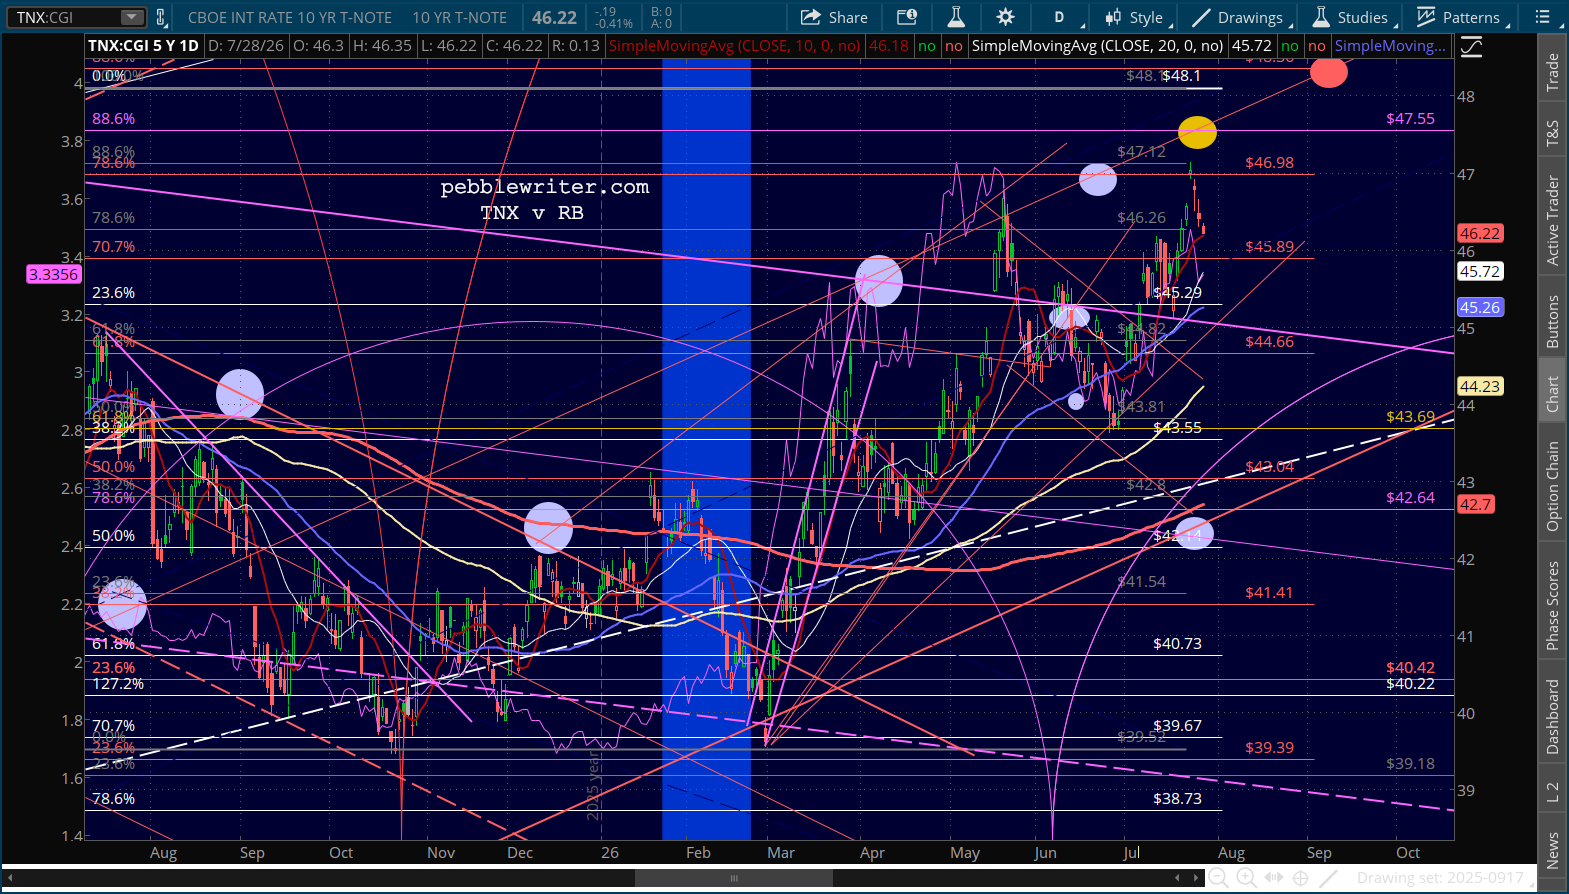
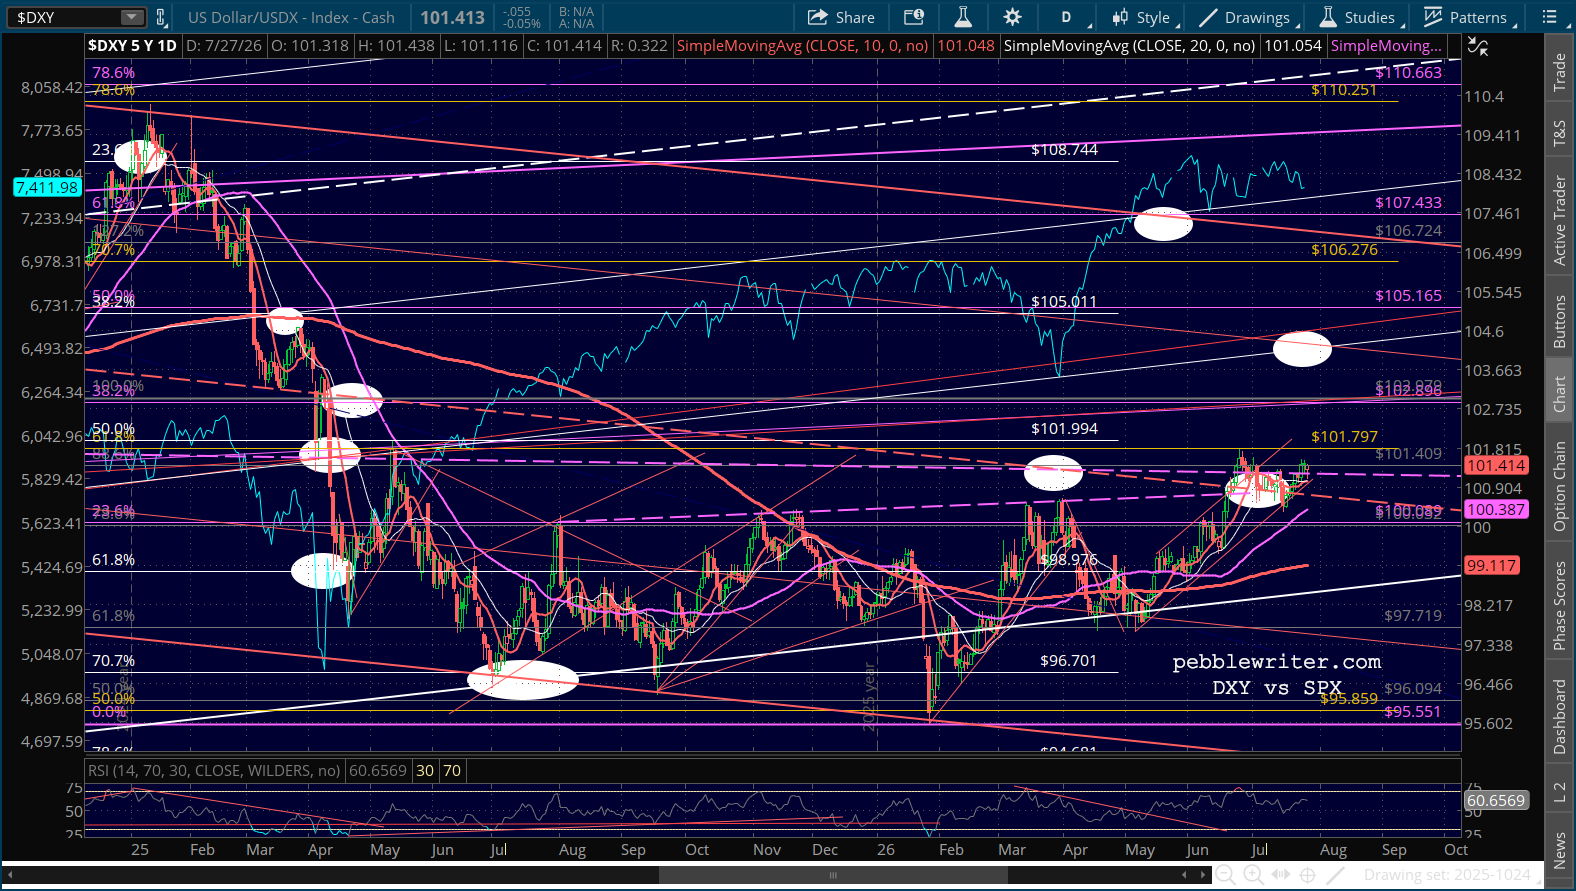
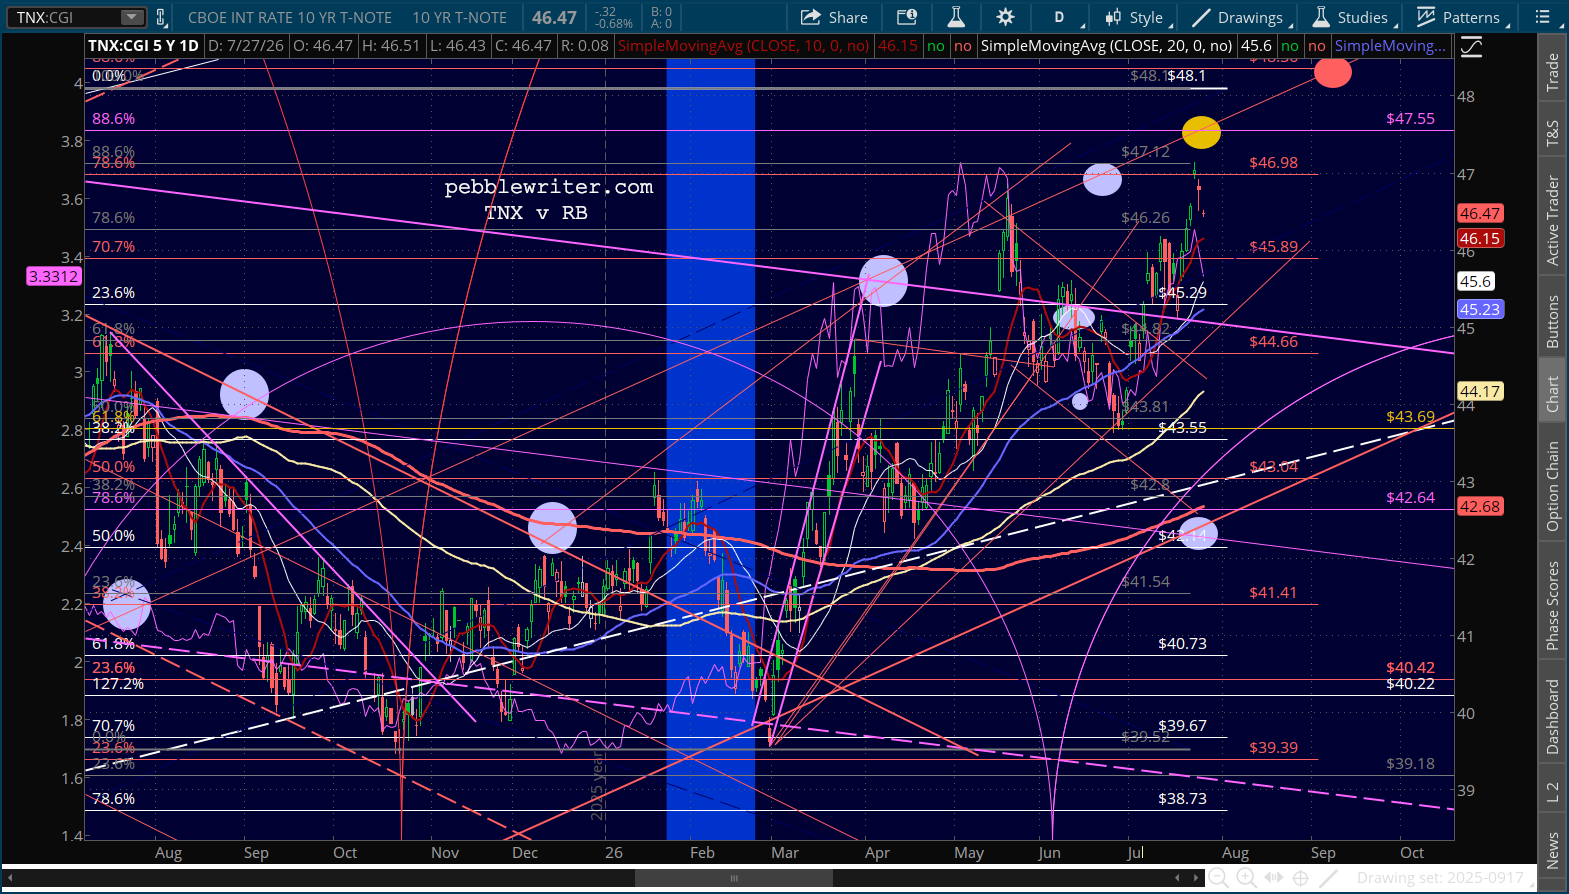
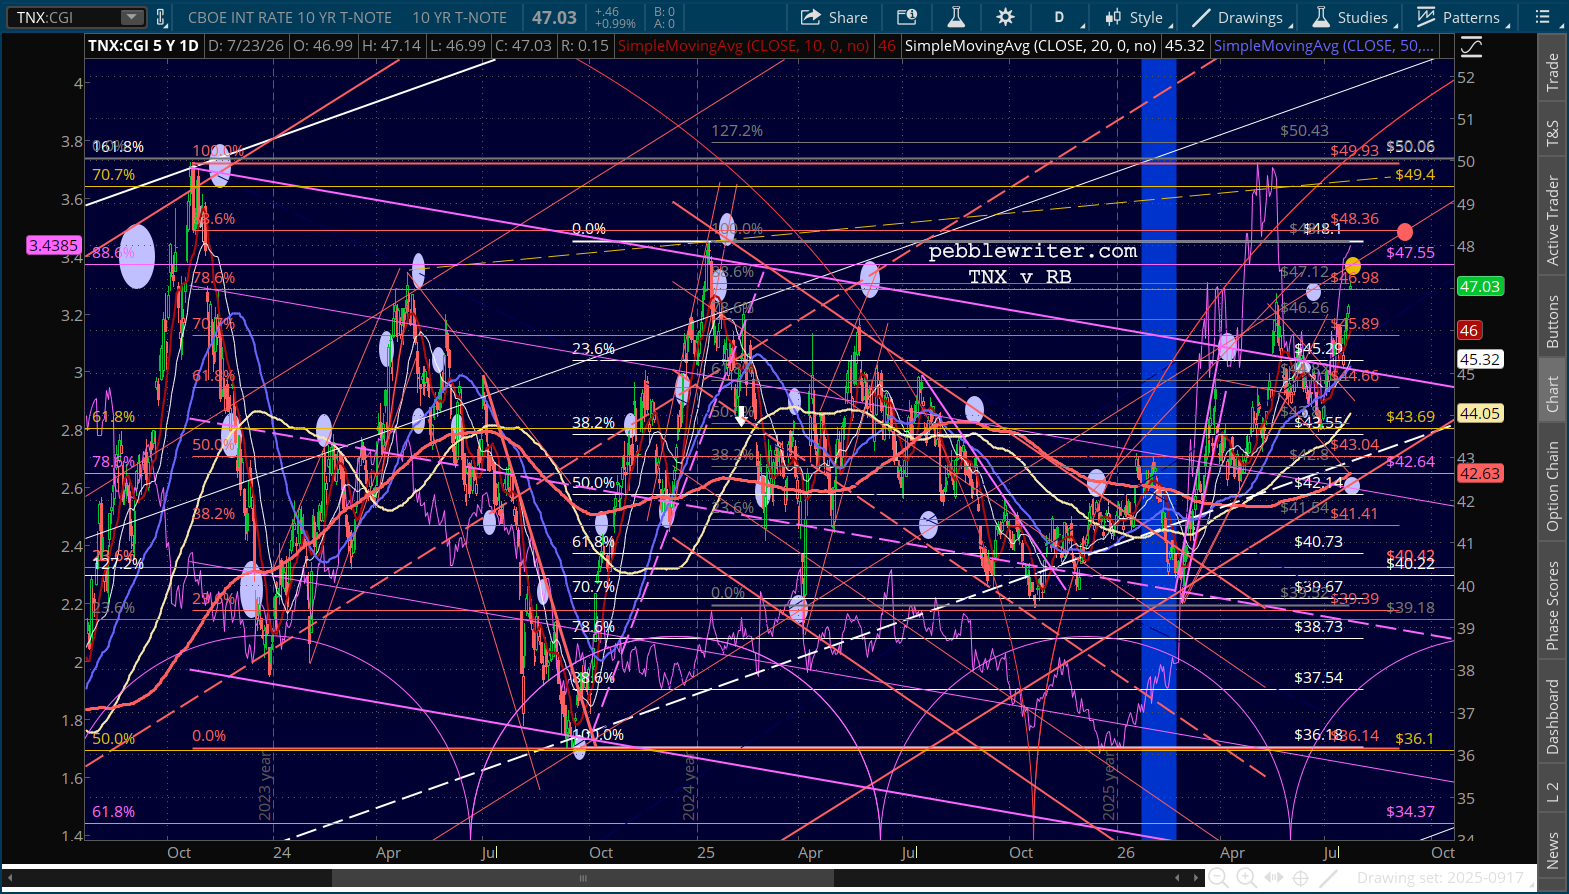
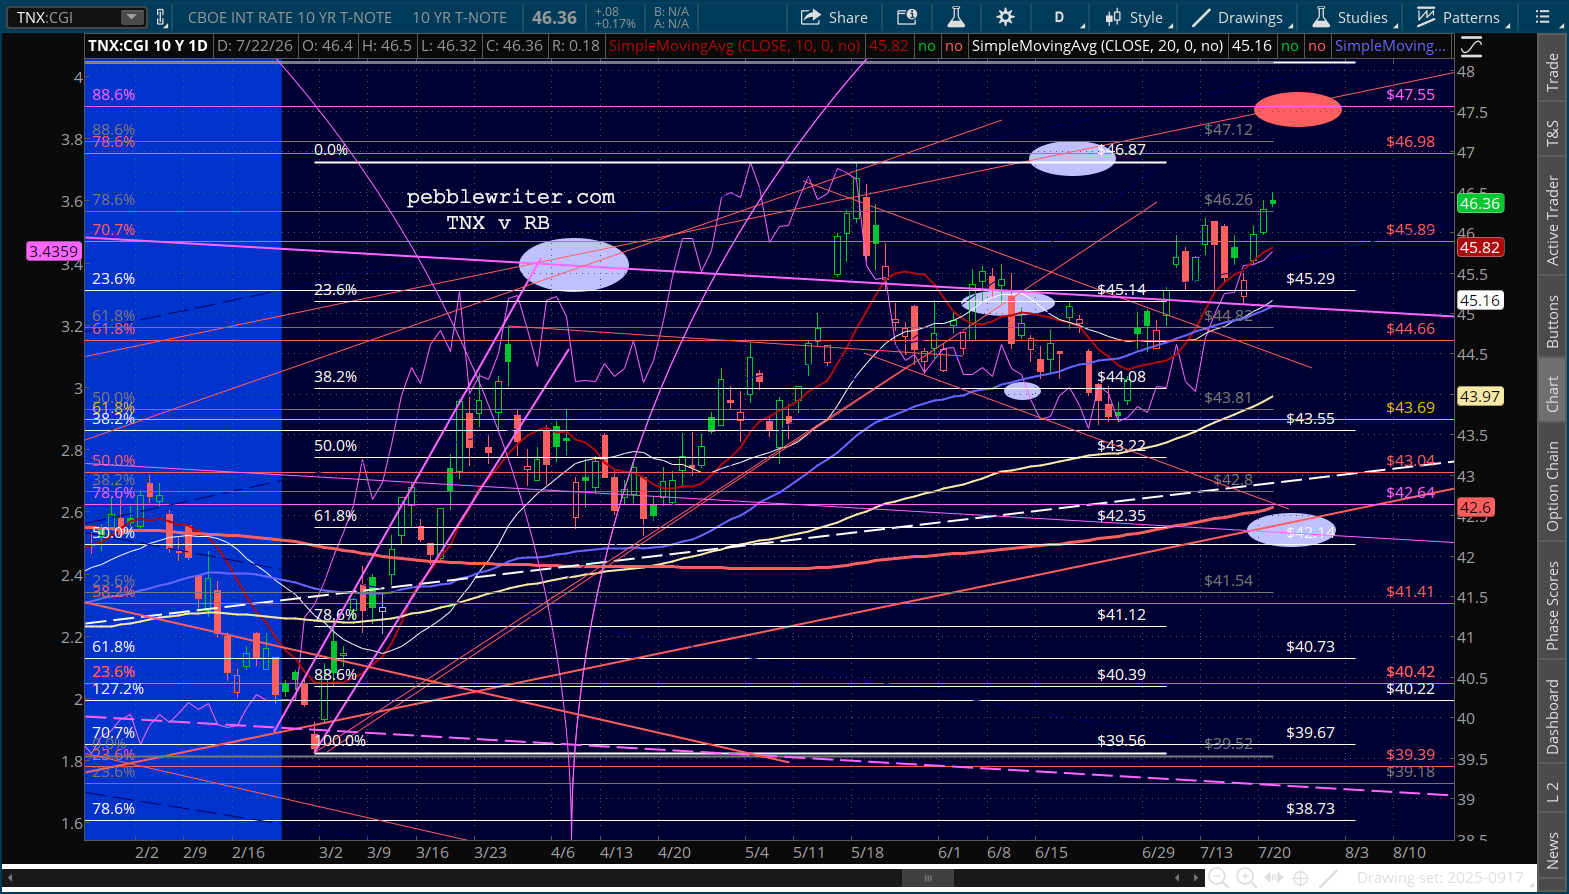
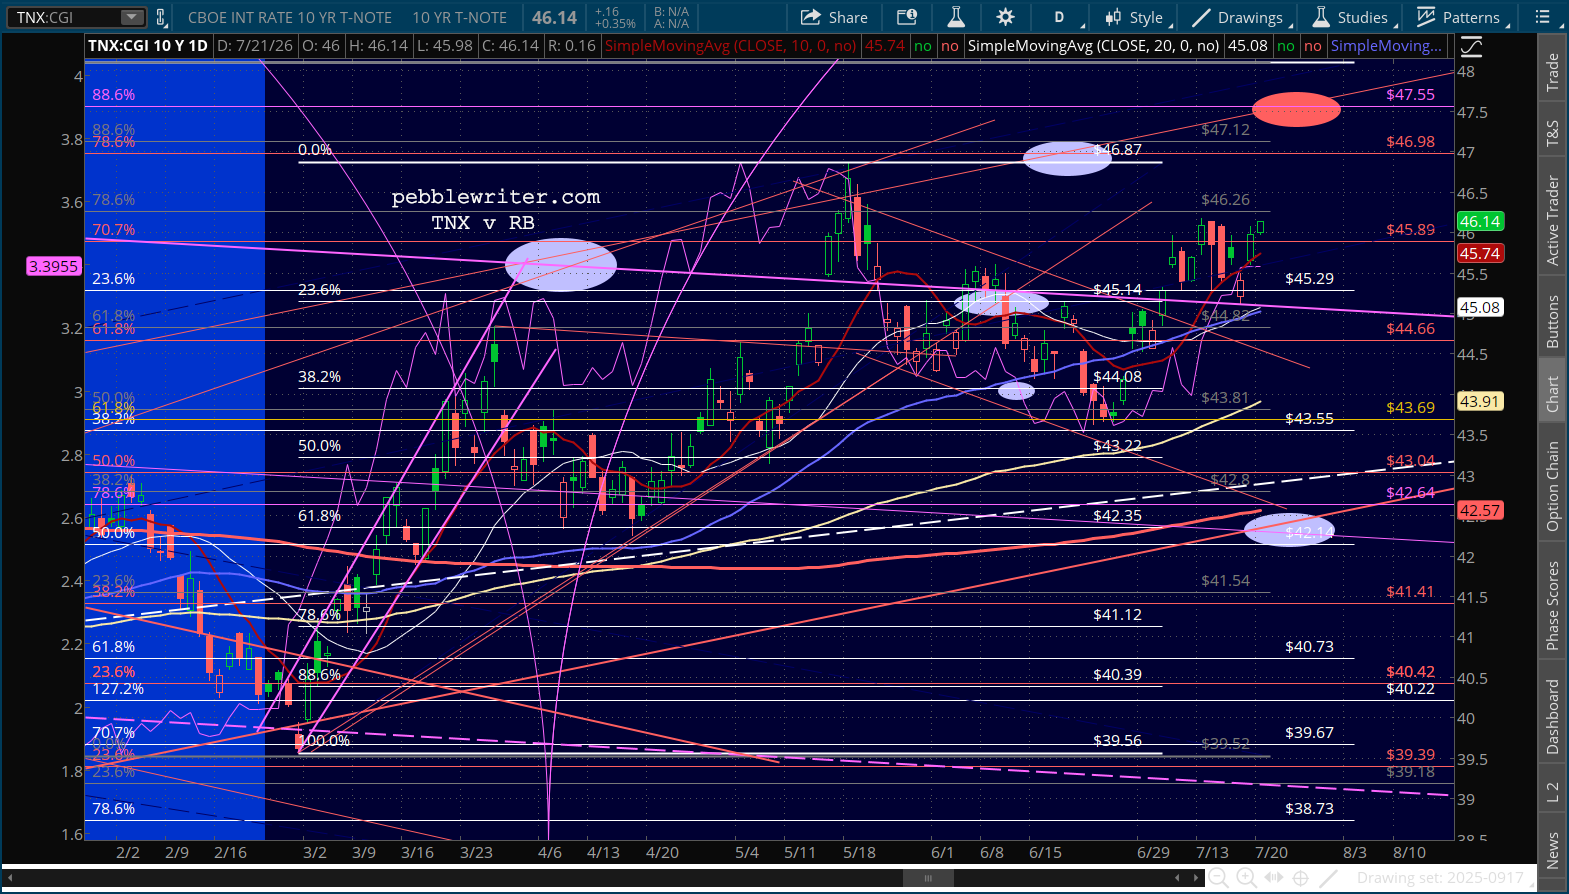
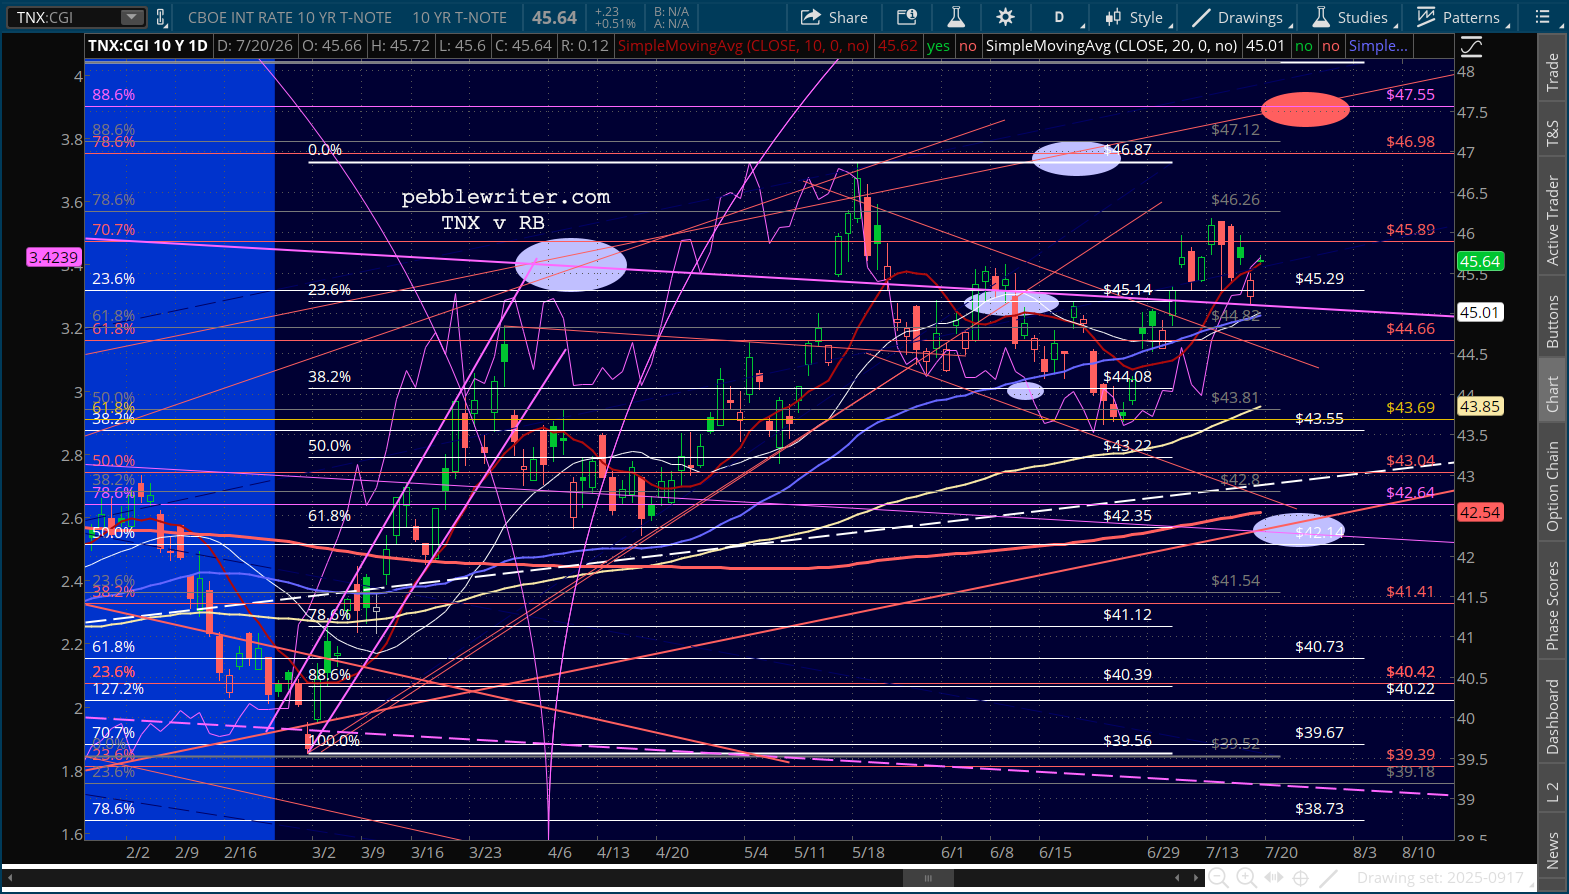
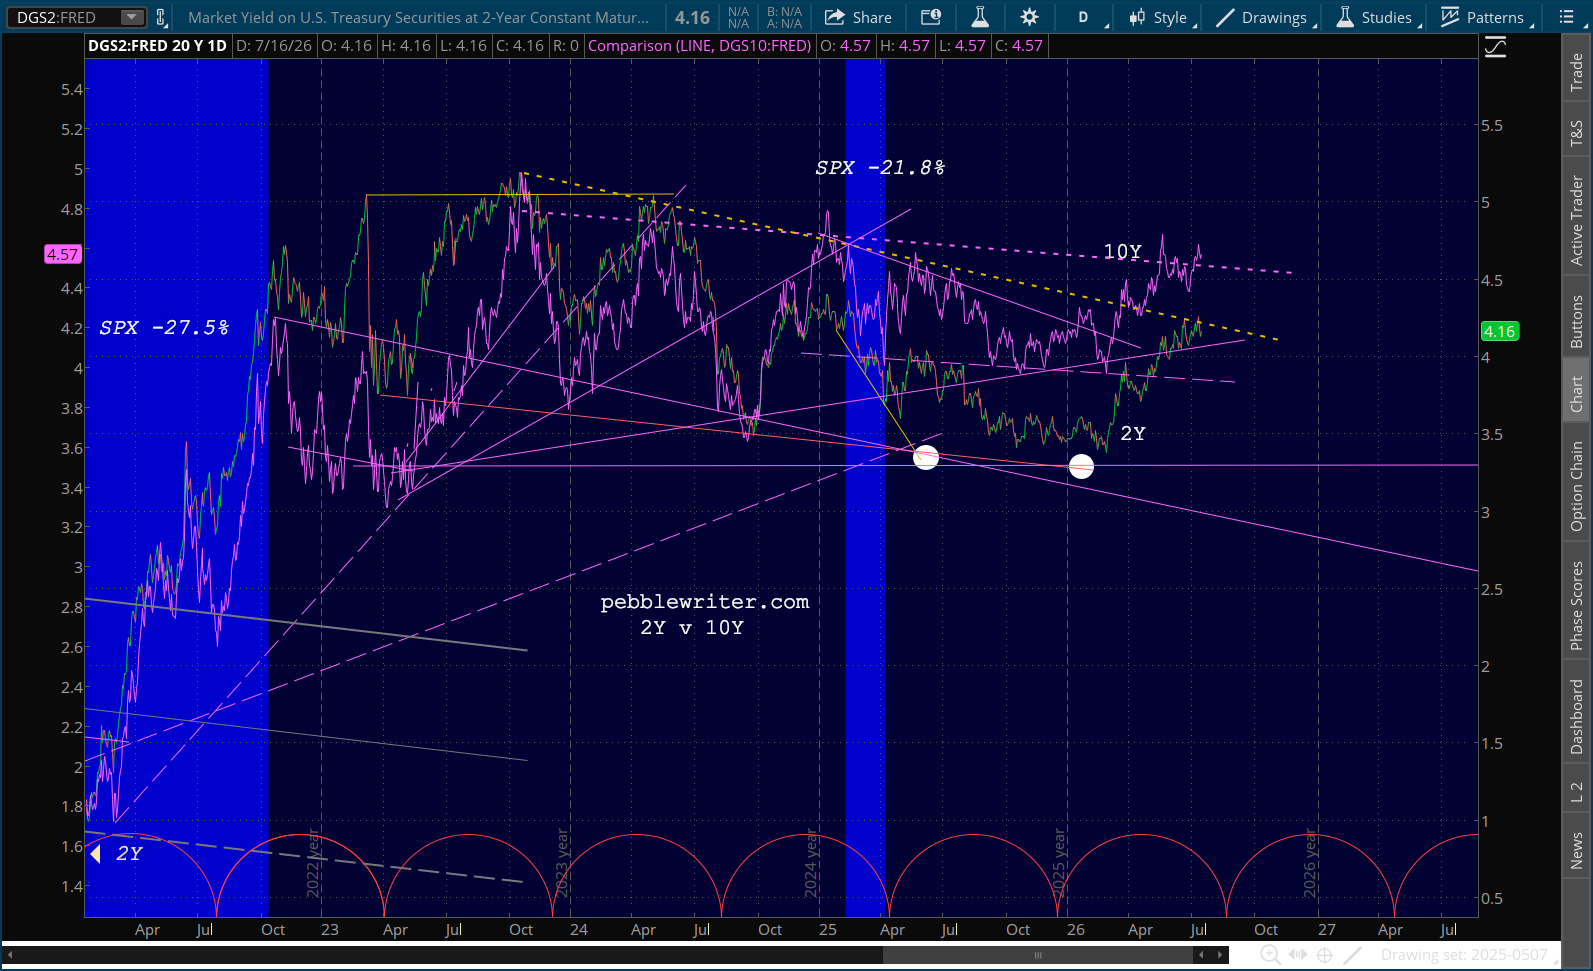
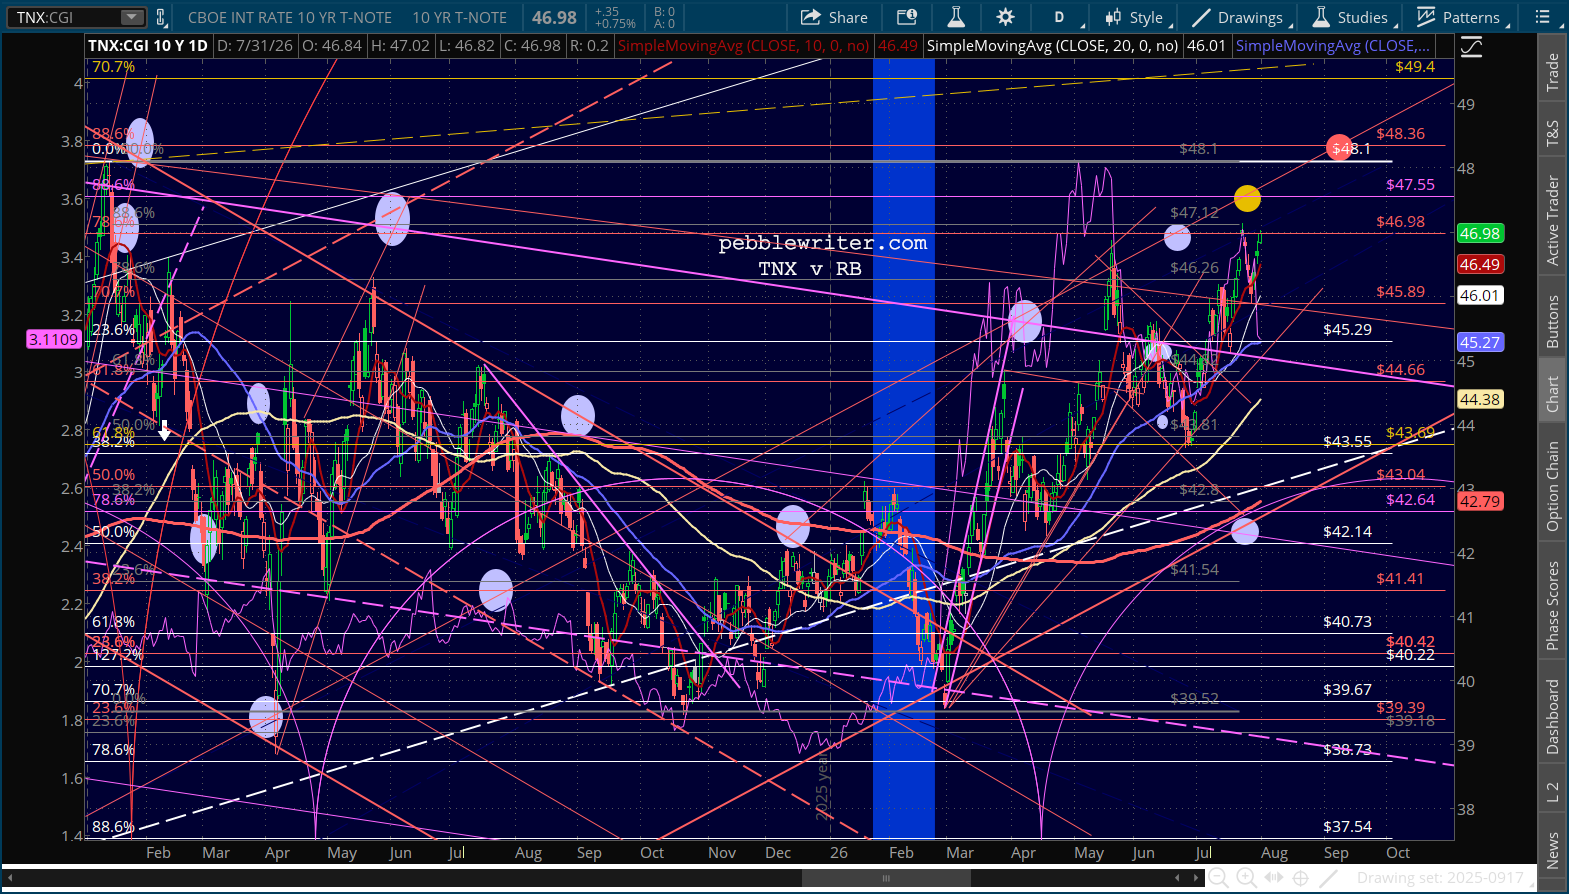
Inflation has been above target for five years. But, Warsh admits it could take months to bring it back down, asserting that last month’s falsified CPI data justifies the Fed sitting on its hands until at least September. The bond market believes otherwise, with the 10Y clearly breaking out while the 2Y drops like a rock as investors like Leopold Aschenbrenner notice the music has stopped. How many other overleveraged prepubescent billionaires are out there?
continuing…