

UPDATE: Mar 26, 2021
CURRENCIES, BONDS
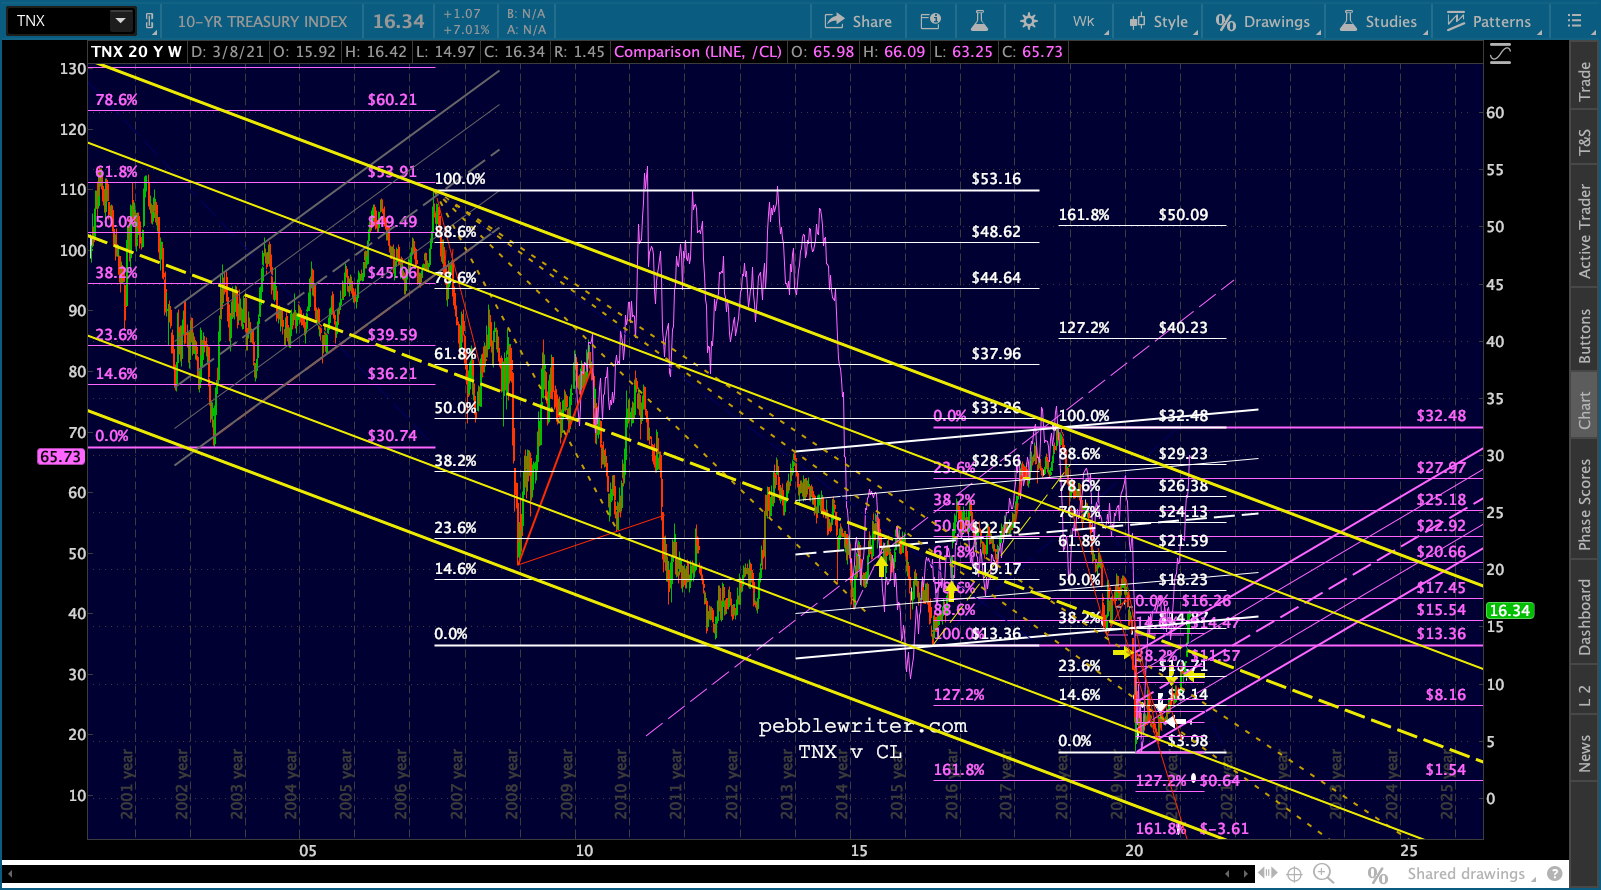
The 10Y has pulled back some, but has yet to make a decisive move. At this point, we can surmise that a drop in oil/gas would soften rates – but the Suez Canal situation obviously poses a potential complication.


 USDJPY is threatening very strongly now.
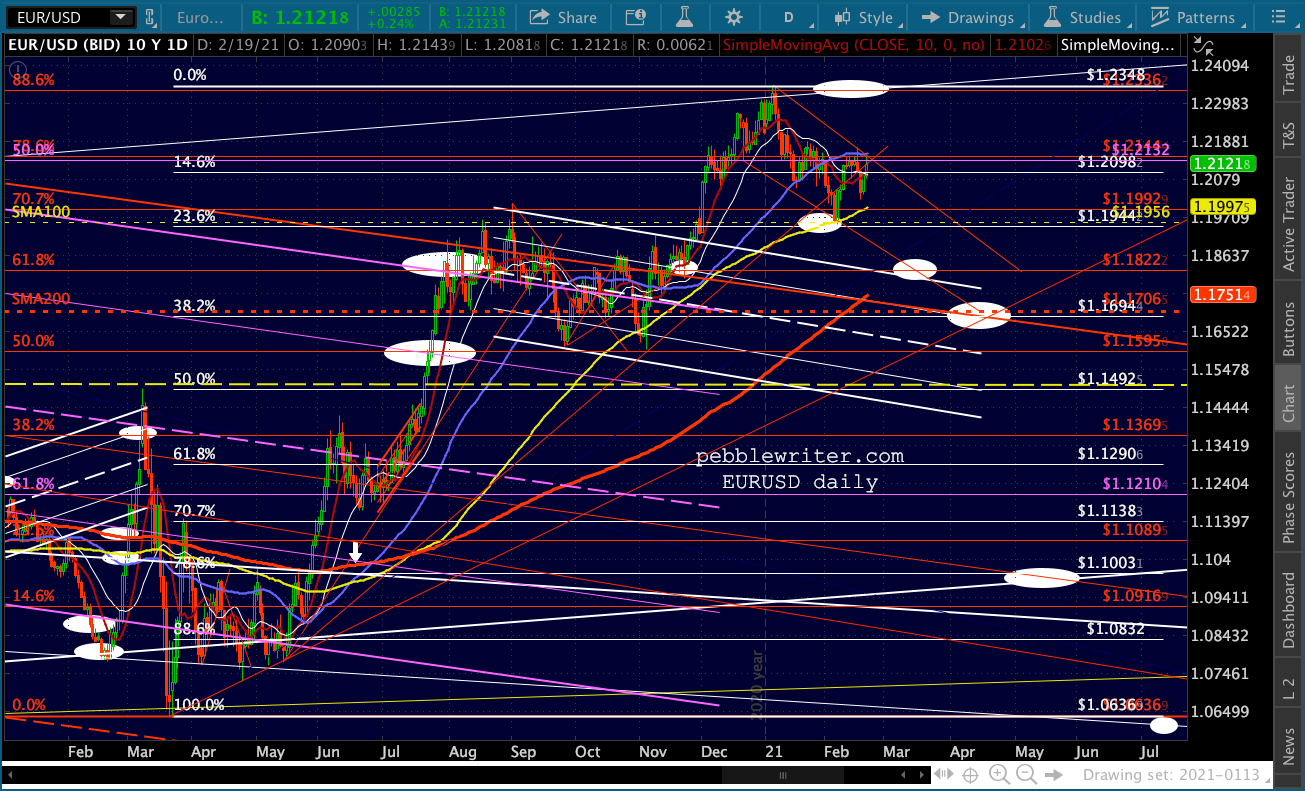
 Combined with EURUSD’s weakness…
 …this could put additional upside pressure on DXY, which has at times been a negative for GC.
 As could ZN if it doesn’t reverse course.
 GC:
GC: 


 SI:
SI:


 BTC:
BTC:


UPDATE: Mar 19, 2021
CURRENCIES, BONDS
Take a look at today’s Big Picture post, which provides detailed background for where we are in general. In sum, the Fed must keep a lid on rates by limiting inflation by forcing oil/gas prices lower. This will have an impact on stocks; but they should attempt to prop up stocks by shorting VIX and having USDJPY break out.
ZN hasn’t really found support yet, suggesting that TNX could go higher. 

 Especially if CL/RB don’t drop fast enough to extinguish inflation fears. I believe this puts us in the same place we were in Oct 2018, when a similar situation occurred.
 10Y yields, CL, RB, stocks and USDJPY all topped within a few days of one another as the Fed/Admin put a lid on inflation that was becoming problematic.
 At this stage, I believe they will be smarter about propping up stocks with VIX and USDJPY. It would be very easy to engineer a breakout in USDJPY…
 …which is very close to some major overhead resistance.


 The wild card is the euro. If it breaks down here, it could amplify DXY dollar strength from the falling JPY. If it bounces, it would offset the JPY’s effect.
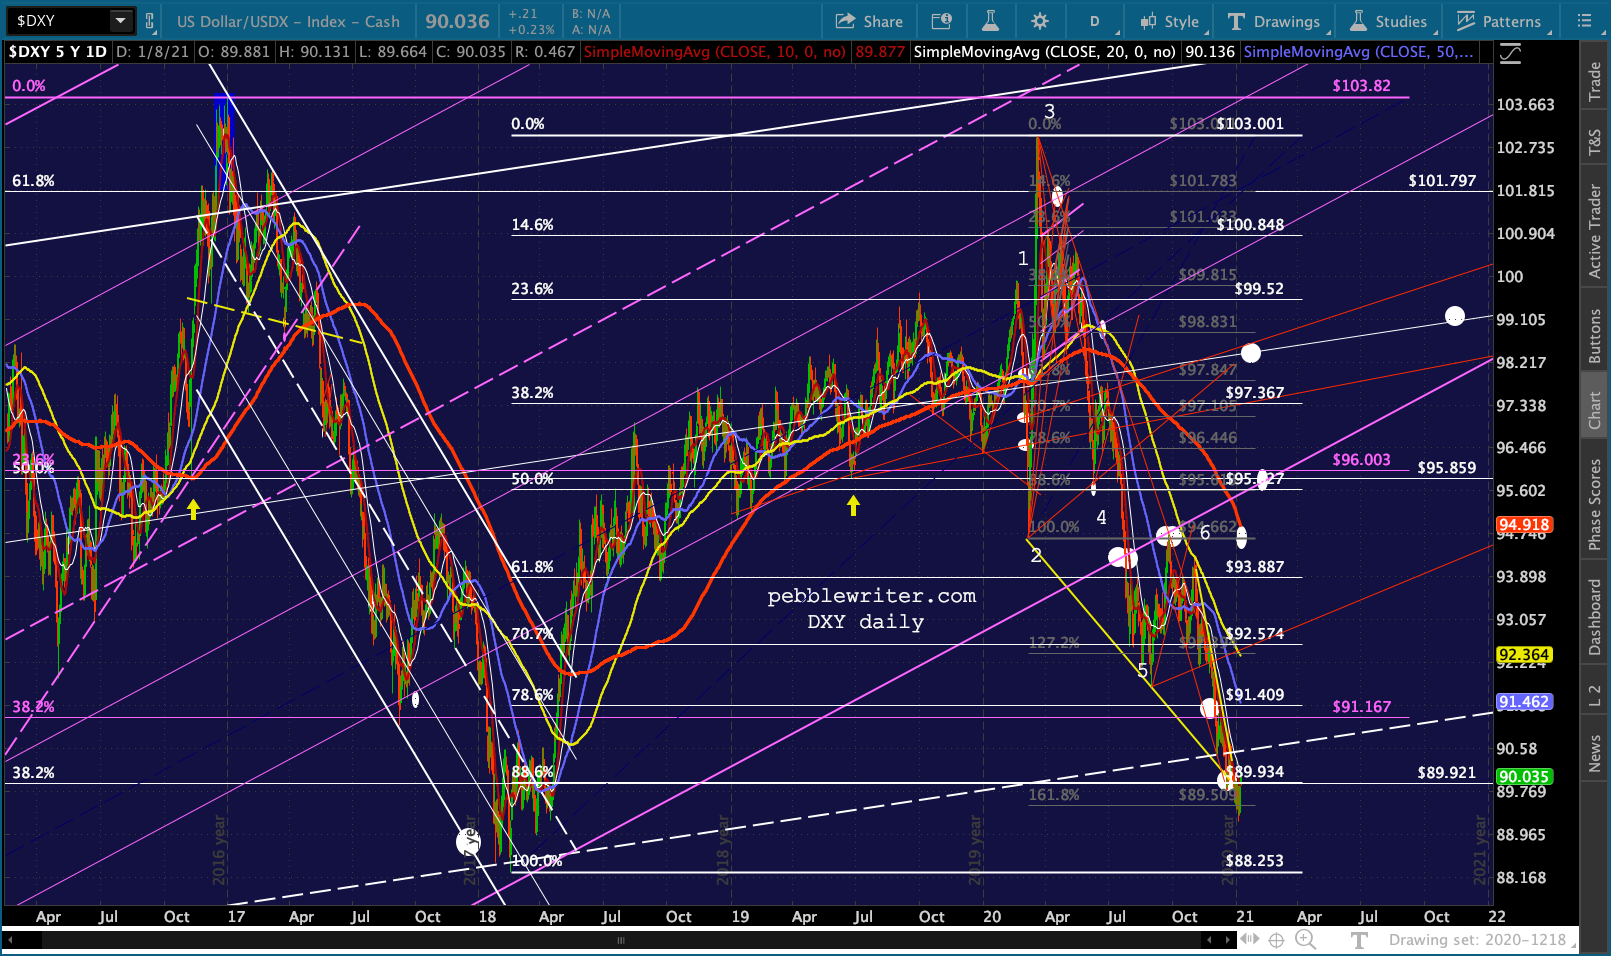
 DXY already broke out of its rising channel once. I expect it to do so again, but this time to rise up and backtest the broken purple channel – a gain of around 4-5%.
 In 2018, EURUSD bounced slightly, then went sideways for quite a while. This was a big departure from previous EURUSD breakdowns.
 And, it allowed DXY to go on a gentle extended rise after breaking out from a falling channel in May 2018. The rising DXY, of course, was helpful in mitigating inflation pressures.
  GC
GC
GC made an important bottom in Oct 2018 and began an extended rise which ultimately completed the huge IH&S Pattern – somewhat surprising since inflation topped out and dropped pretty substantially. As we’ve discussed, the rising purple channel has been tested and, so far, has held up. If it fails, there is plenty of downside ahead.
 I believe we’ll get a backtest of the SMA50 where it could break out again to backtest the cloud and SMA200.
  The RSI supports this thesis.
  SI
SI
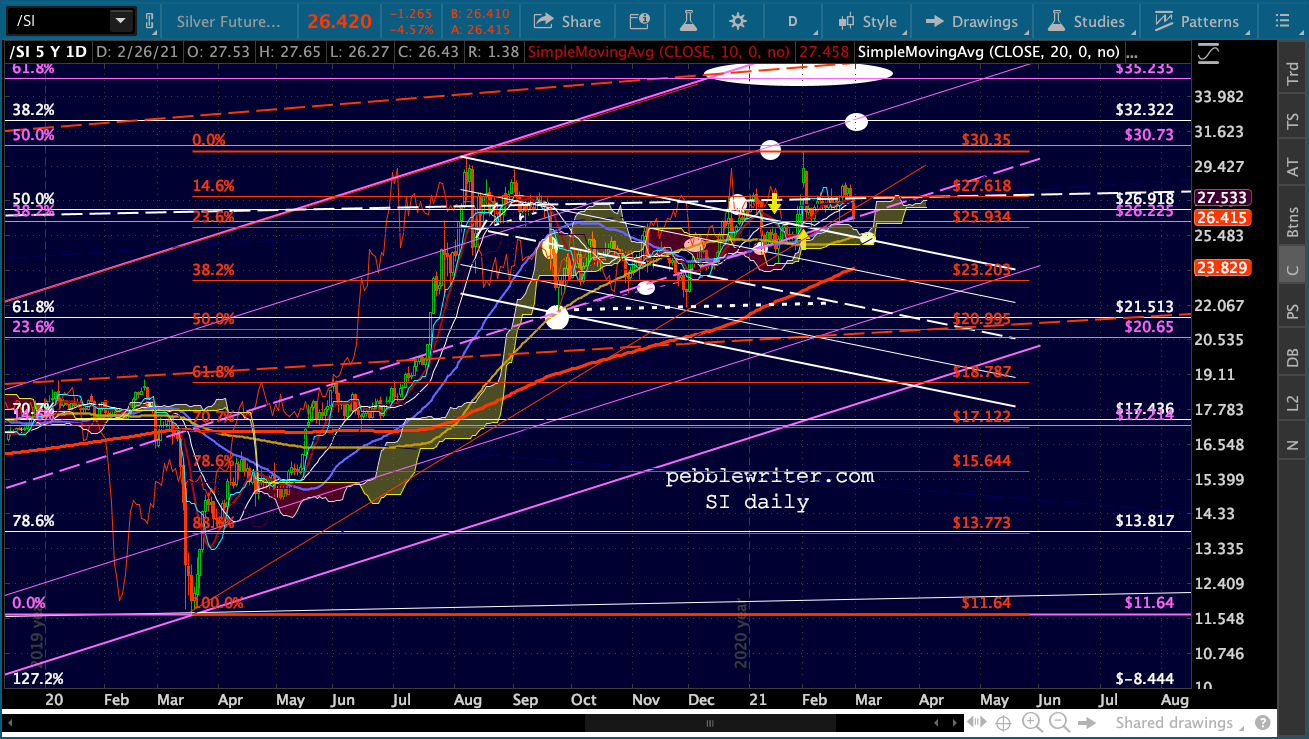
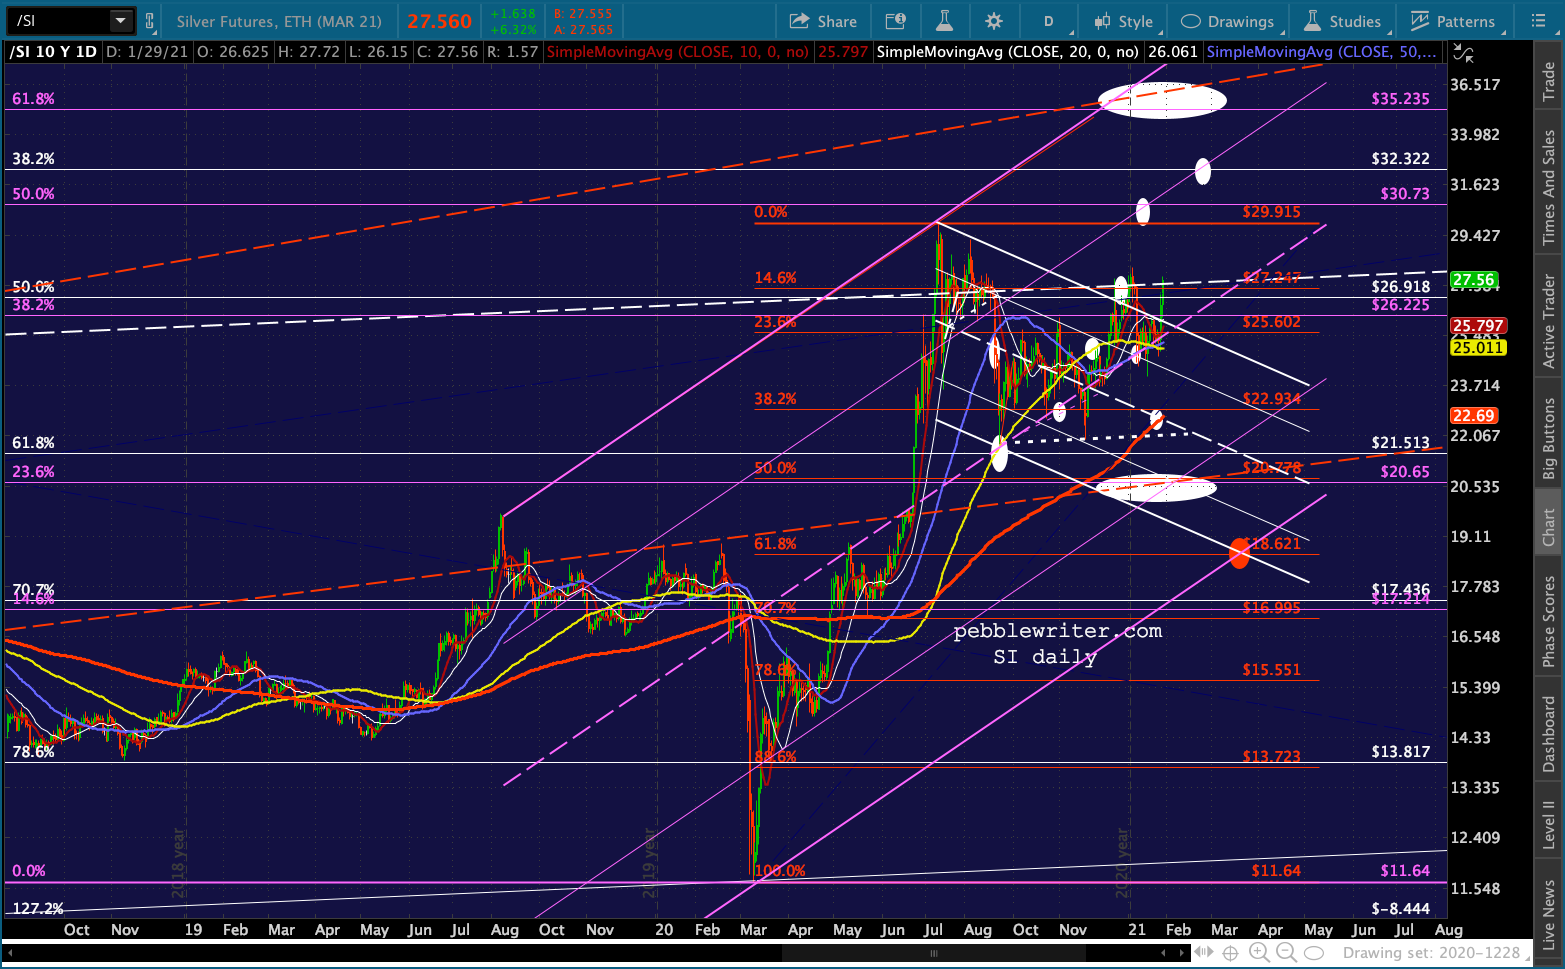
SI took quite a while to get much of a bounce going, and then – in contrast to GC – made new lows.
 It’s important to note that it had recently broken down below a fan line from the 2000 lows and needed to backtest the rising white channel .236 line.
  I’m still looking for a backtest of the SMA200 as it emerges from the broken falling white channel.
 The RSI supports this prognosis – with next steps somewhat murky. We’re now going on 7 months of hanging out in the cloud – which is analogous to a directionless market.
 BTC
BTC
BTC has tried to break out of the rising salmon channel a couple of times, but is back inside it at the moment. The channel intersects the next higher (3.618) Fib at 63,000 at the end of March. As long as BTC can hold the short-term SMAs, this should be its next test.


 RIOT
RIOT
It has recovered from its TL breakdown and bearish 10/20 cross and has since completed a bullish 10/20 cross. 
 It also recovered from a breakdown of an RSI TL.

UPDATE: Mar 12, 2021
CURRENCIES, BONDS


GC


SI


BTC


UPDATE: Mar 5, 2021
CURRENCIES, BONDS


 GC:
GC:

 SI:
SI:


 BTC:
BTC:

 RIOT:
RIOT: 


UPDATE: Feb 26, 2021
CURRENCIES, BONDS:


 GC:
GC:


SI:


BTC:


UPDATE: Feb 19, 2021
CURRENCIES, RATES:


GC:


SI:


BTC:


UPDATE: Feb 12, 2021
CURRENCIES and BONDS
The 10Y pushed slightly above its prior high right after the UMich Consumer Sentiment came out – seems like only a protective measure. It still faces the channel top and the yellow .886 as resistance, and the recent underwhelming inflation figures shouldn’t provide much support.  Since reversing at its .886, the EURUSD has been tracing out a falling wedge which I expect will connect with the SMA200 around 1.18 in mid-March. This would keep DXY from breaking down much further, as would USDJPY’s bounce.
 But, it’s easy to see why the Fed might be getting nervous about the dollar breaking down in the lead up to what I expect will be a March-April surge in inflation (unless they crash oil/gas.)
 No one seems to care much about ZN breaking down, but it continues to be a drag on GC. The recent breakdown in DXY, by the way, had little effect on gold.
 GC:
GC:
Notable here is that GC’s bearish 10/20 cross (yellow arrow) marked a bottom instead of ushering a new low right away. Likewise the 50/200 cross (white arrow.) It can’t break out, but it’s being protected from breaking down.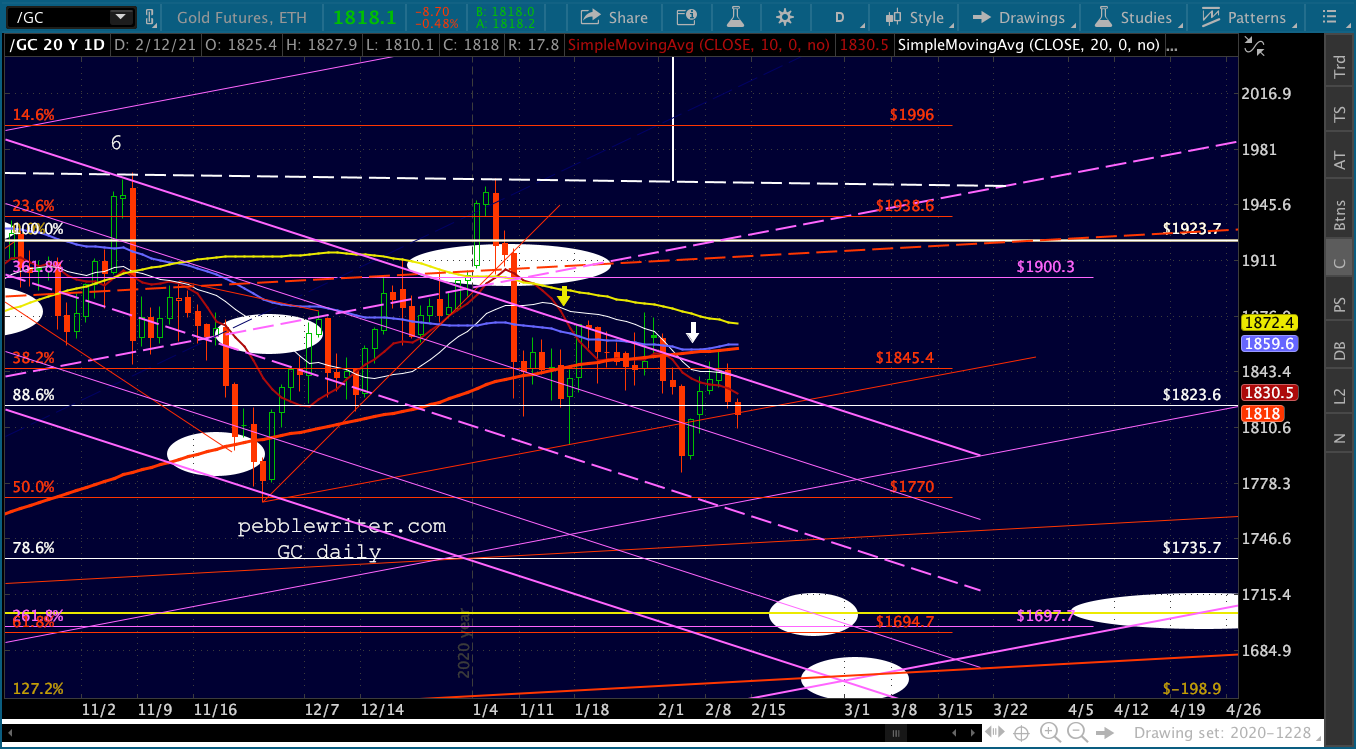


 SI:
SI:
Same with silver, the bearish cross marked bottom and the bullish cross marked a top. Completely backwards from the norm.

 Unlike GC, it remains broken out and has made a higher high – which failed rather quickly.
 BTC:
BTC:

 RIOT
RIOT


UPDATE: Feb 5, 2021
CURRENCIES and BONDS:
The 10Y again pushed to the upper limit of its broader rising channel – seemingly locked in a smaller rising channel which reflects “reflation” expectations.
 It’s increasingly obvious that higher rates are thought of as being positive for stocks as they imply rising inflation due to the economy coming back. However, at some point investors/algos will equate higher rates with higher financial risk due to the explosion in debt.
 The red cycles mark the 10Y yield bottoms. The purple ones mark the SPX bottoms.
  The 10Y cycle got off schedule in 2009 when stocks seemingly bottomed in Nov 2008, only to make a much lower low in Mar 2009. The flight of capital from stocks to bonds drove rates to exceptionally low levels.
  In 2012, it was back to normal. In 2016, however, we had another premature bottom in yields when Trump was elected. Futures fell over 4% overnight. SPX’s recovery was very much in jeopardy.
Rates plunged below previous lows in response, but the Fed quickly brought them back up. It was the 2017-2018 version of the reflation trade, with CL soaring from 26.05 in Feb 2016 to 47 in Nov 2017 to 76.9 in Oct 2018.


UPDATE: Jan 29, 2021
Things aren’t boring any more!
USDJPY’s breakout continues, though today’s close will be important…  as the purple channel midline has at times mattered quite a bit.
 The strength it lends to the dollar is being offset by a slight bump in EURUSD.
 So DXY is still basically going nowhere.
 10Y yields are rallying before having reached support.
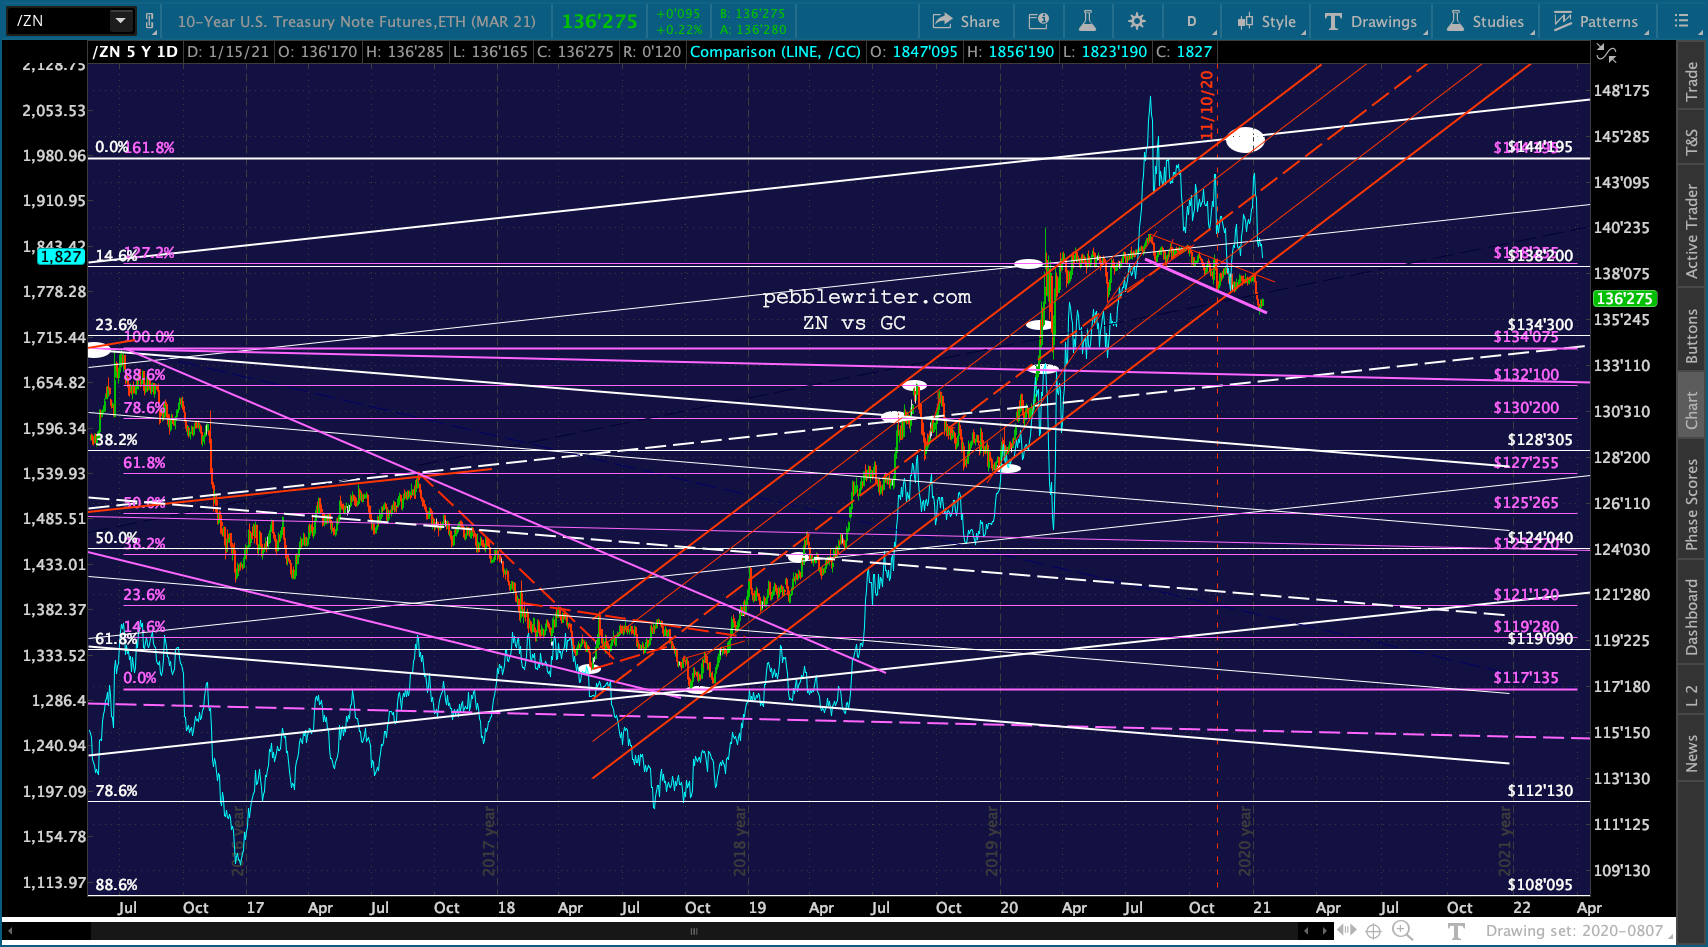
 Which is sending ZN lower. Normally, it would drag GC lower too. But, we’re getting a divergence.
 GC:
GC:
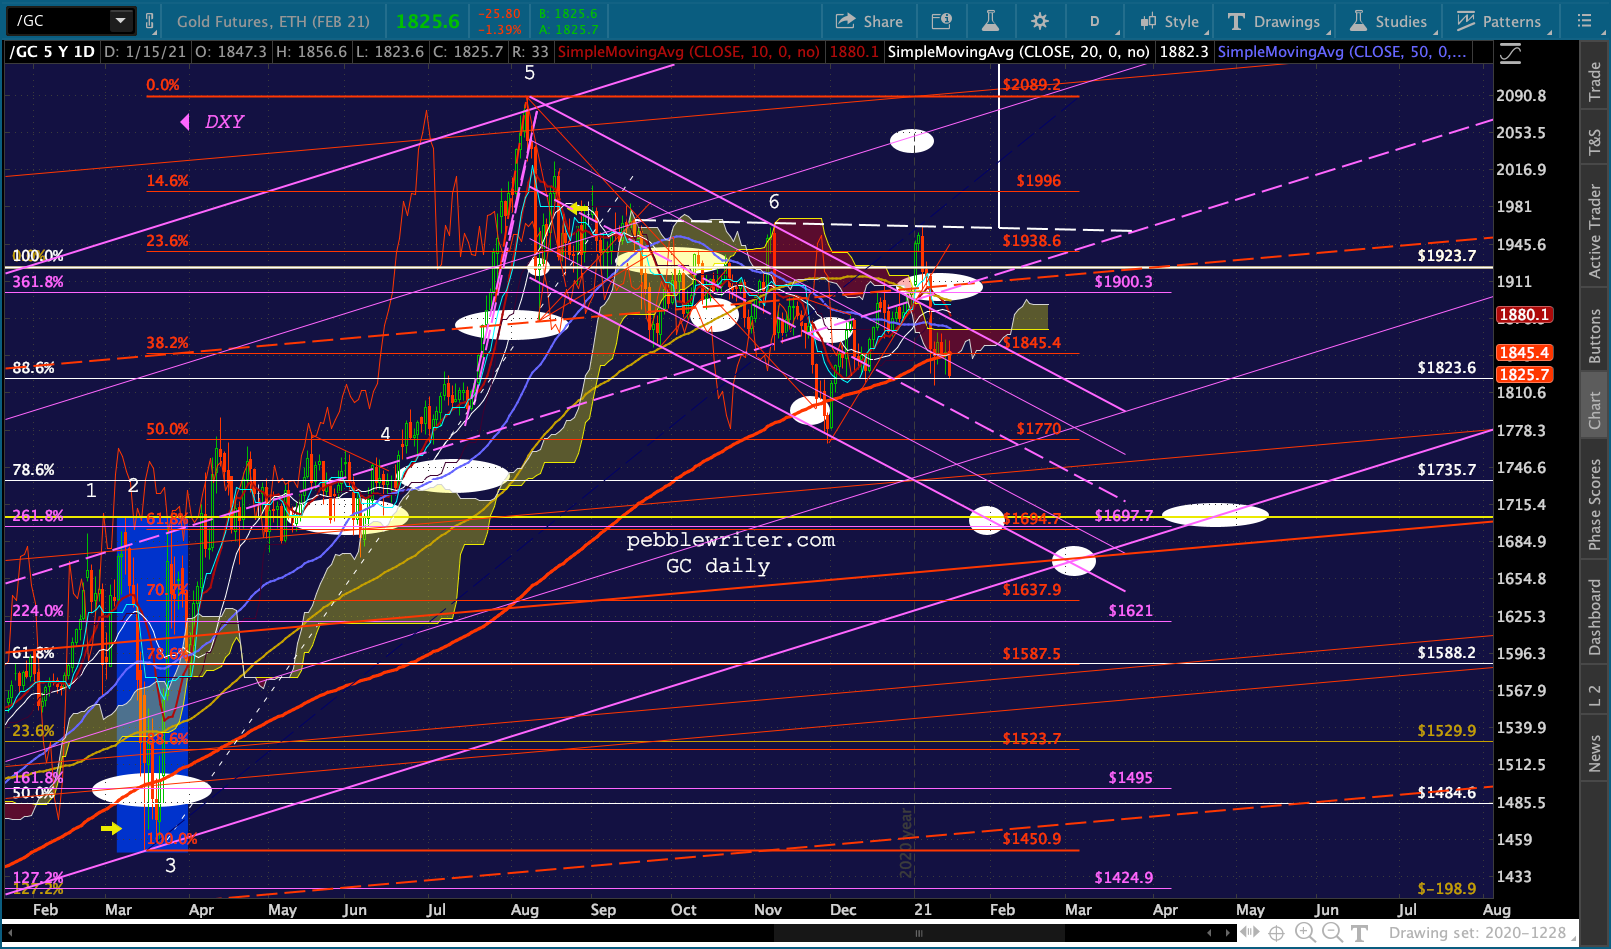
GC is actually breaking out slightly – though it’s way too early to tell whether it will stick. If stocks continue their meltdown, it will likely retreat along with them.
 RSI is indeterminate, though the cloud is still exhibiting resistance.

 It has clearly underperformed SI lately.

SI:
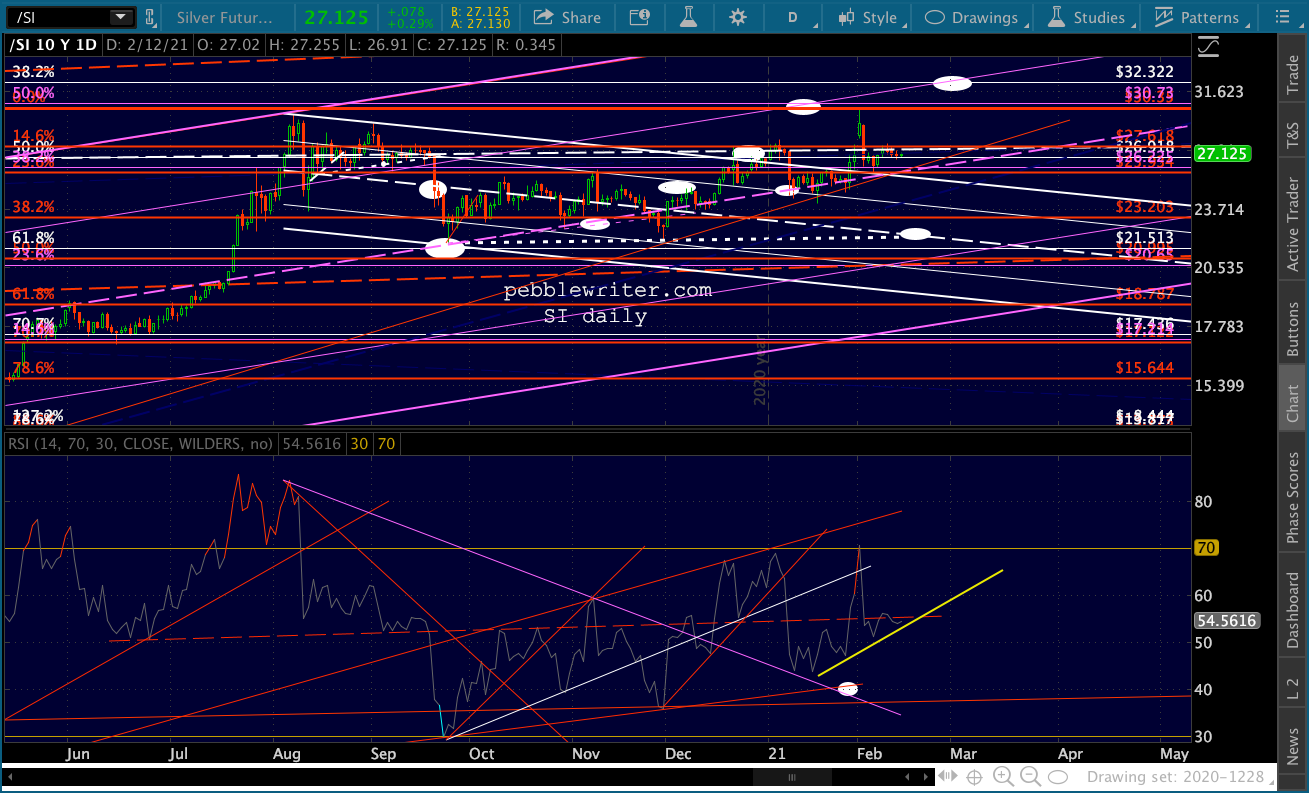
SI is benefitting from a Reddit bump. It’s reportedly the latest target of a short squeeze effort.
In any case – it’s breaking out. The real test is about to begin as it reaches the white channel midline.


 RSI has given the all-clear…
  …as has the cloud. Now all we need is a sustained push above 27.45.
 The only things which could spoil the party are a general market meltdown, major institutions which regularly short it and, of course, the Fed. I don’t need to remind you that it has been beat down many times before.
BTC:
BTC is also getting a boost from an unusual source.

 It has broken out of the yellow channel – at least for now – potentially suggesting a less steeply falling channel (if our cycle model is to hold.)
 Pulling out a little bit, we can see that BTC has risen back above both the SMA10 and SMA20 – which are still in a bearish alignment.
 The big picture…

 I suspect Elon has a large BTC position and saw the writing on the wall.


RSI suggests more downside if it can’t get back above the black line.
UPDATE: Jan 22, 2021
BONDS, CURRENCIES
The 10Y has been treading water for the past week – probably hesitant to drop to the channel bottom until it intersects with the .618 at 97.5 bps. If/when this channel breaks down, things will get very interesting. If it keeps going, it would support the premise of the reflation trade…  …and could cause a significant breakdown in the USD.
 We’ve been looking for a rebound in DXY – perhaps to backtest the broken purple channel. But, I remain concerned about a breakdown – which would presumably involve a breakout in yields. It has now been over one month since DXY reached its .886 and has yet to make a decisive move. Instead, it’s coiling – which usually results in a more violent move one way or the other.
 I’m looking for a continuation of EURUSD’s decline (dollar strengthening)…
 …which is occasionally being partially offset by USDJPY’s losses (dollar weakening.) It’s difficult to feel confident in a continuing drop, however, since USDJPY is hovering just below a potential breakout – a common rescue technique for stocks.
 The 10Y futures chart continues to concern me.
  The rising red channel broke down, and it’s too early to tell whether it will result in a significant pullback (rise in rates)…
 …or it’s a headfake engineered to support stocks – again, driven by the idea of a reflation.
  But, if reflation is really going to happen, why do GC and SI continue to slump in the midst of massive money supply growth?
GC
It has been 10 weeks since GC first had a chance to break out of its falling purple channel. About the only thing going for it is the SMA200’s support…
 …and an aversion to making lower lows (so far.) The SMA10 and SMA20 have been bearishly aligned since last Thursday.
 RSI completes the bearish picture. But, again, we’ve been several breakdowns which didn’t result in much downside.
 Bottom line, it has another prime opportunity to break out – but I’d take a “show-me” approach and favor being short with stops around 26.05.
SI
SI is showing many of the same patterns as GC, with the primary differences being it is above its cloud and rising purple midline (GC is below both) but has yet to test its SMA200. There’s also a bearish 10/20 cross to consider. Since the SMA200 is coming up on the falling white midline, it is an increasingly viable target. If my thesis about falling oil and gas prices is correct, we should see a falloff in inflation expectations which would presumably be bearish for PMs.
 The RSI chart shows at least a little downside, with much more if the lowest rising red TL at 40ish breaks down.
  BTC
BTC
As expected, BTC eventually backtested the blue 1.618 Fib extension – then got a heck of a bounce. It’s back out of the pink channel but can rise quite a bit more before reaching the top of the falling wedge/channel at around 37,300. Note that it just had a bearish 10/20 cross – something that hasn’t happened since last October around 11,000. A close-up shows potential to reach the next lower Fib, the blue 1.272 at 24,165, if 29,890 doesn’t hold. Timing under the falling wedge would be the end of Feb, while the falling yellow channel reaches it around Jan 31.
 Note that the cycle model calls for a low around Sep 30 and the next high around July 2022.
 As we discussed last week, BTC’s cloud is currently around 24,050 – very close to that 1.272. But, it starts rising after Jan 23, and its bottom will reach the Fib by Jan 27. In other words, the drop (if it comes) could be just as sharp as the other recent ones.
 Note also that its RSI broke down below the blue TL briefly yesterday – only to pop back above it today.
UPDATE: Jan 15, 2021
BONDS, CURRENCIES


GC


SI


BTC


 Last, RIOT did, in fact, reverse as its .618 and then turned around to backtest its white and purple .382s.
 Last week’s RSI chart was prophetic, and it doesn’t look like it has any support here.
 And, the bottom of the Bollinger band is down at our .618 retrace target at 11.5 – some 45% lower than current prices.

UPDATE: Jan 8, 2021
BONDS, CURRENCIES
DXY is pushing slightly above its .886 again…
 The 10Y is running out of upside.
  And, while everyone’s crowing about the banks and the benefit they’ll derive from the yield curve steepening, consider that the past highs at this same level didn’t work out so well.


GC
GC’s breakout looks to me like it’s going to fail. Giving up the 1923 level is very problematic.
 Remember its correlation with ZN doesn’t bode well for it unless bonds promptly recover – in other words, rates reverse their climb.
 Whoops – just broke down – about to test the SMA200 and cloud bottom. Very important support.
 And, the RSI is at important support.

SI
Ditto for SI. A failure to hold the white midline is bearish.
 And, it also just broke down.


BTC


Disregard the charts below…


UPDATE: Jan 1, 2021
BONDS, CURRENCIES
We’ll finally find out if the DXY and 10Y holding pattern will yield a reversal. DXY pushed slightly below the .886, but held the grey 1.618 into the YE.

 There’s positive divergence on the daily RSI, which also held the 30/oversold level.
  While the 10Y managed to hold the channel bottom with some fancy moves over the past two weeks.
  EURUSD has probably run its course – suggesting a surge in DXY strength unless it breaks out.
 Though USDJPY hasn’t really reached strong support yet (not that it always does before rallying…) Our initial target was 102.37 versus the recent low of 102.87.
 The 2s10s is backtesting the latest support at 79-80 bps.
  Indications are that it will fall…
  …although there’s not much evidence just yet.
 GC:
GC:
Not much to report here, as GC is still testing the top of the falling purple channel and the red and purple channel midlines. It’s such strong overhead resistance that a breakout could have a lot of power.
 The RSI chart shows promise for a breakout, but I’ll believe it when I see it.
 Likewise, GC has poked up into the thin red cloud – indicating there’s less potential overhead resistance to cope with. But, it’s still only potential until GC pops out. Note that it’s only 18 below the former 1923.70 highs.
SI:
SI also remains stuck at the top of its falling channel but has held its rising purple channel midline…
 …and has already exited its cloud.
 The RSI isn’t terribly informative at this point.
BTC:
BTC reached 29,700 – just 190 from our target at the blue 1.618 at 29,890. As you know, I wasn’t terribly confident about it reaching these levels until it broke out of the rising pink channel, followed by a breakout of the rising purple channel and above the blue 1.272.
So, I’m naturally hesitant to call for a strong reversal here. But, the cycle pattern clearly suggests a reversal right here. The RSI has also reached the falling purple TL – which has typically worked very well in telegraphing occasional drops.
Downside targets are numerous: the SMA10 at 26,610, SMA20 at 24,258, 1.272 at 24,165 are the most obvious.


 The lows over the past 4-5 years haven’t been as compliant with the cycles. Though 2020 was, 2018 was off a bit. FWIW, the vertical black line indicates a potential low.
 RIOT:
RIOT:
RIOT broke out of the falling white channel, but is running into potential RSI TL resistance on negative divergence as it tests the .382 Fib. The argument is for a backtest of the broken channel top at 12.20-12.25, presumably when the SMA20 reaches that level early next week. Though, an overshoot to backtest the .236 Fib would also make sense.


UPDATE: Dec 25, 2020
BONDS, CURRENCIES
DXY is due for a bounce here.  If it doesn’t…huge amount of downside.
 EURUSD hasn’t quite reached natural reversal point, which would suggest additional dollar weakness…
 …which JPY has the potential to offset. A bounce in USDJPY while EURUSD rallies, then the whole thing reverses: EURUSD drops (dollar strengthening) as USDJPY drops (dollar weakness) which results in DXY’s bounce – particularly as result of fear trade.
 TNX would presumably break down…
  …which is plenty of cases has coincided with DXY strength.
  The longer-term picture.
 Thru the prism of the 2s10s:
 Equity weakness should follow breakout or reversal, either one.
 GC:
GC:
The charts indicate it’s positioned for a pullback after backtesting the red and purple channel midlines and in the face of DXY strengthening.


 Want to keep an eye on the RSI and Cloud for any signs of a breakout.
 SI:
SI:
SI is also positioned for further pullback to test the lower red TL.
 The white channel midline is significant. It failed to rise through it, so should backtest support before another try.
  If it can push through, has nice upside to next red TL and higher Fibs.
  At this point, red channel looking like the operative one.
  Has popped above the cloud, but the cloud is still red.
 RSI is positive as long as can maintain the solid purple TL.
 BTC:
BTC:
Tried to break above 1.272, but is still holding at that resistance and in line with cycle which suggests this is a top. Pullbacks should be looking at red TL and broken pink channel top currently around 20,820.


UPDATE: Dec 18, 2020
BONDS, CURRENCIES
ZN has held its channel so far – will it hold its positive correlation with gold?
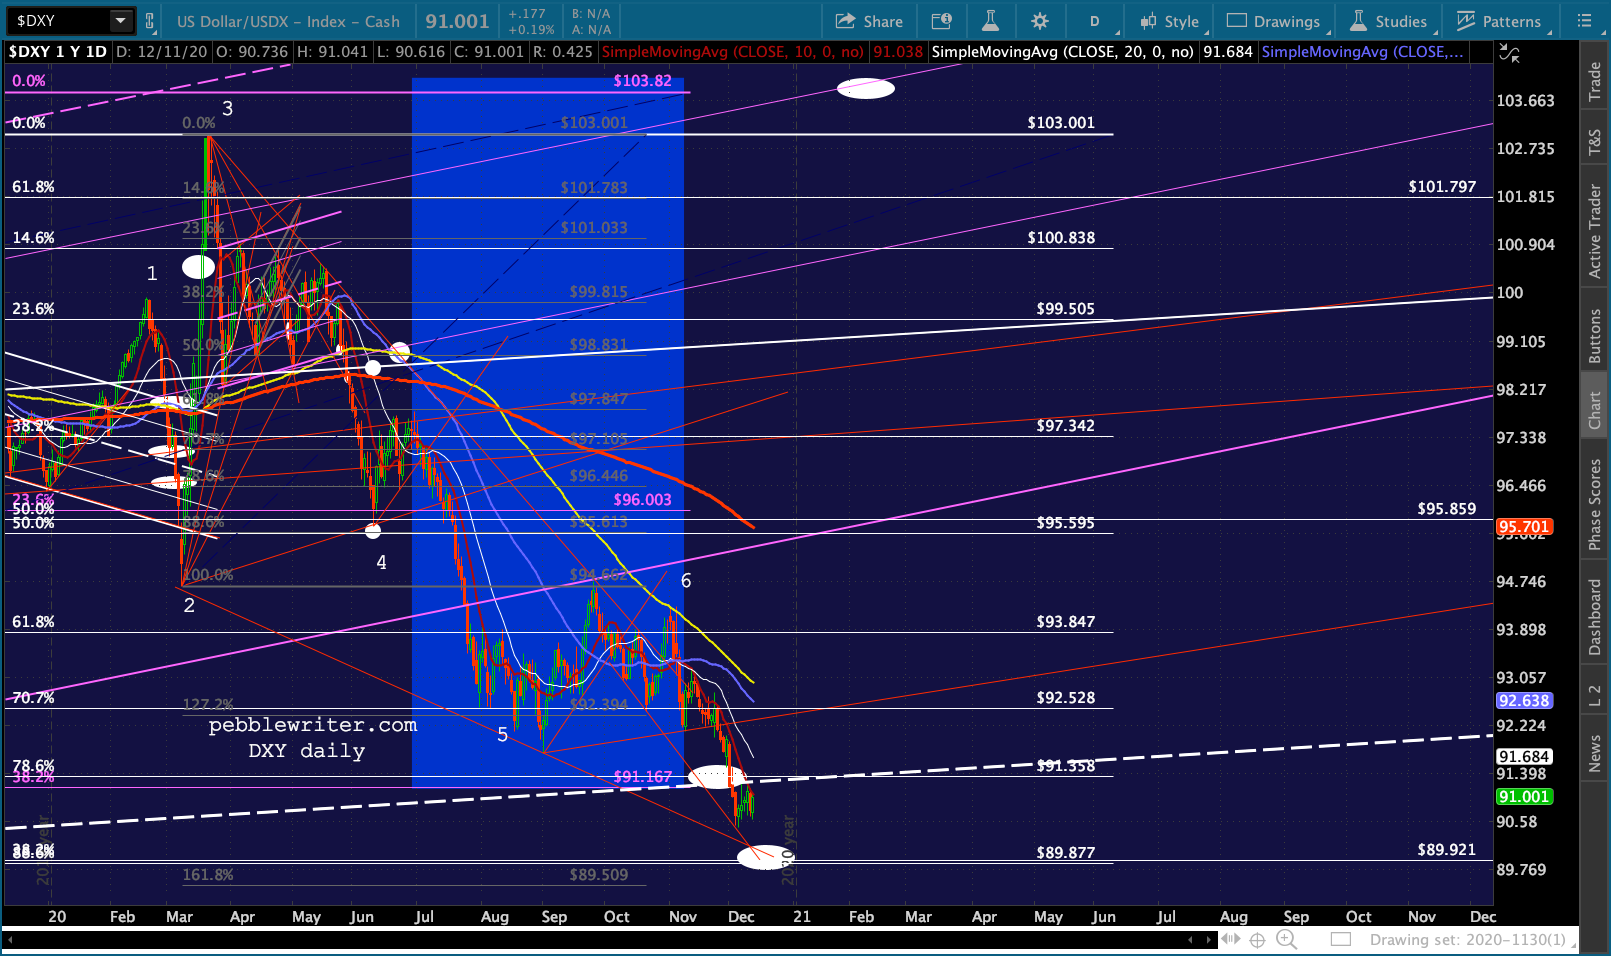
 Our premise is that DXY is due for a bounce – potentially a large one. A failure to bounce would be a major development.
  As we’ve observed before, DXY vs GC isn’t always that reliable. Lately, they’ve been positively correlated at times.
 TNX’s latest rising channel is getting very extended, with a breakdown likely in the next few weeks. This would normally be negative for DXY…
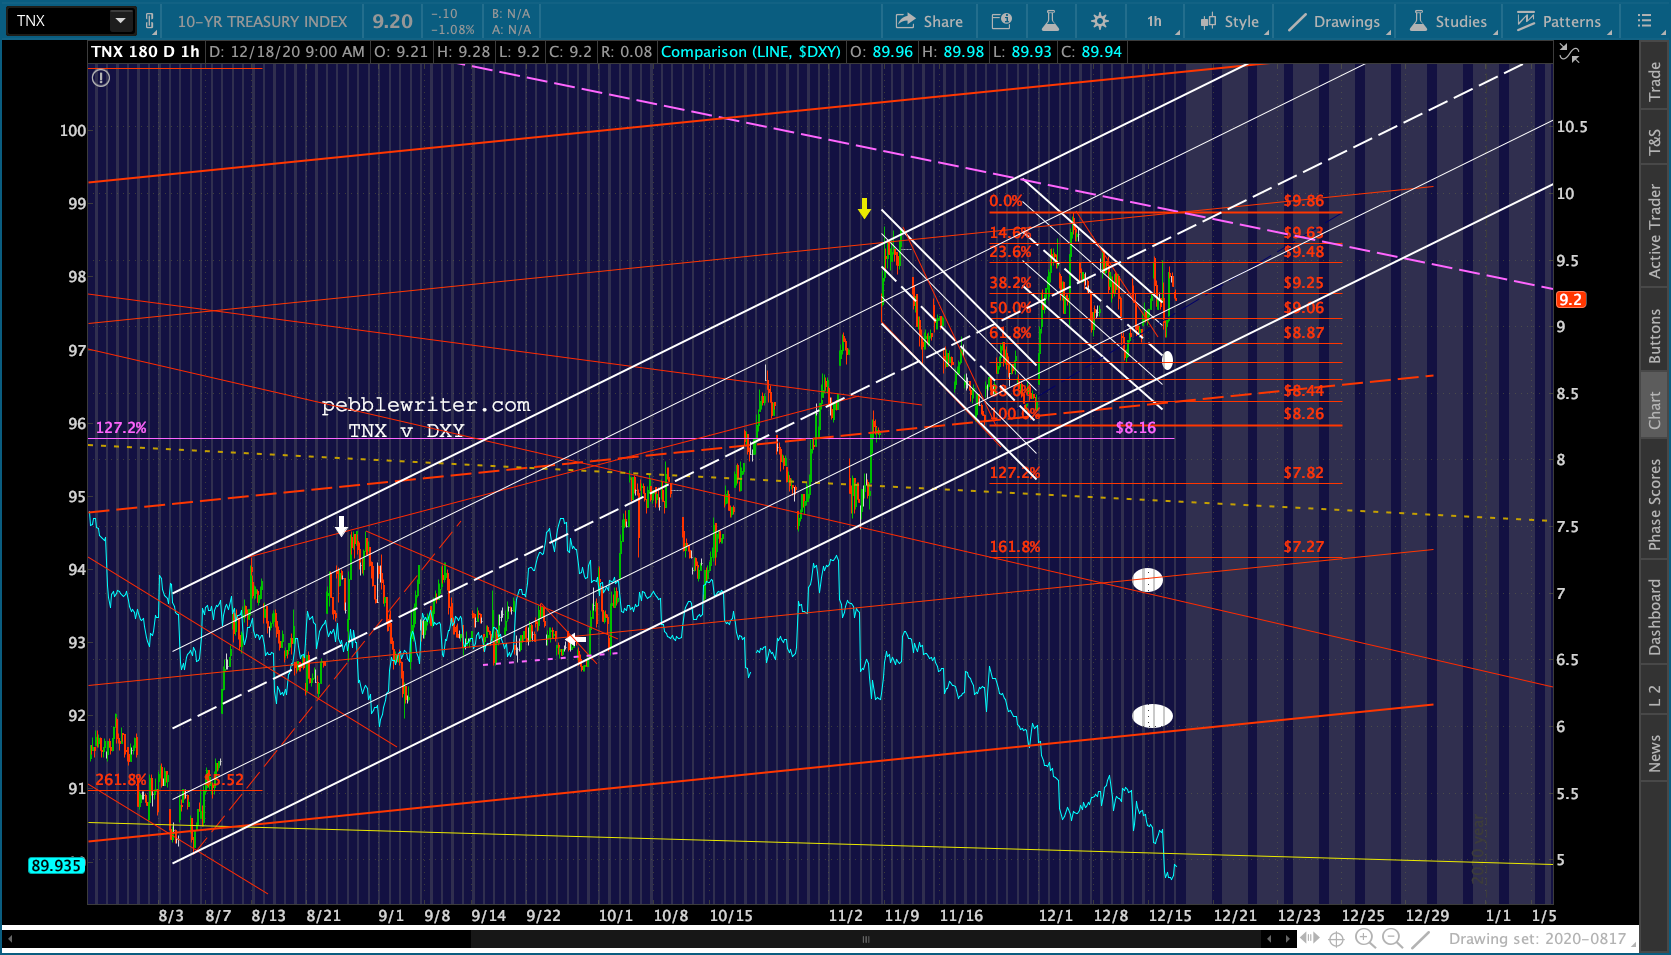 …unless it’s rallying due to a fear trade…
 …as it did 9 months ago.
 This would disrupt the stasis in the 2s10s, which would mean an equity correction whether it breaks out or reverses lower.
 And, the 2Y looks like it wants to go lower.
 GC:
GC:
Hitting multiple levels of resistance here…

 SI:
SI:
Looking more constructive – back above cloud and RSI breaking out. Only concern is potential flag pattern and, of course, potential DXY bounce.


BTC:


 Meanwhile…


UPDATE: Dec 11, 2020
BONDS, CURRENCIES:


GC:


 SI:
SI:


BTC:


UPDATE: Dec 4, 2020
CURRENCIES / BONDS:
 On the brink of a breakdown…

 Near the end or breaking down?
 GC:
GC:


 SI:
SI: 

 BTC:
BTC:


 RIOT:
RIOT:


UPDATE: Nov 25, 2020
CURRENCIES / BONDS:
DXY is finally breaking down…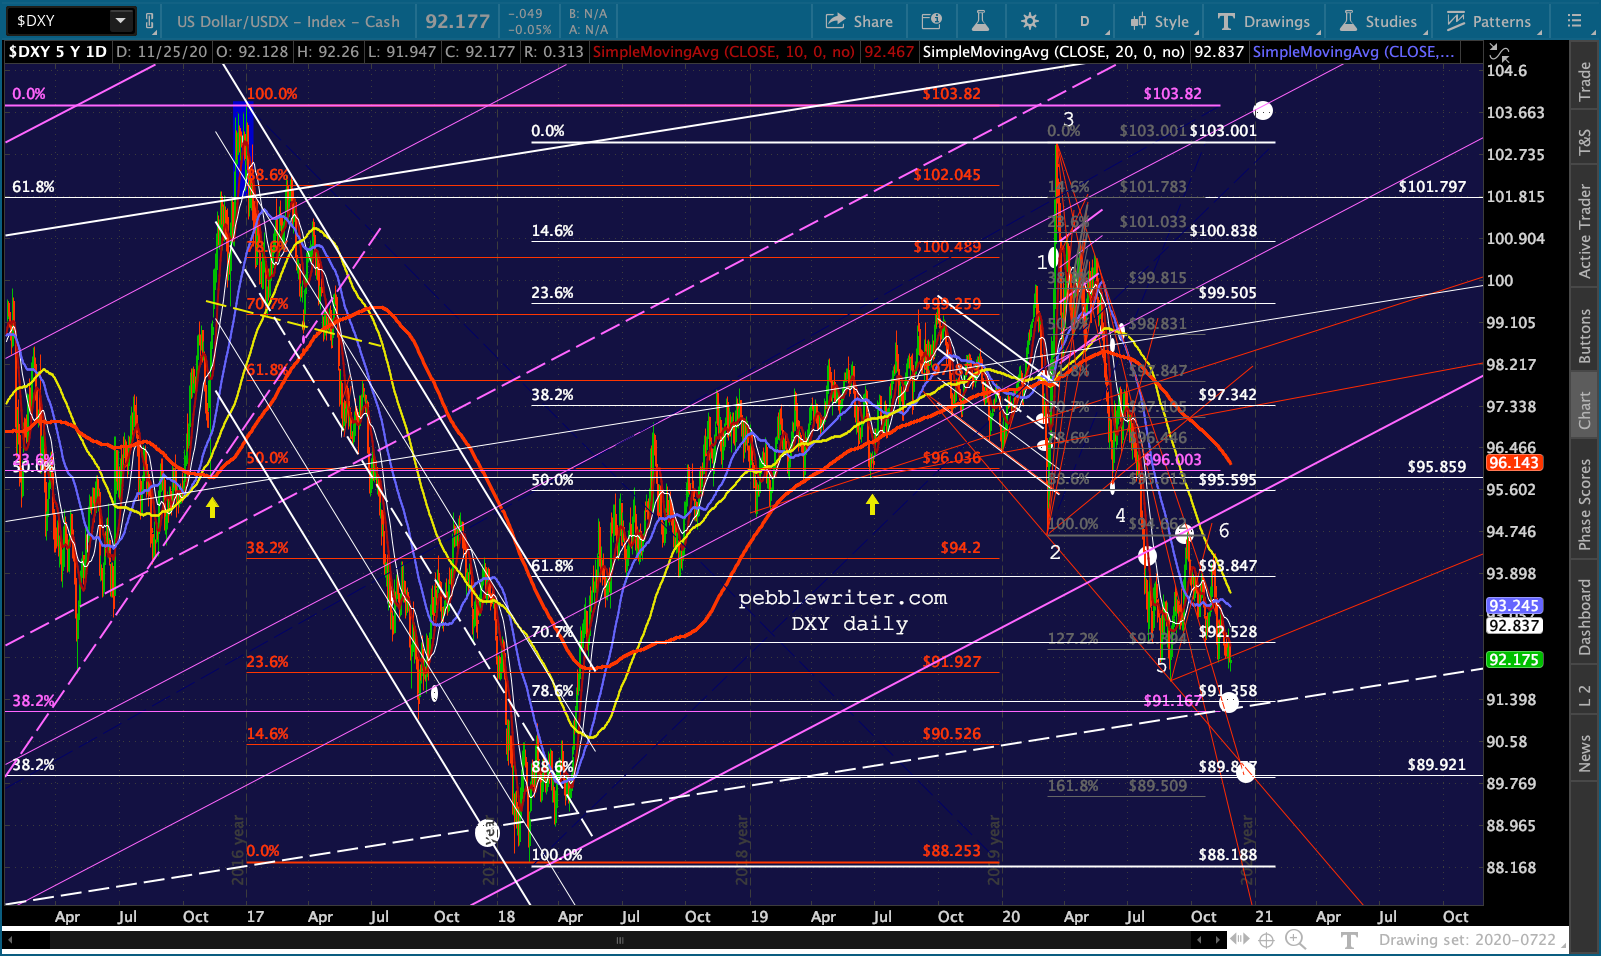
 …but needs some follow-through from USDJPY or EURUSD.

 The 10Y is at another inflection point – higher to tag rising white channel top or backtest the falling purple channel? Fed says higher inflation is okay, suggesting higher rates. But, we just haven’t seen that dynamic yet.
And, given that a breakout in 2s10s would decimate stocks, probably won’t.
 Whichever way it goes, the relationship between ZN and GC remains strong.

 Note that ZN bounced where it needed to exactly at same time GC reached its SMA200.
 TNX seems to have more downside to at least the channel bottom.

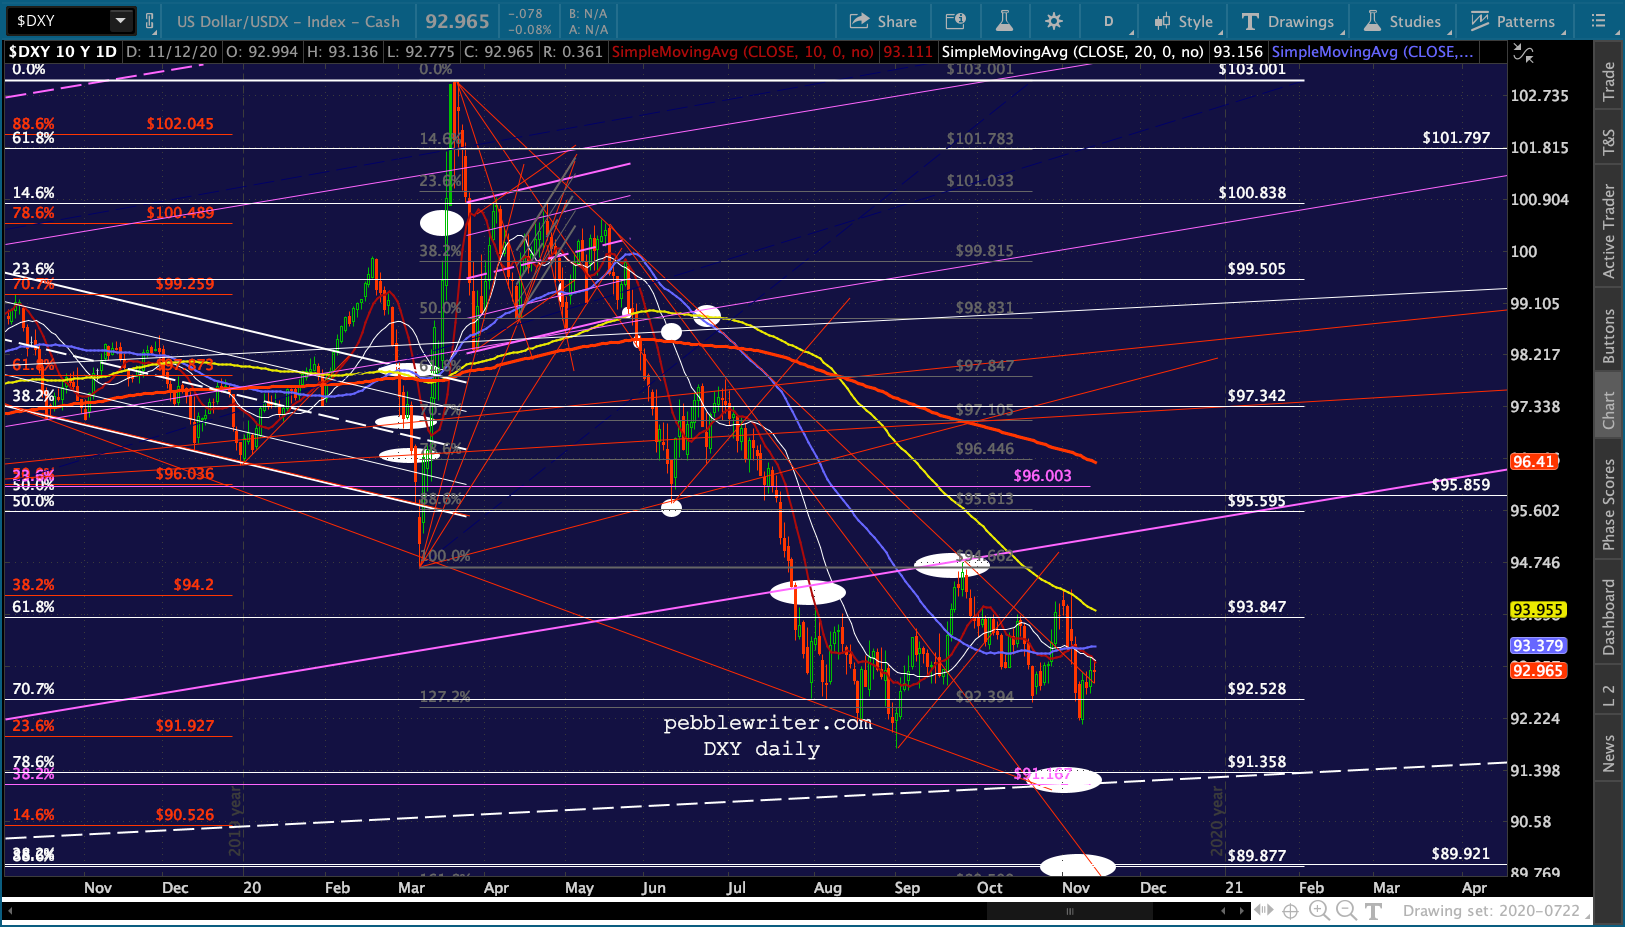
 Long term, the falling yellow channel bottom still has appeal. Note the rising purple channel in DXY and how it broke down and was backtested.
  Seen here on DXY chart…
 GC:
GC:


SI:


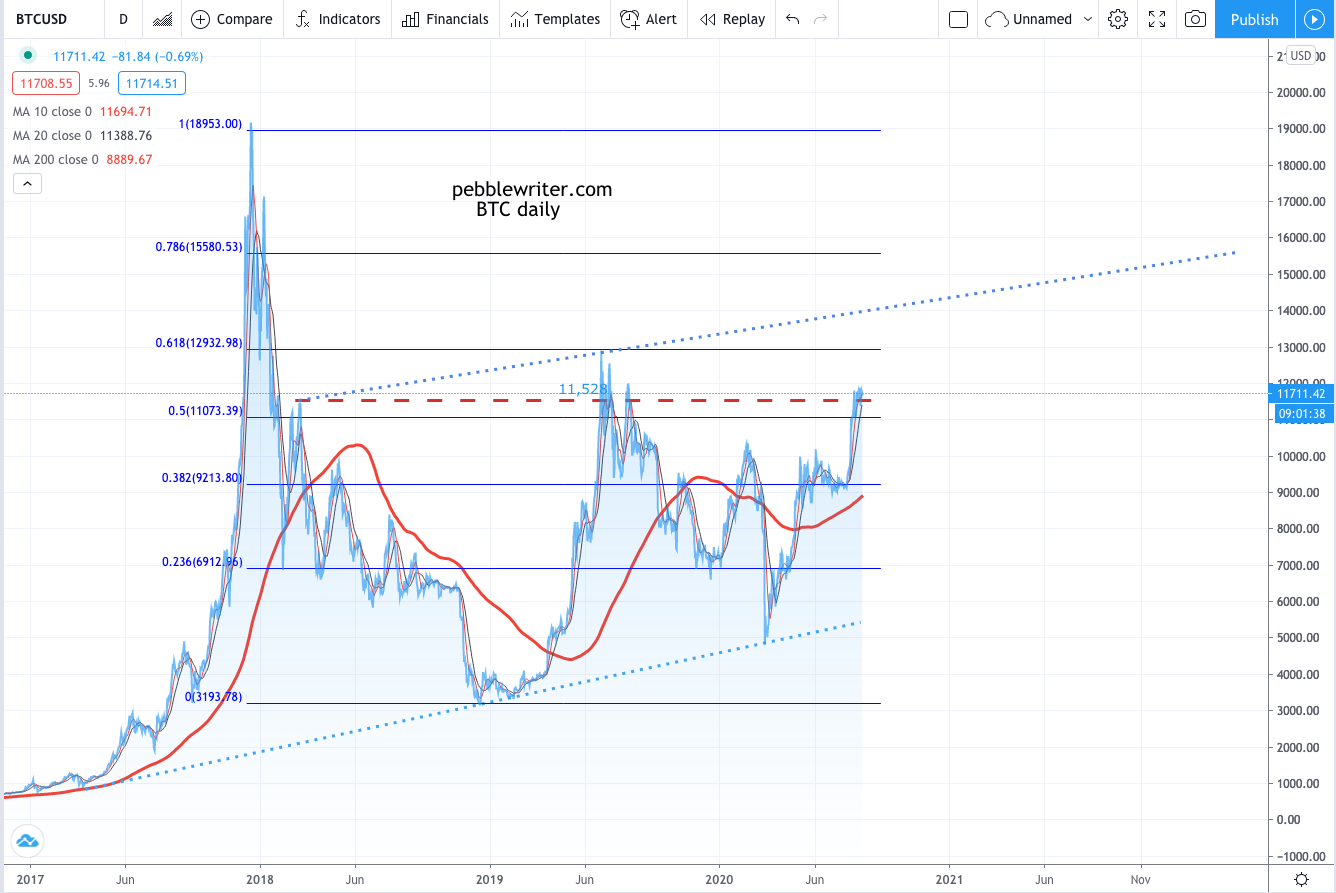
 BTC:
BTC:


 We’re ahead of targets ahead of time. What to do? The SMA10 provides a fairly clear stop.

UPDATE: Nov 20, 2020
CURRENCIES / BONDS


 GC:
GC:


 SI:
SI:


 BTC:
BTC:


UPDATE: Nov 12, 2020
CURRENCIES / BONDS


 GC
GC


SI


BTC


 EXTRA
EXTRA


UPDATE: Nov 6, 2020
BITCOIN
I am quite concerned that BTC had reached the top of two different channels as well as a TL connecting previous RSI highs. It’s not quite to its .786, but feels very vulnerable here.


* * *
UPDATE: Oct 30, 2020
BTC:


UPDATE: Oct 23, 2020
DXY:


 Interesting short idea:


GC:


 SI:
SI:


BTC:


UPDATE: Oct 15, 2020 (from client bulletin)
BITCOIN


* * *
UPDATE: Oct 9, 2020 (from client bulletin)
BITCOIN
It has made it back to the top of the cloud and the falling blue channel – quite promising.


* * *
UPDATE: Oct 2, 2020 (from client bulletin)
BITCOIN
Still needs a breakout, but at least it hasn’t broken down.


* * *
UPDATE: Sep 18, 2020 (from client bulletin)
BITCOIN
Really testing our patience, a failure here means backtesting the SMA200 at 9200ish.


* * *
UPDATE: Sep 11, 2020 (from client bulletin)
BITCOIN
Hanging in there…

* * *
UPDATE: Sep 8, 2020 (from client bulletin)
BTC has slightly overshot TL support and a backtest of the neckline. But is holding at the channel midline and 10,000 round number. The SMA200 is approaching. I’d give it the benefit of the doubt.


* * *
UPDATE: Sep 3, 2020 (from client bulletin)
BITCOIN
BTC is backtesting, currently reaching the minimal level at which a backtest could be considered complete (the black TL below.)
It still has potential to the neckline, very close to the SMA100 at around 10250. Note that the midline of the light blue channel (shaded below) is just below this level.
 A closeup:
 It seems fairly likely that if one breaks down, the other will too. For BTC, the next best support remains the SMA200. But, for now, the rising wedge is intact.
  The headlines certainly support additional upside for GC, SI and BTC.


UPDATE: Aug 28, 2020 (from client bulletin)
BITCOIN
A backtest of the completed IH&S looks likely, then onward and upward.


* * *
UPDATE: Aug 20, 2020 (from client bulletin)
BITCOIN
Not much in the way of changes…


* * *
UPDATE: Aug 14, 2020 (from client bulletin)
BITCOIN
Note that the Fibs are slightly different as I switched to candles which incorporate the daily highs and lows rather than the line drawing which reflects only the closing price.


* * *
UPDATE: Aug 7, 2020 (from client bulletin)
BITCOIN
Bumping up against that horizontal resistance…needs to push through or it’s back to the SMA200.
 The daily chart…


* * *
UPDATE: Jul 31, 2020 (from client bulletin)
BITCOIN
The most important elements of the BTC chart are the horizontal resistance and the Bollinger Band coming up at 11,528ish. We recently had a bullish SMA10/20 cross. Neither has provided good downside protection in the past, though the SMA200 has. Unfortunately, it’s way down at 6263.
 If BTC can push through the horizontal resistance, the next upside targets are 12,933, 15,580 and 17,156.
* * *
May 28, 2020: Update on Bitcoin
I’ve only posted about BTC once before, back on Mar 23 in response to a member request [see: FOMC Embraces MMT.] The Dow was about to test its 2016 election day lows and, not coincidentally, the Fed had just unleashed QEinfinity.
The post went as follows:
Two major chart patterns jump out at me: first, the obvious triangle pattern on the weekly arithmetic chart (it isn’t there on the log chart) suggests BTC should bounce from here and return to the top trend line (which failed, BTW, to hold a recent tiny breakout.) It currently stands around 9,925.
Second, the daily log chart shows a TL was broken last week but BTC has since rebounded back above it. For those wondering, the retracement of the rise from the Dec 2018 lows to the Jun 2019 highs reached about 81%. Had the TL held, we’d be looking at a Fibonacci 78%.
If you believe that BTC will necessarily rise (as gold will) as QE explodes, the charts support a continuing bounce. If you believe the FOMC will do whatever it takes to support the USD and crush surrogates such as BTC and GC, then keep an eye on that TL (5,000ish) as a fairly clear stop level.
Having spent a few hours studying Bitcoin, I promptly forgot about it. I don’t really follow it, and believe it’s at least as heavily manipulated as everything else. Probably more. But, thanks to member John K., I was encouraged to take another look.
As it turned out, BTC did continue its bounce and went on to test the top trend line, reaching 9917.25 on May 8. It was an impressive 100% move from the March lows.
Of course, now it’s back at overhead resistance – the same trend line from December 2017 which halted the 2017 and 2019 rallies. We’ll take a look at the potential for a reversal or a breakout.
continued for members…
As before, it matters whether you’re looking at a log chart or an arithmetic chart. The arith chart below shows BTC bouncing off a great little trend line from the March lows.
 If we chart it in log terms, several TLs have broken down (though BTC has subsequently moved higher each time.)
  BTC has clearly failed to break out above the TLs from both the 2017 and the 2018 highs. The level of QE thrown at the markets certainly argues for a breakout. But, central banks have a vested interest in keeping currency alternatives from gaining too much prominence. When a county’s currency breaks down, the game is over.
 The BLX chart below underscored the importance of the recent highs – very nearly nailing the .618 Fib of the drop between July and March.
 Is BTC a buy here on a potential breakout? Maybe. But, given the fact that it’s barely off its April highs, cautious types might want to wait for an actual breakout. If it occurs, there would be a small opportunity loss from not getting in here. But better to give up a few percent than lock in a trade with a lot more downside.
The alternative for more nimble types: go long but watch that rising TL from Mar 16 on the arith chart like a hawk. If BTC drops below it, run for the hills.
GLTA.
Mar 23, 2020: FOMC Embraces MMT
I had a request for a Bitcoin chart which I will take a stab at. First, some disclaimers: I don’t follow BTC; I suspect BTC is heavily manipulated; and, I wouldn’t put more than a small, speculative percentage of my investments in BTC. With that said, I’m sure some of you would be interested in what the charts indicate.
Two major chart patterns jump out at me: first, the obvious triangle pattern on the weekly arithmetic chart (it isn’t there on the log chart) suggests BTC should bounce from here and return to the top trend line (which failed, BTW, to hold a recent tiny breakout.) It currently stands around 9,925.
Second, the daily log chart shows a TL was broken last week but BTC has since rebounded back above it. For those wondering, the retracement of the rise from the Dec 2018 lows to the Jun 2019 highs reached about 81%. Had the TL held, we’d be looking at a Fibonacci 78%.
If you believe that BTC will necessarily rise (as gold will) as QE explodes, the charts support a continuing bounce. If you believe the FOMC will do whatever it takes to support the USD and crush surrogates such as BTC and GC, then keep an eye on that TL (5,000ish) as a fairly clear stop level.