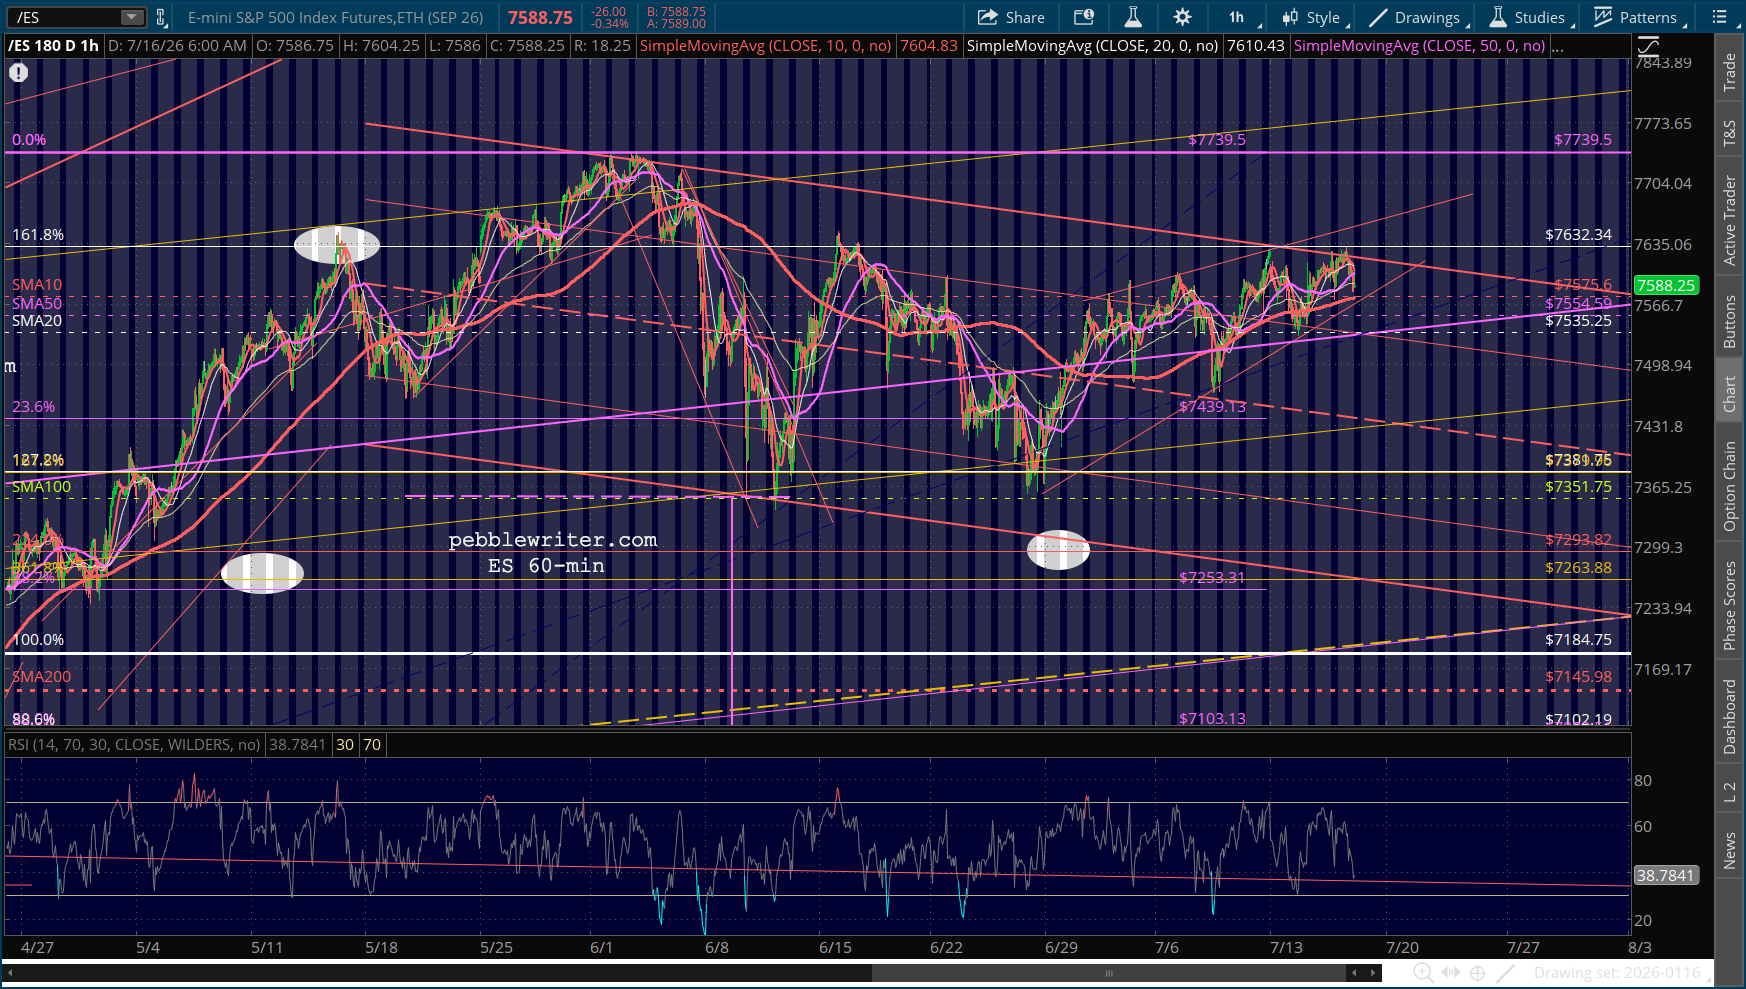
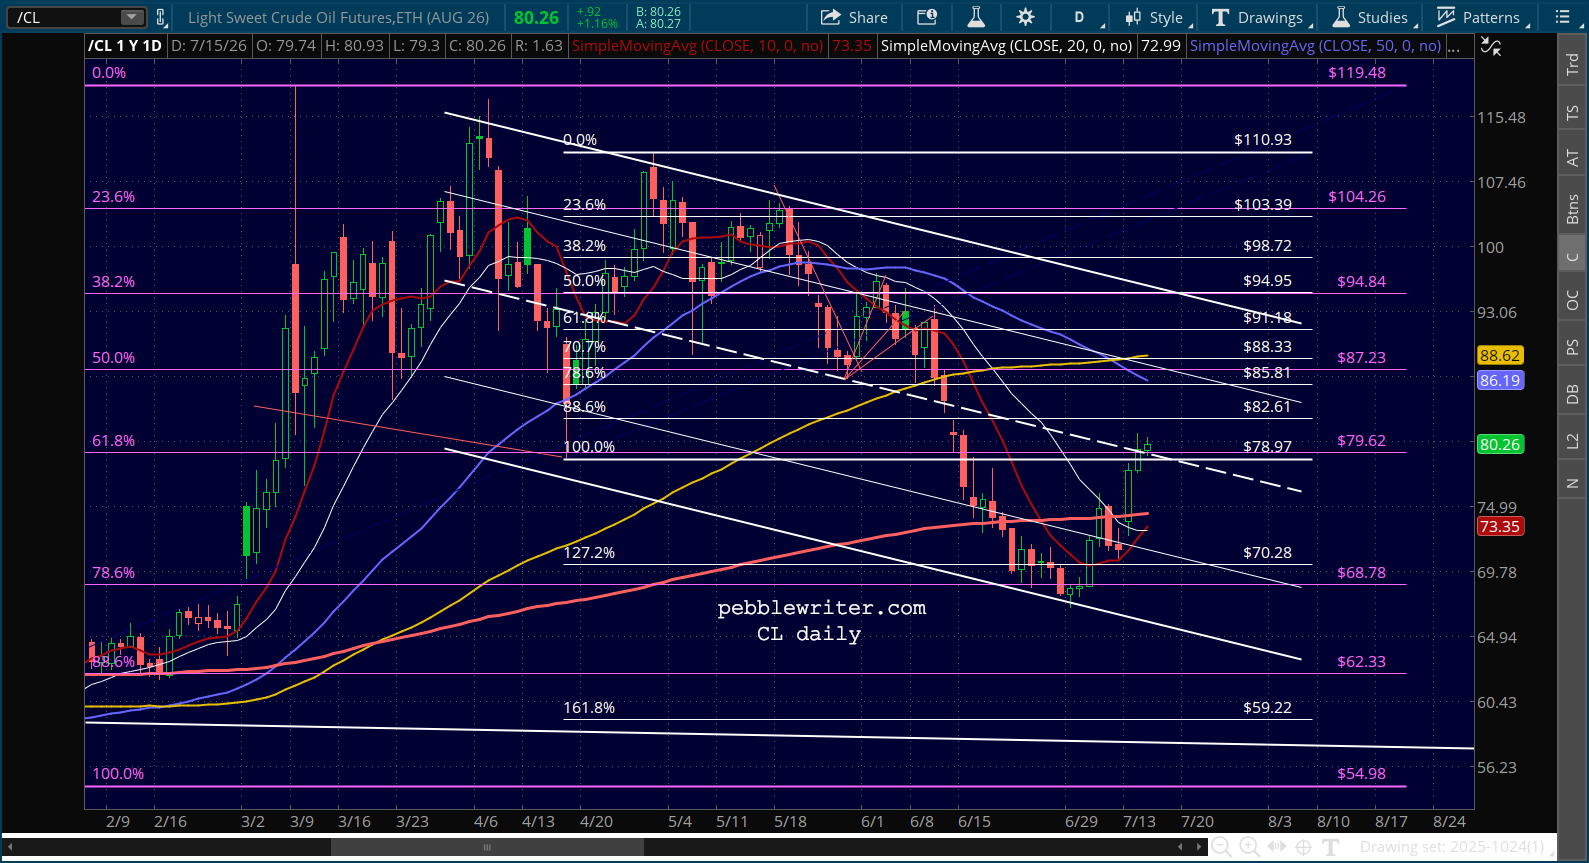
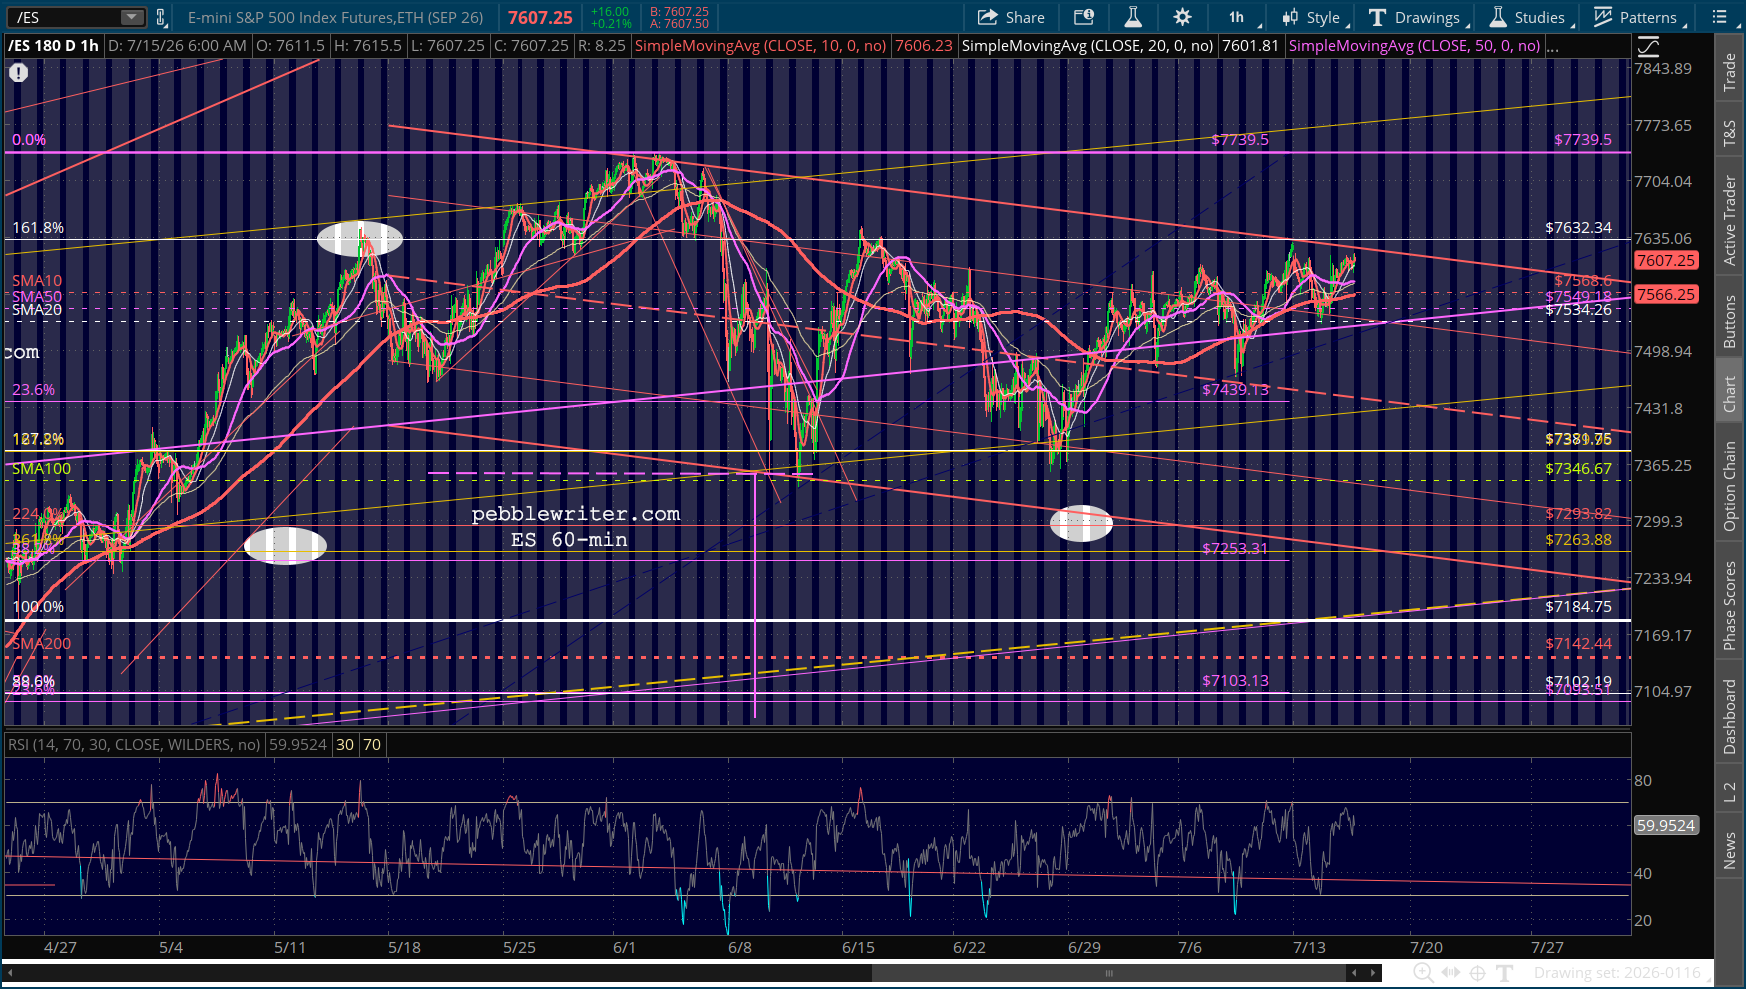
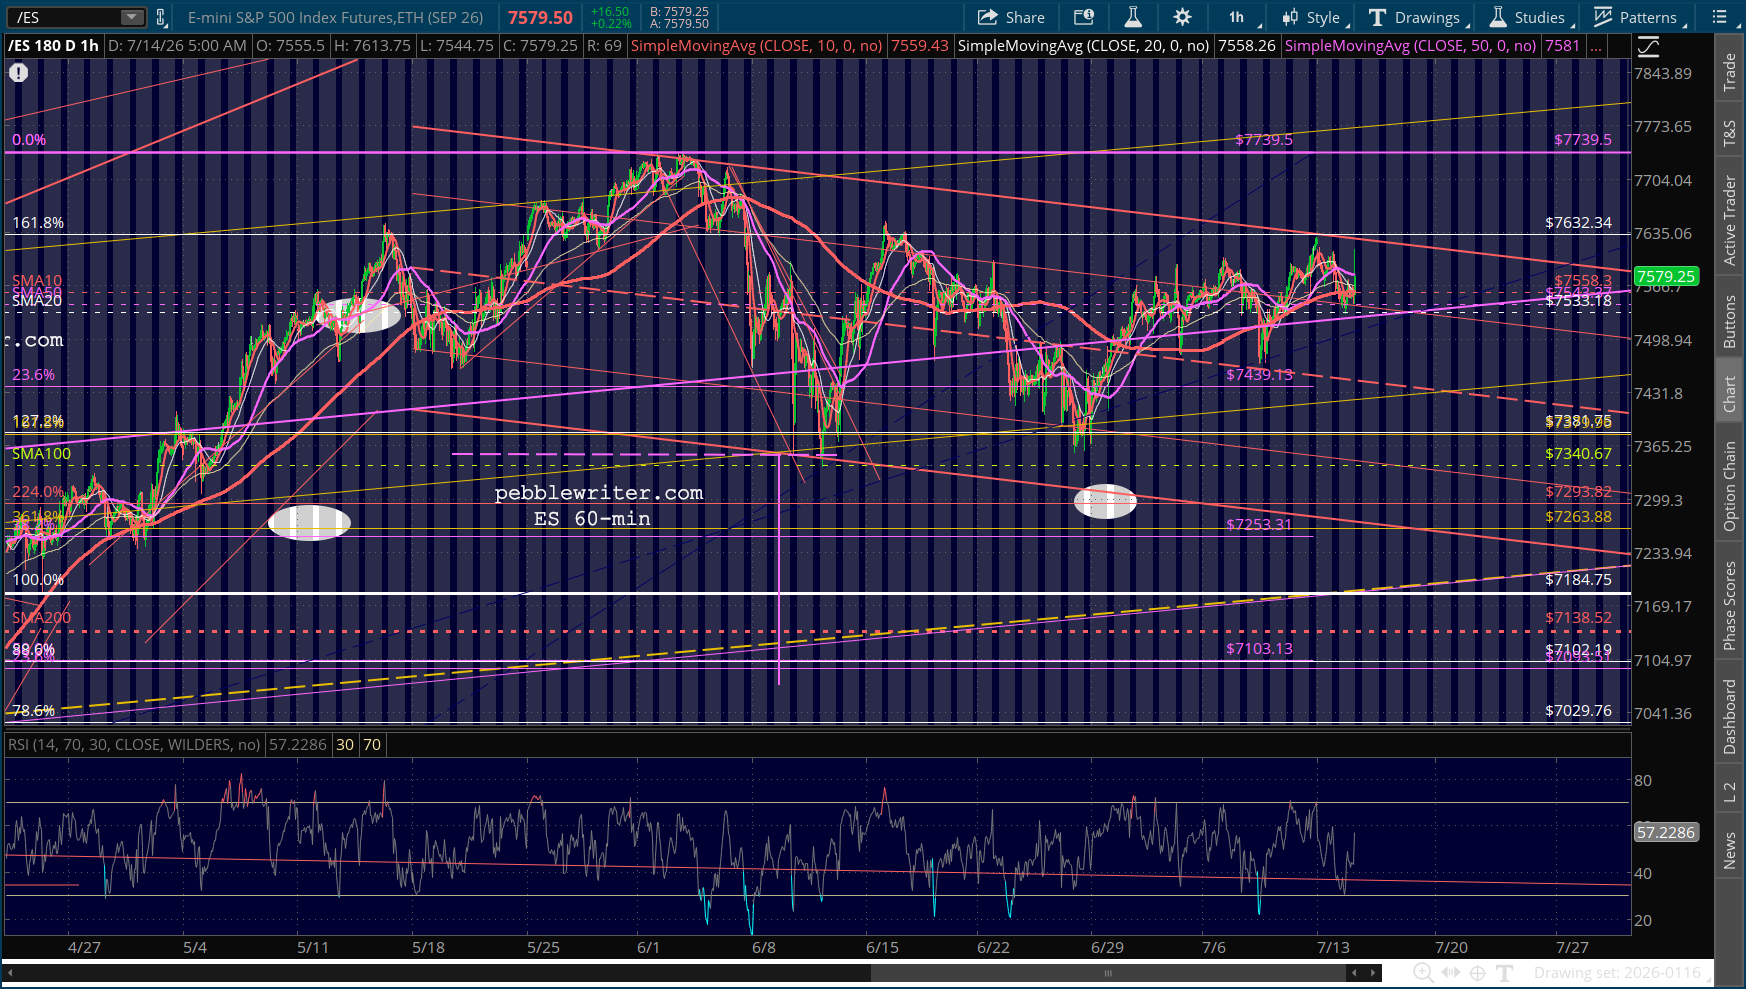
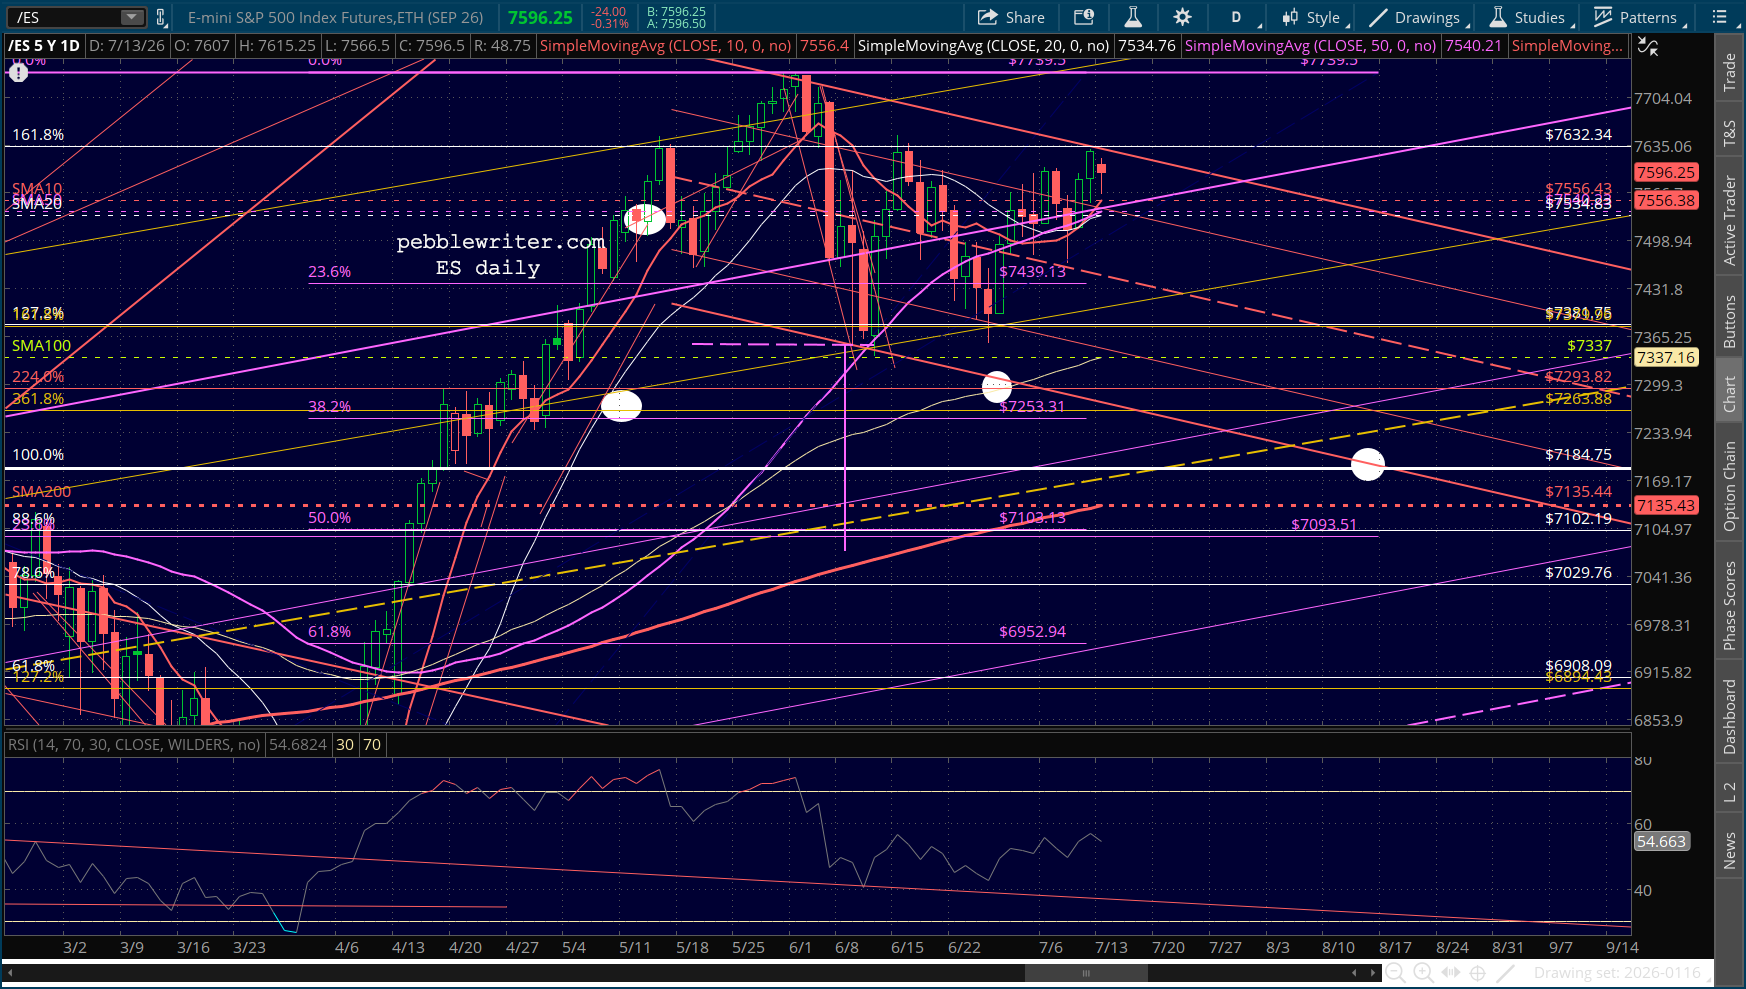
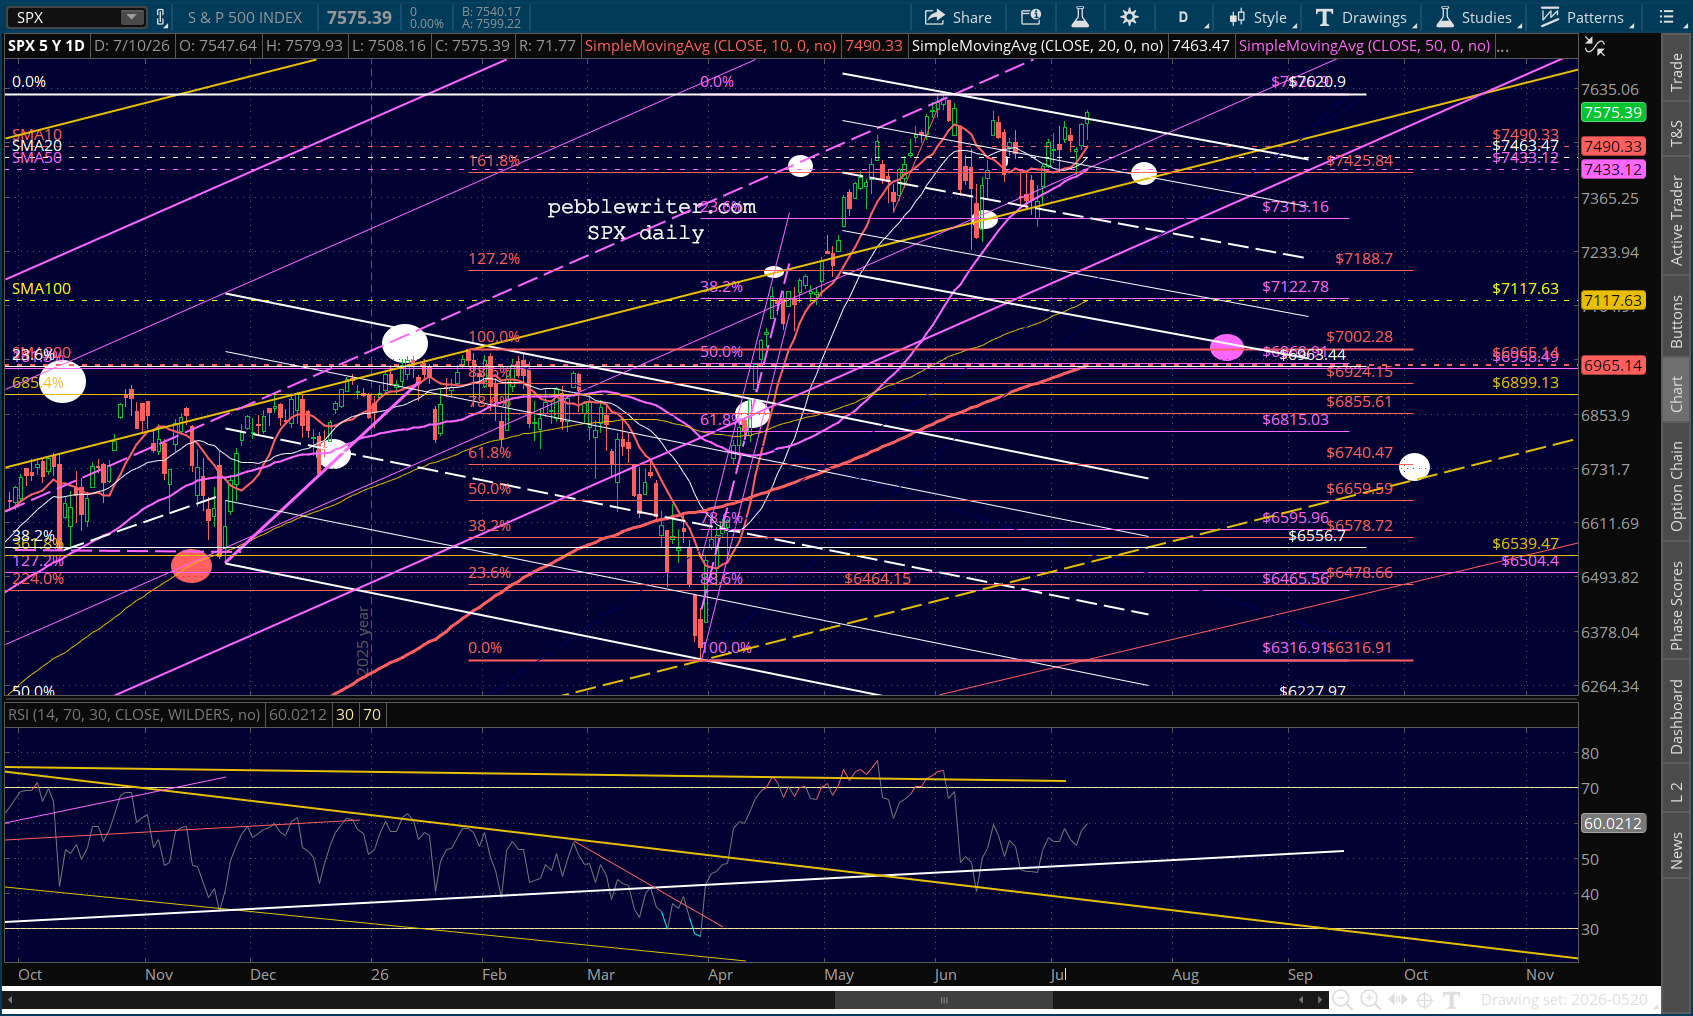
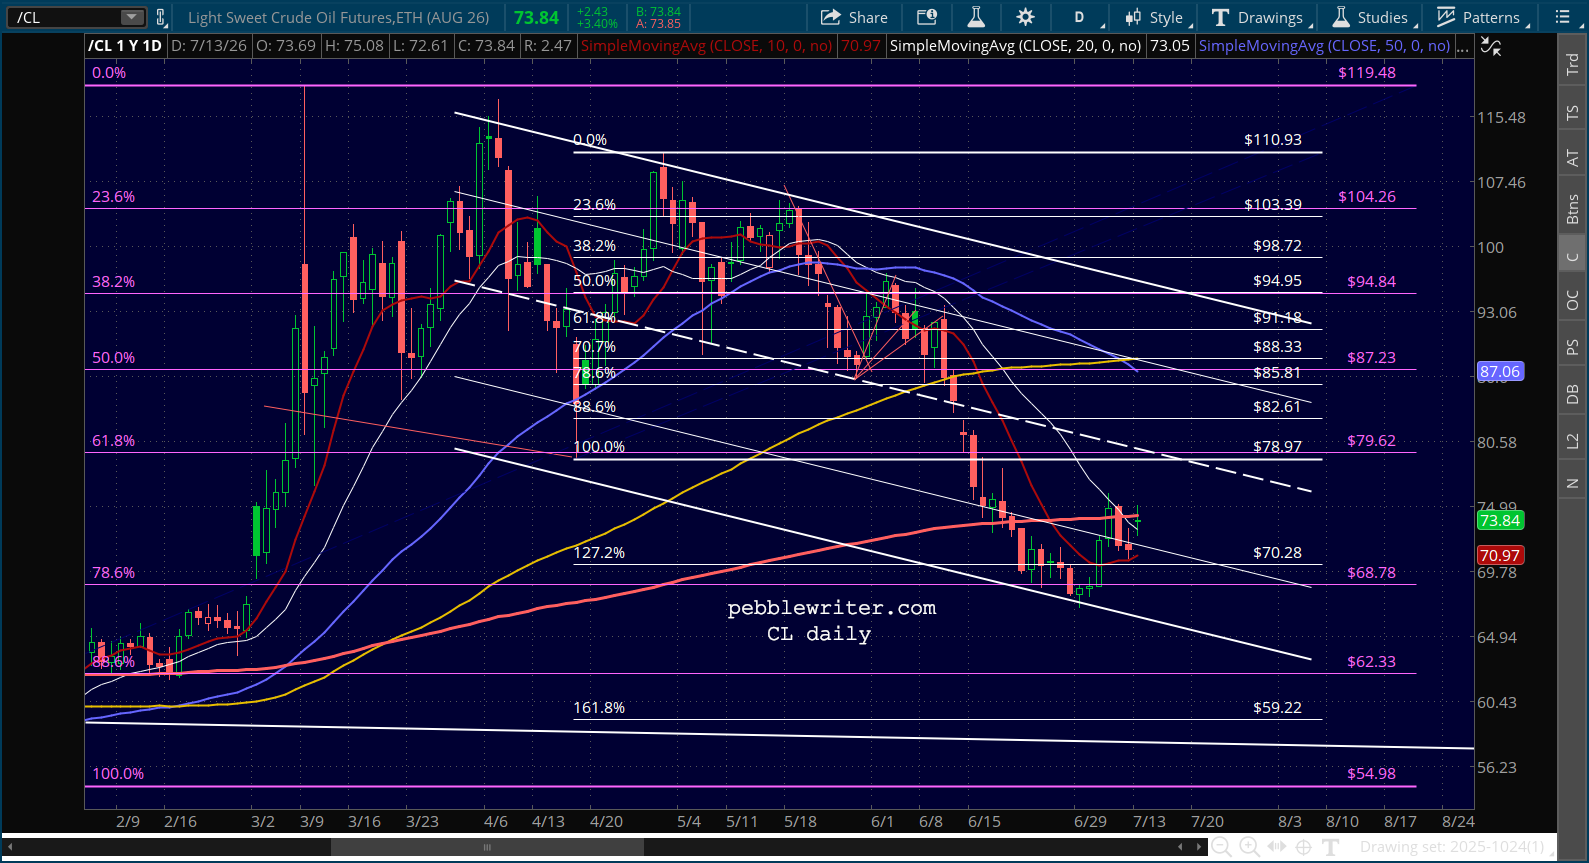
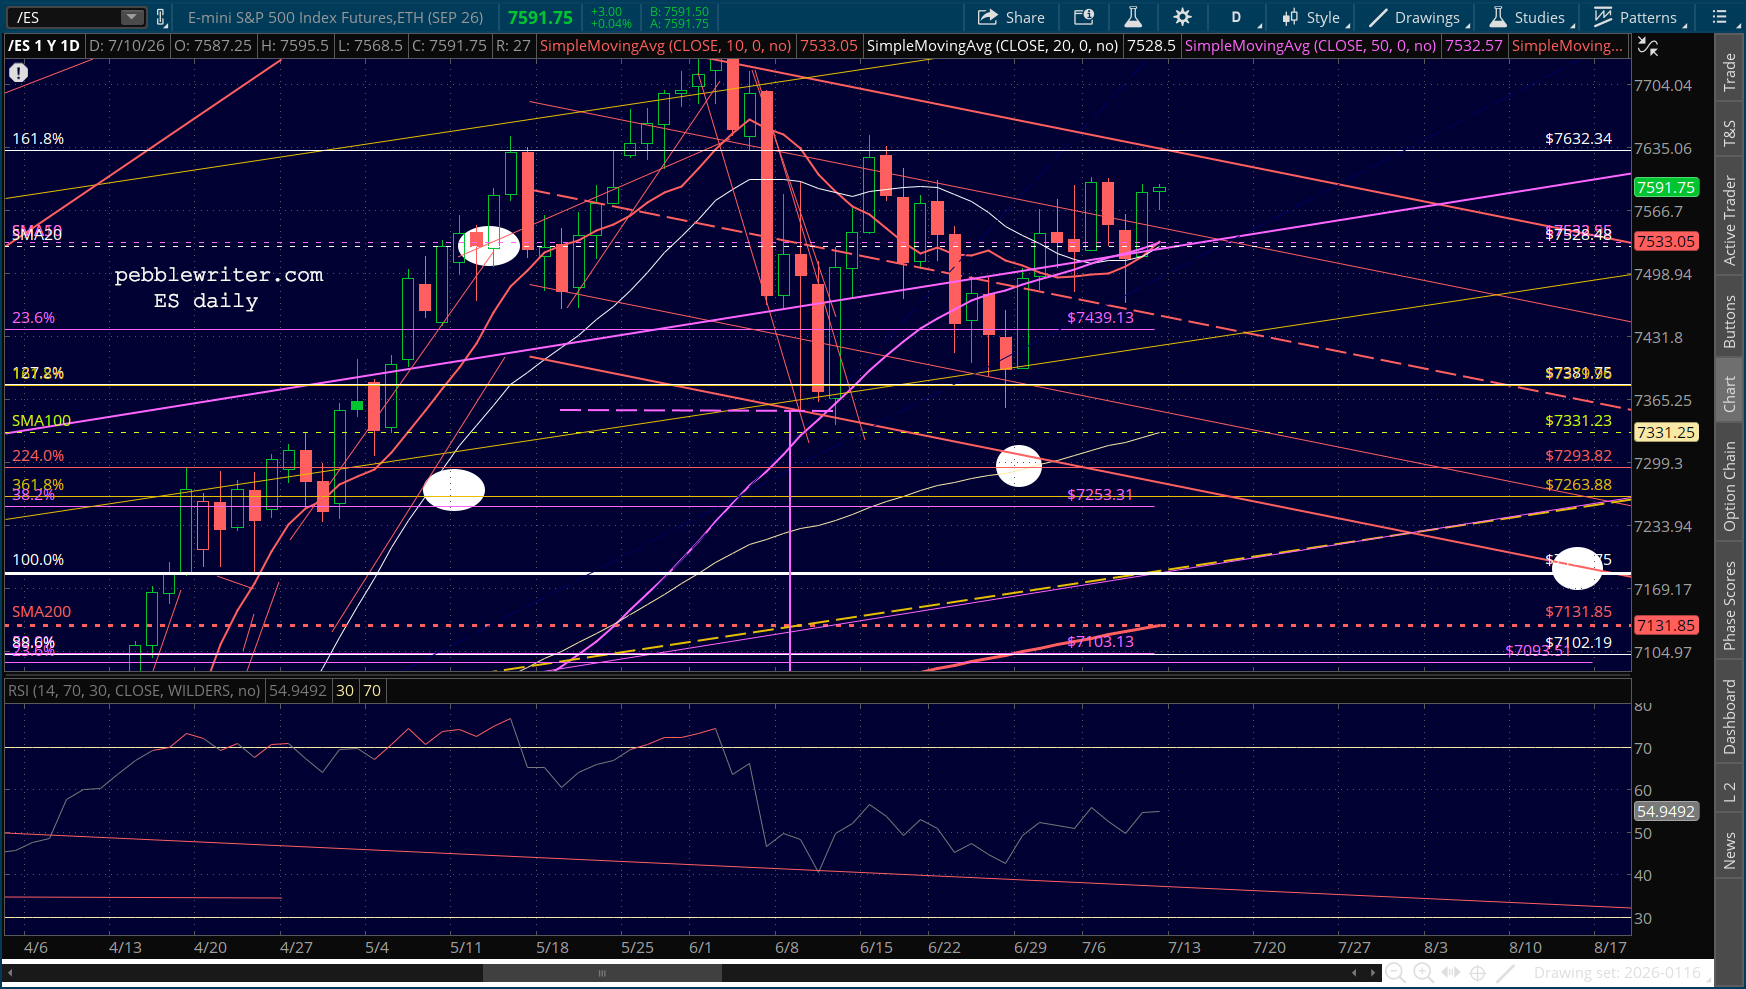
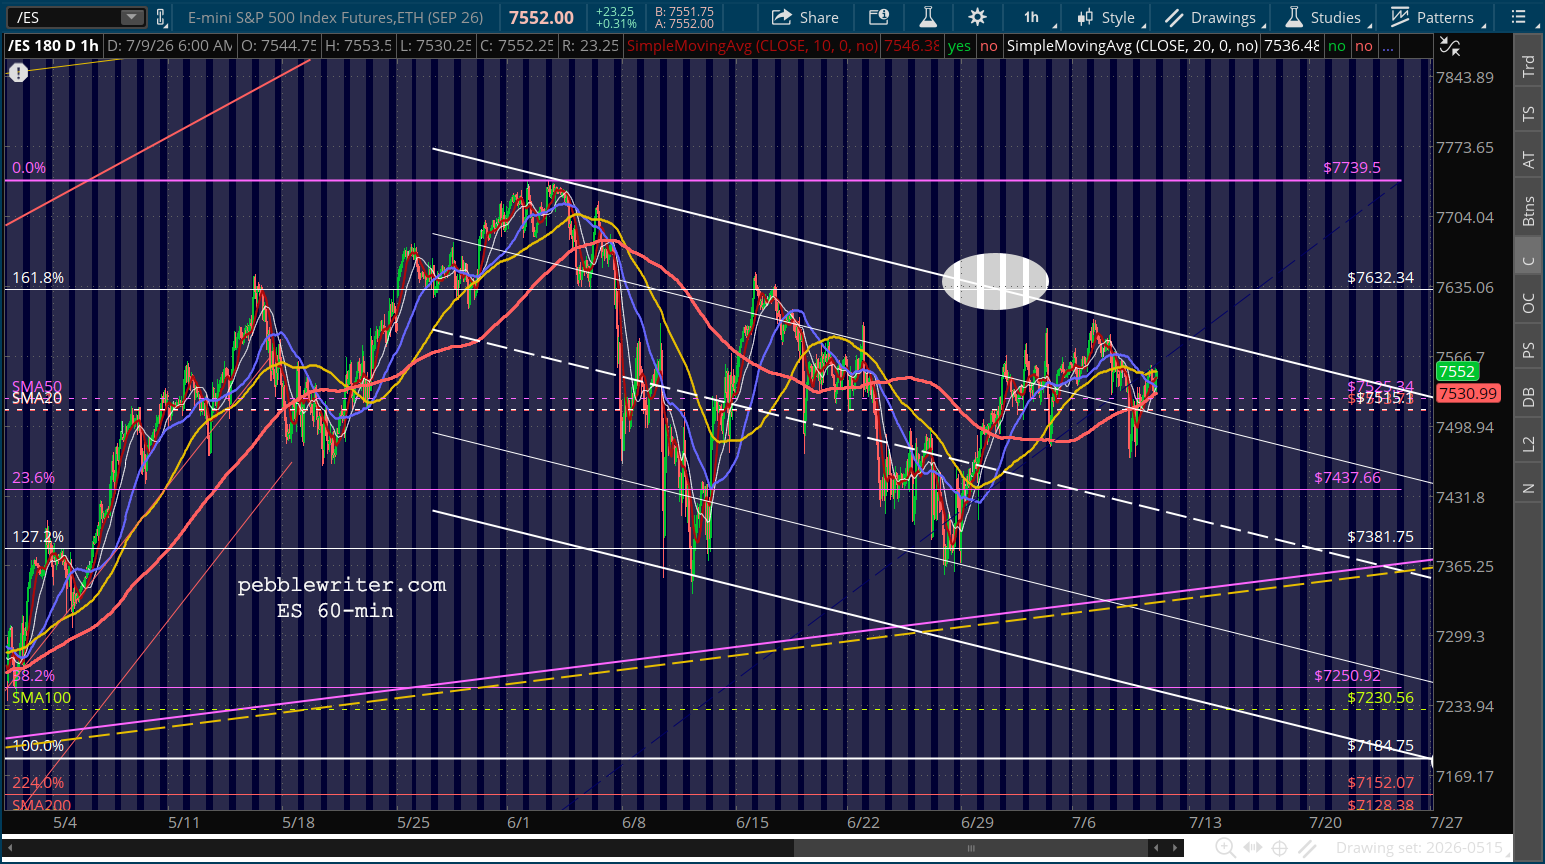
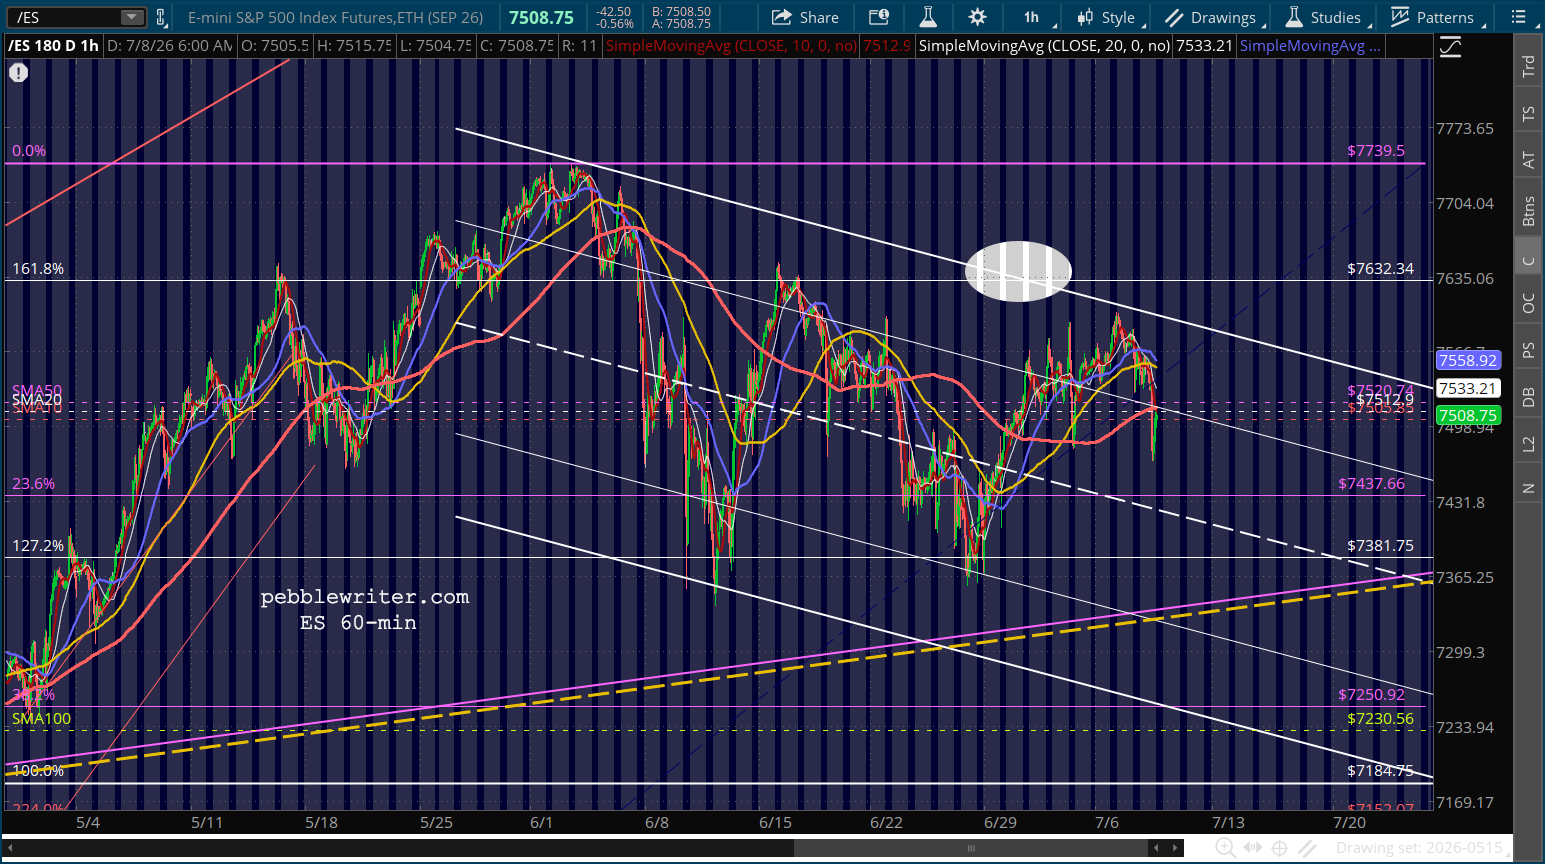
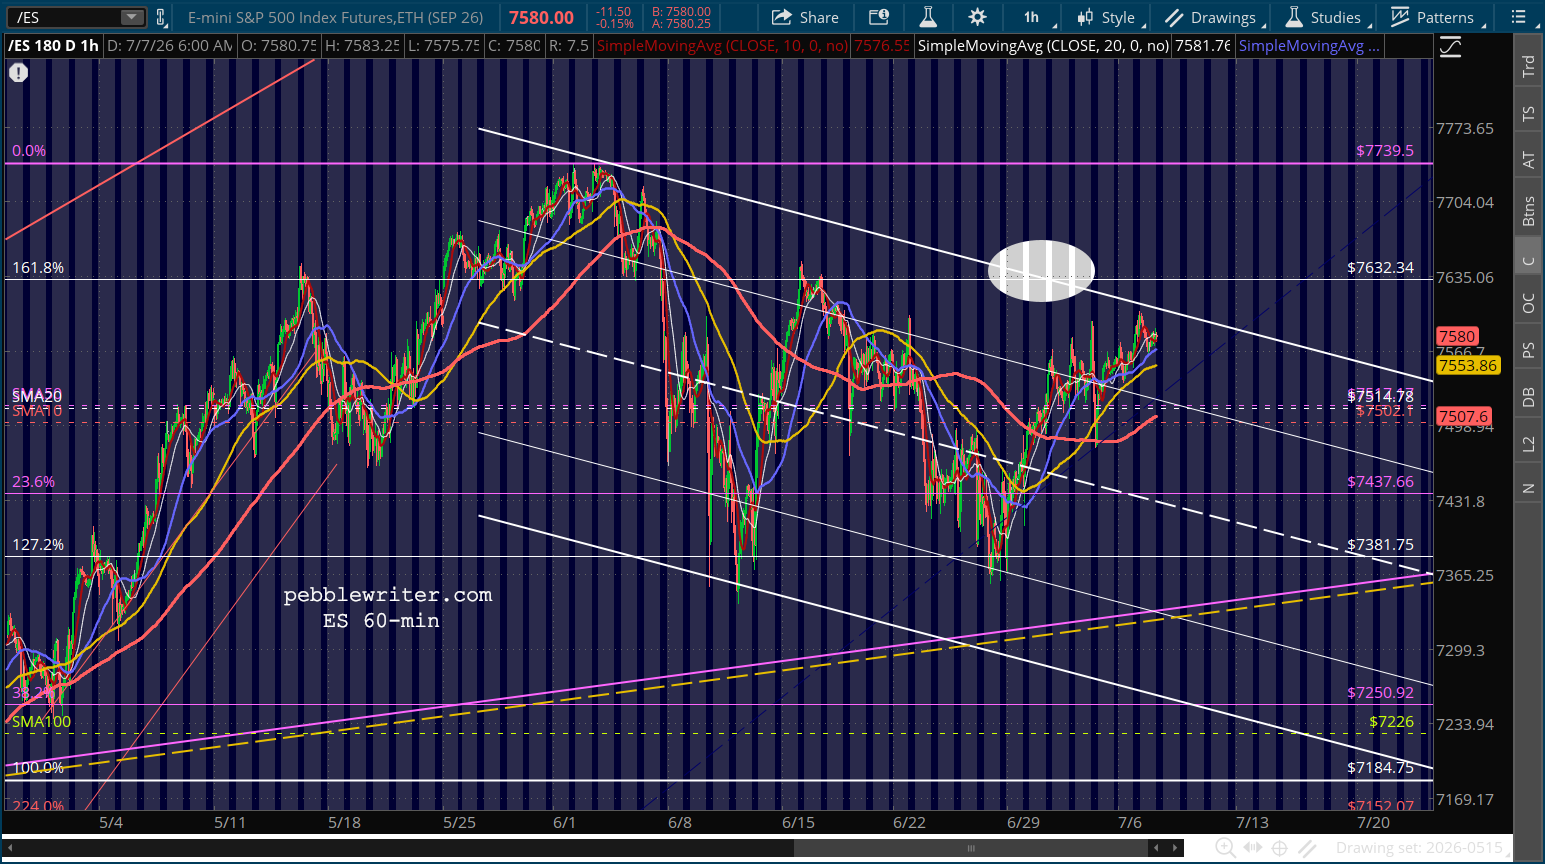
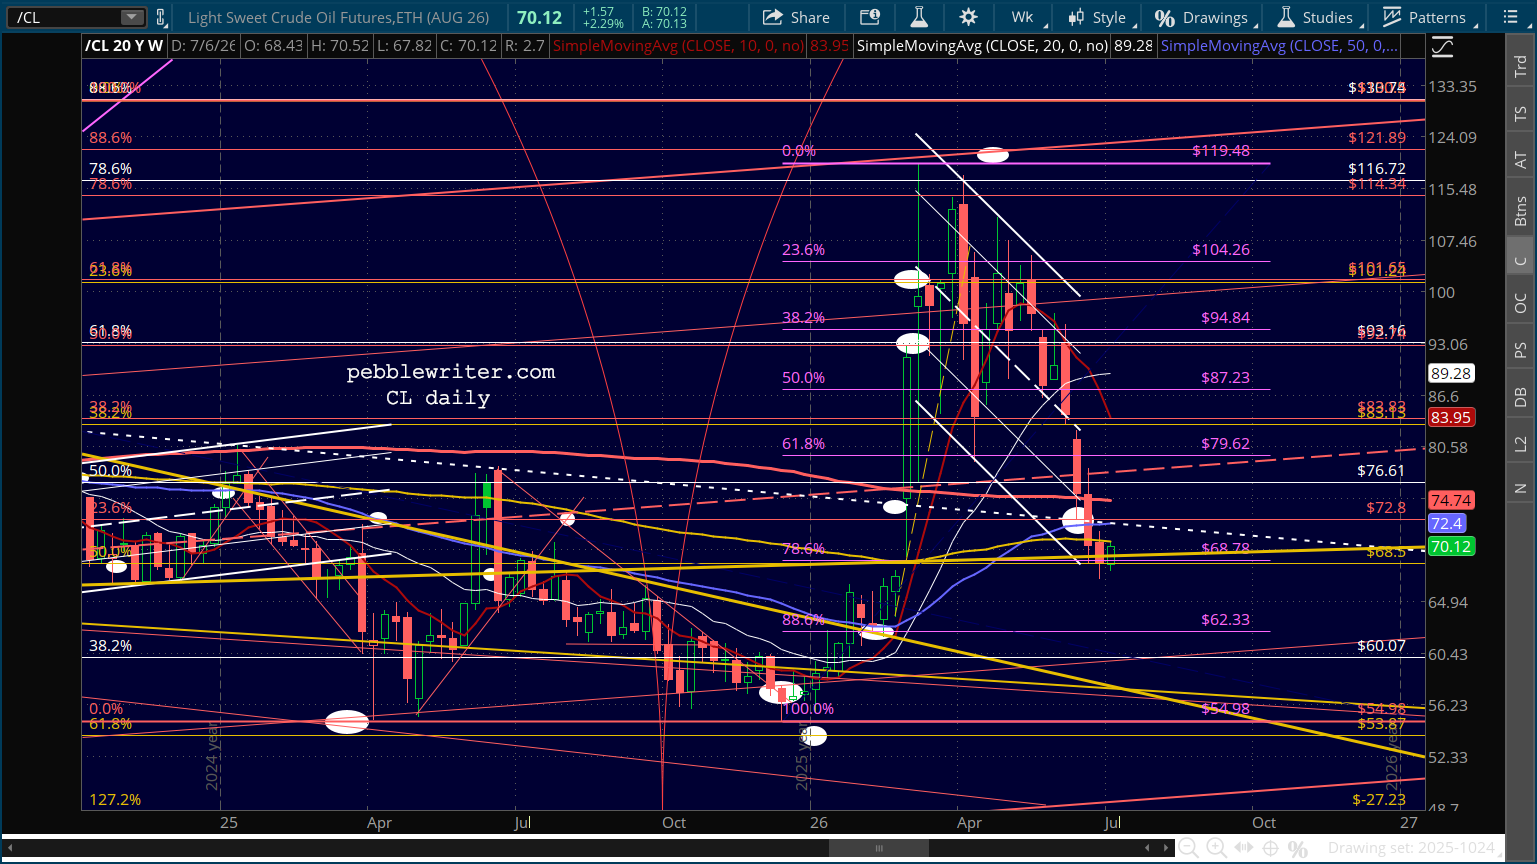
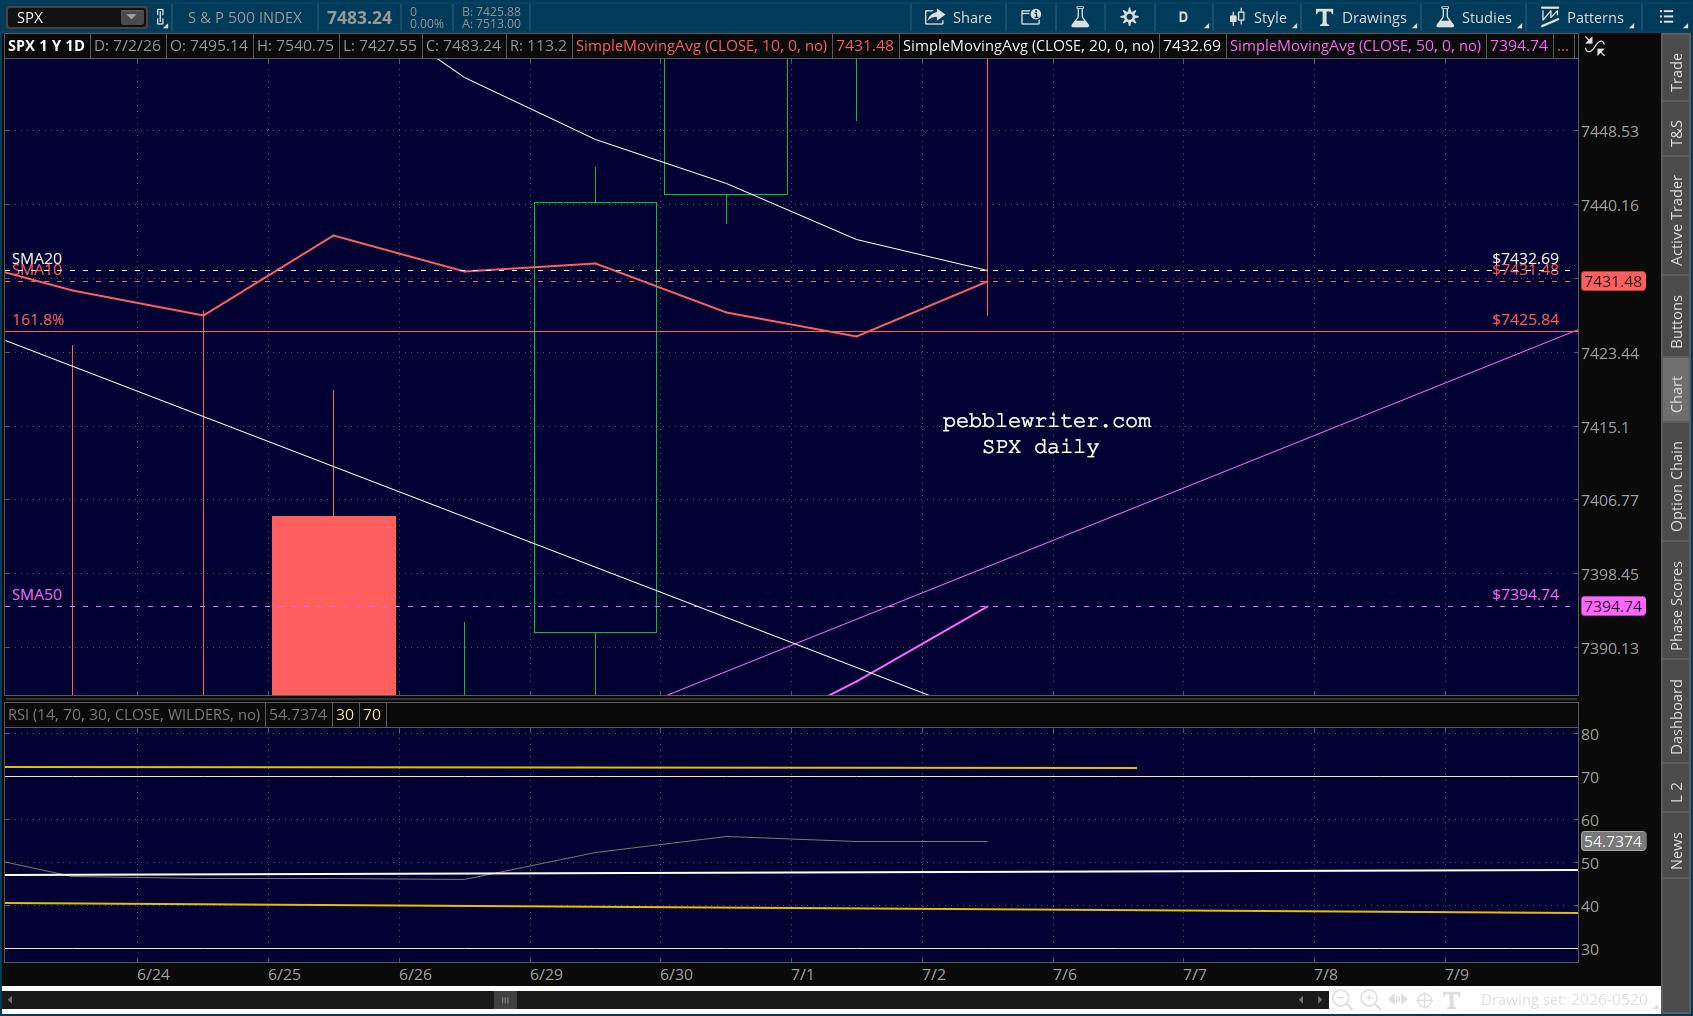
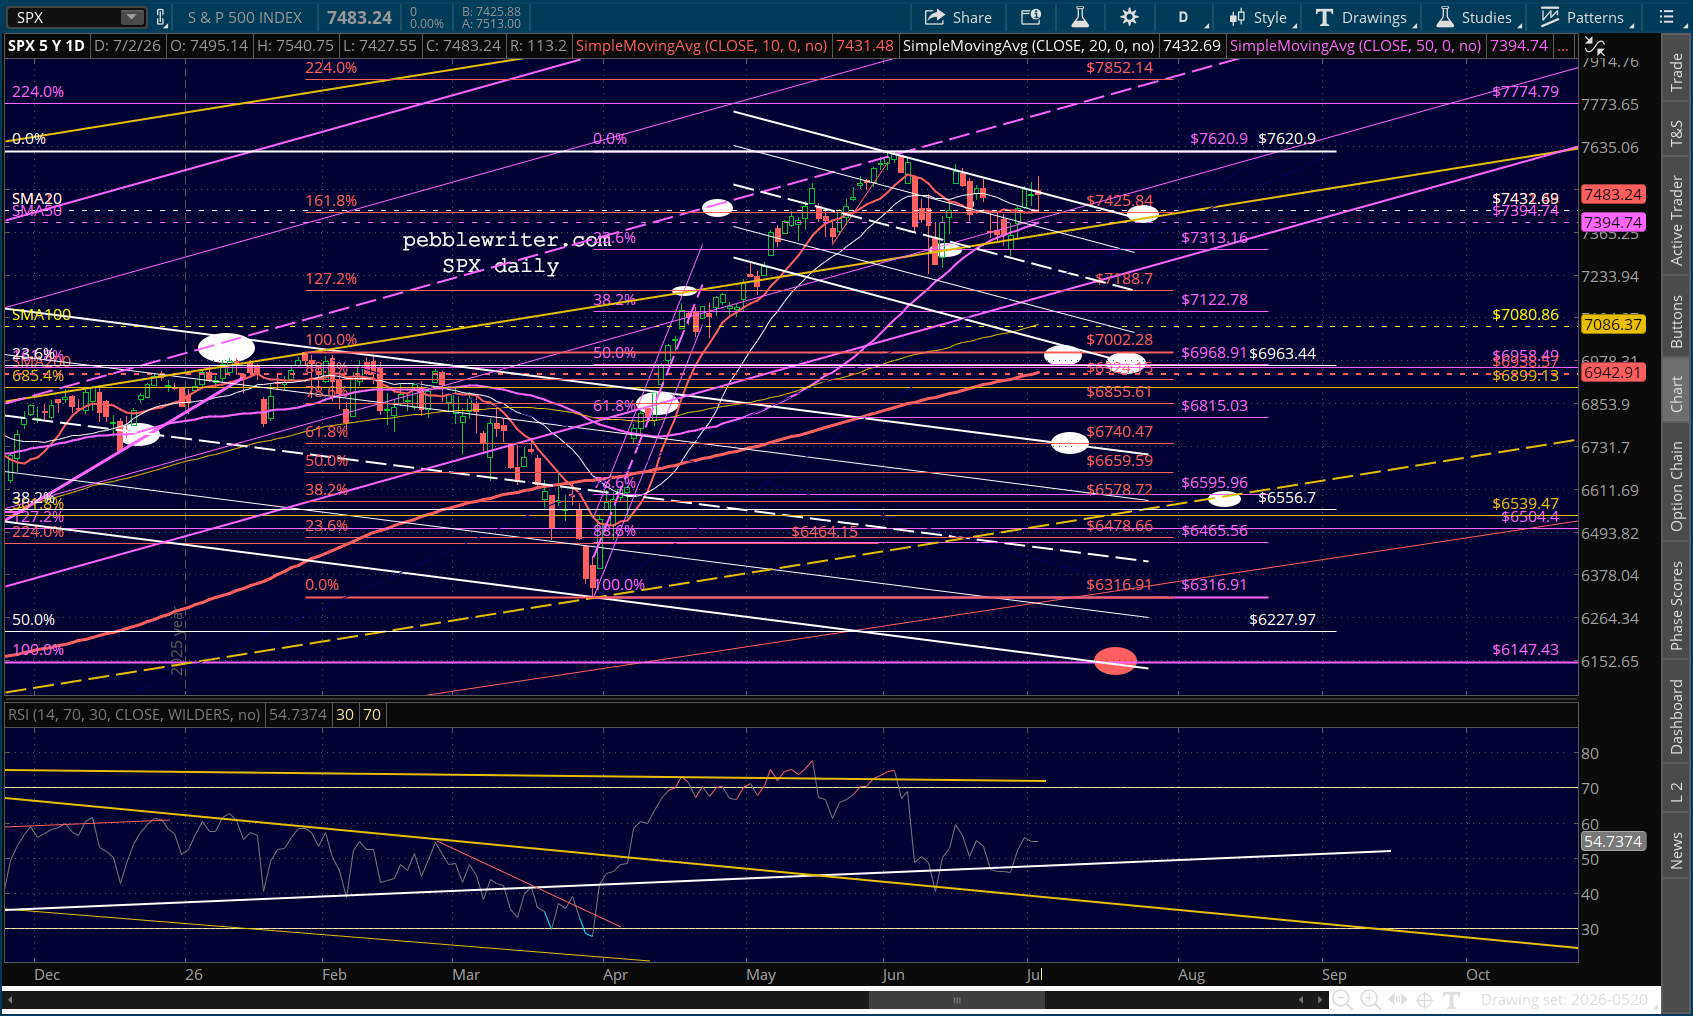
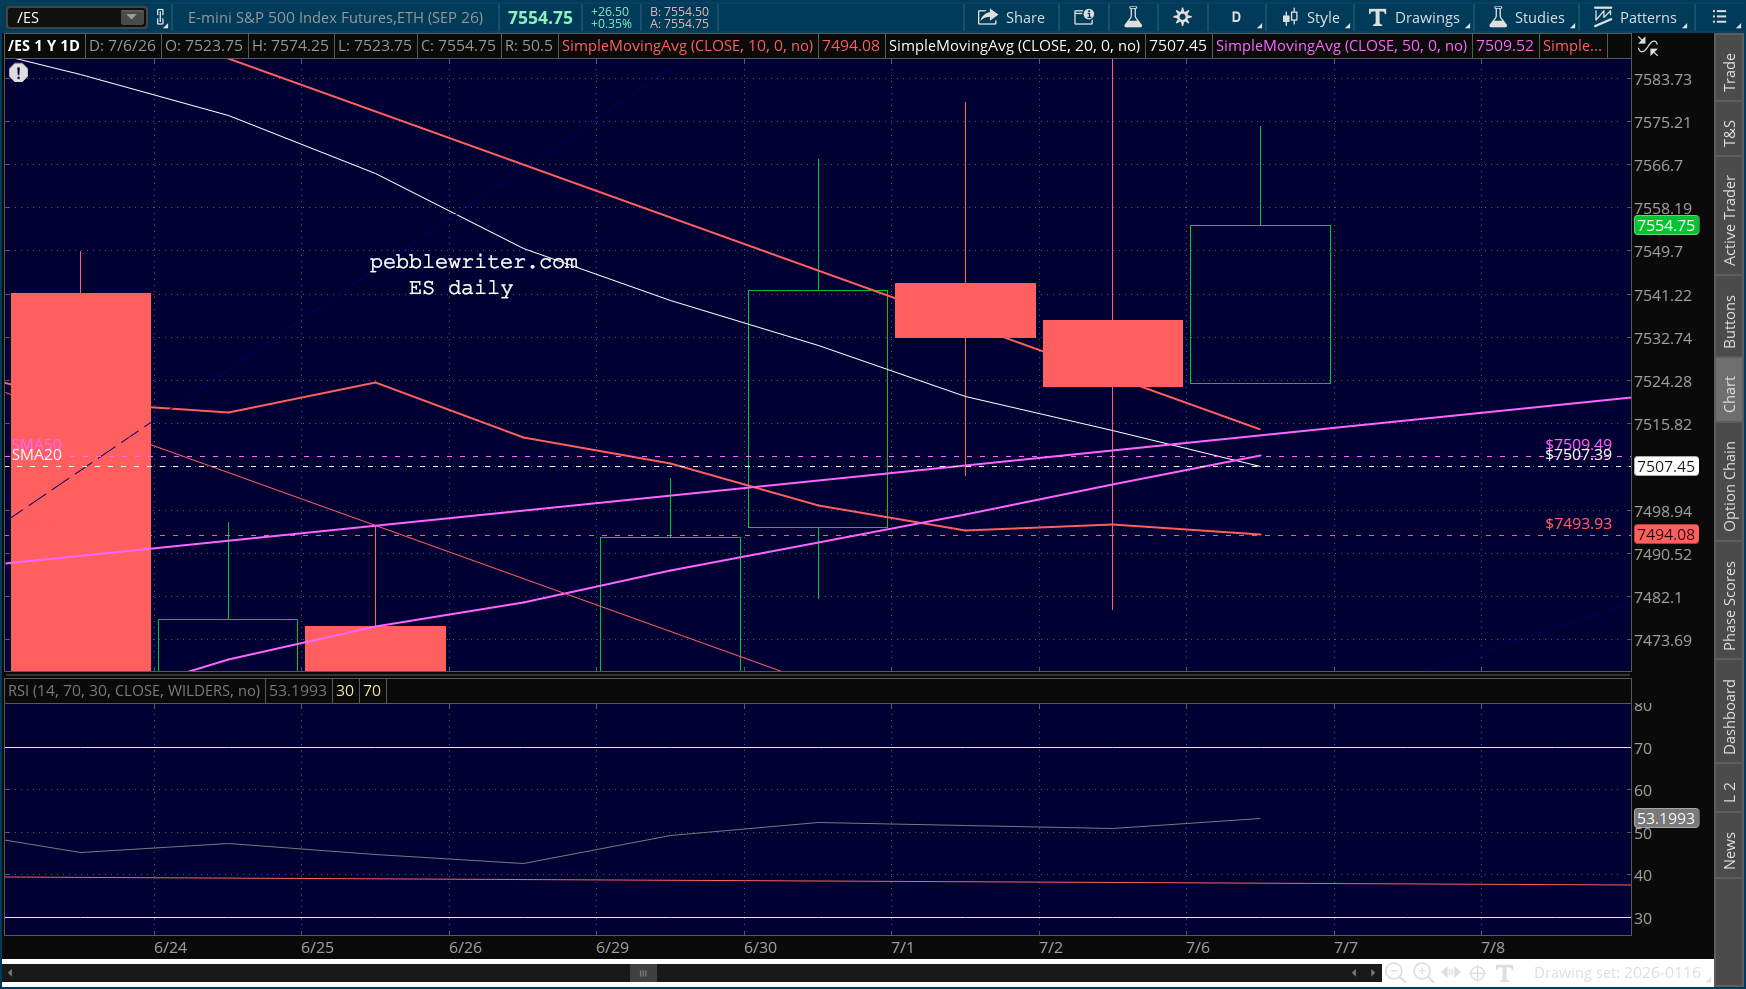
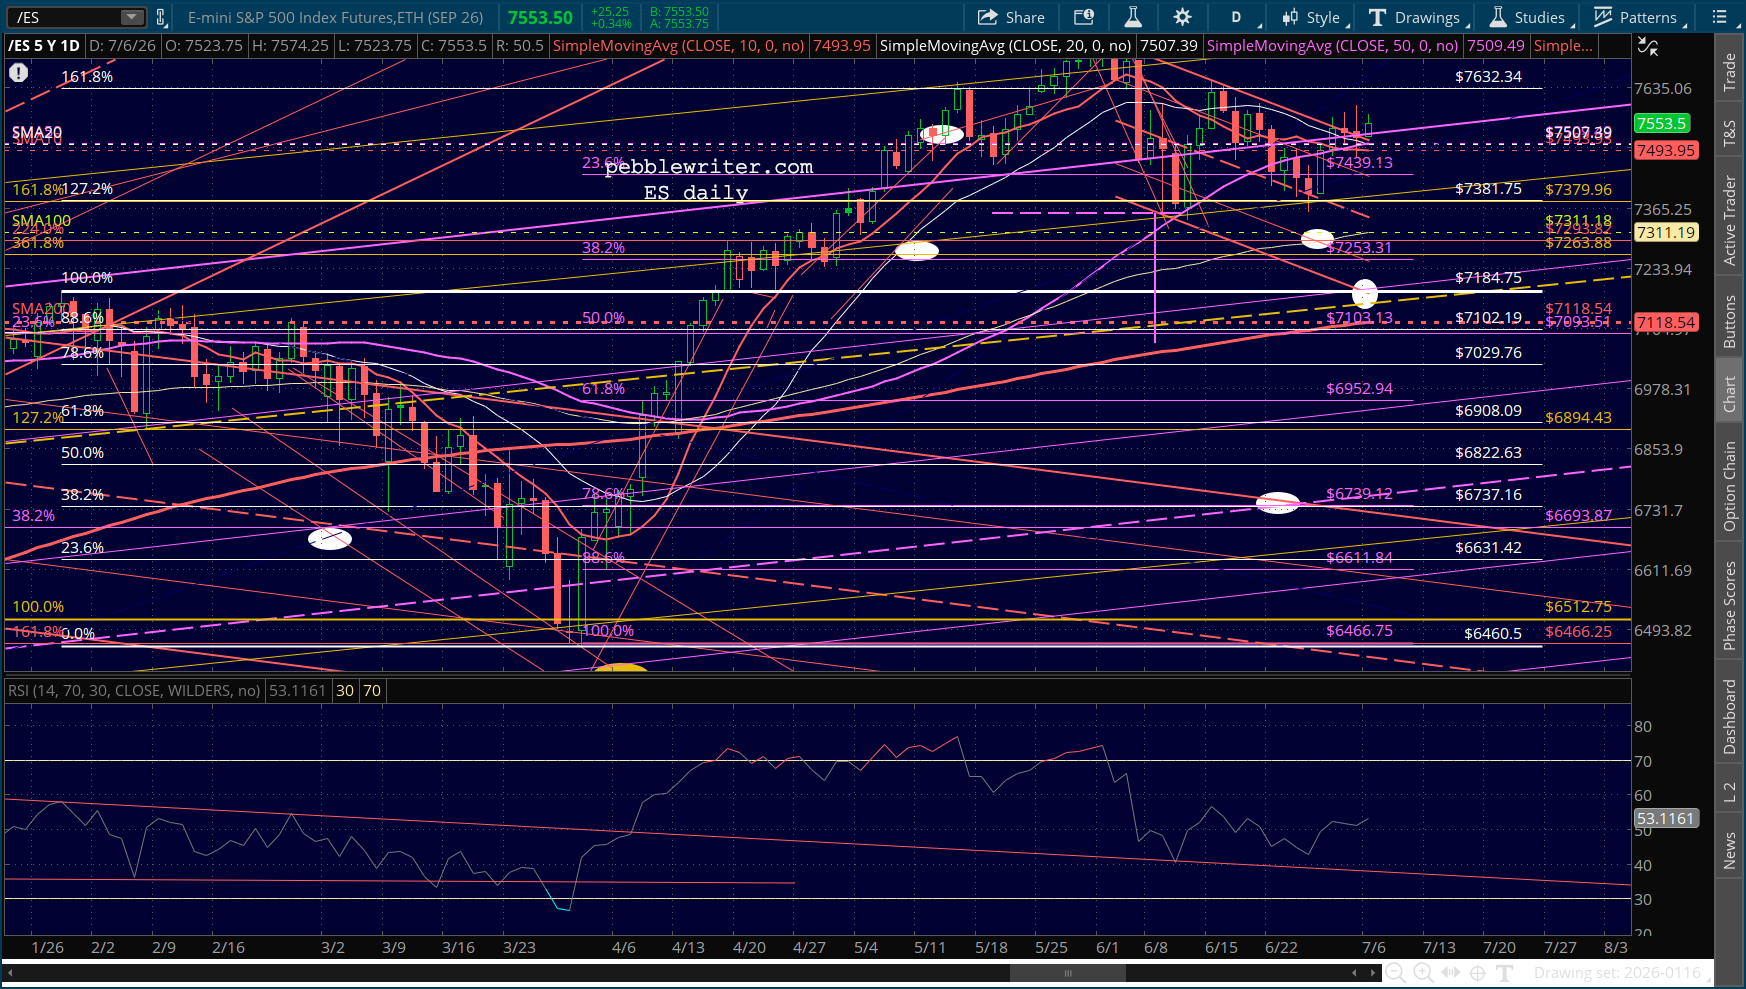
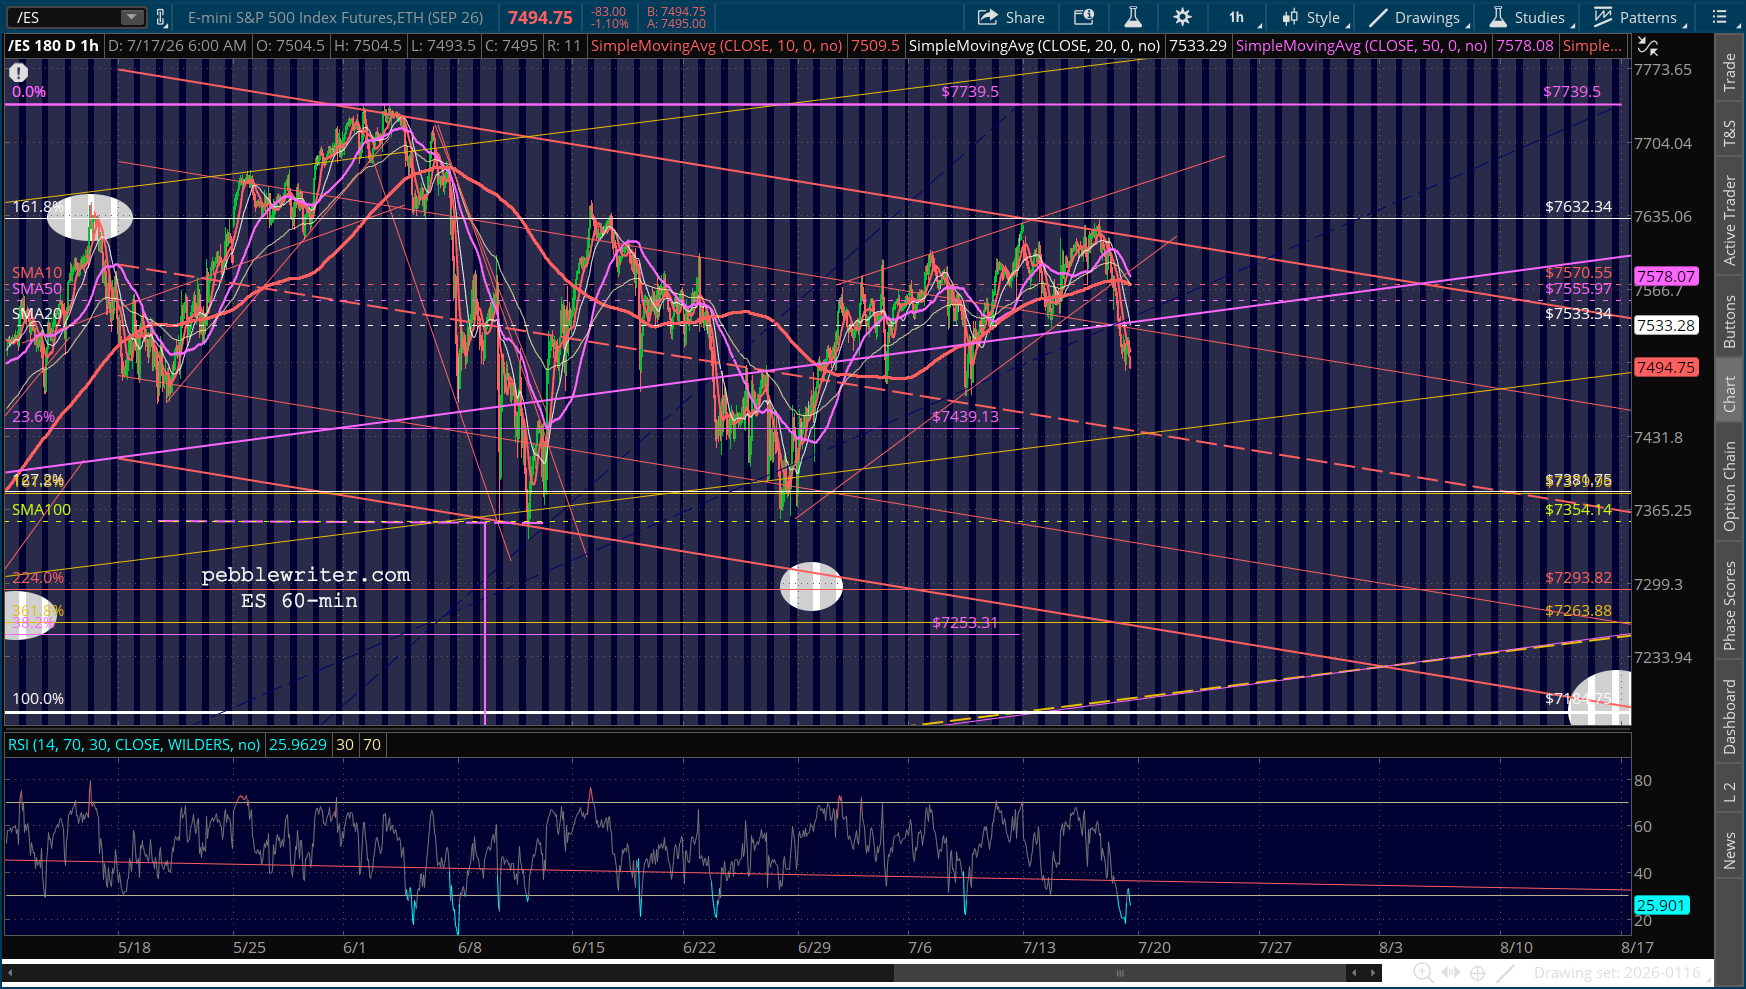
Futures are off sharply as the rising wedge finally breaks down, signalling at least a 7.5% decline by mid-August. Recall, this is the point at which its SMA200 will its January highs.
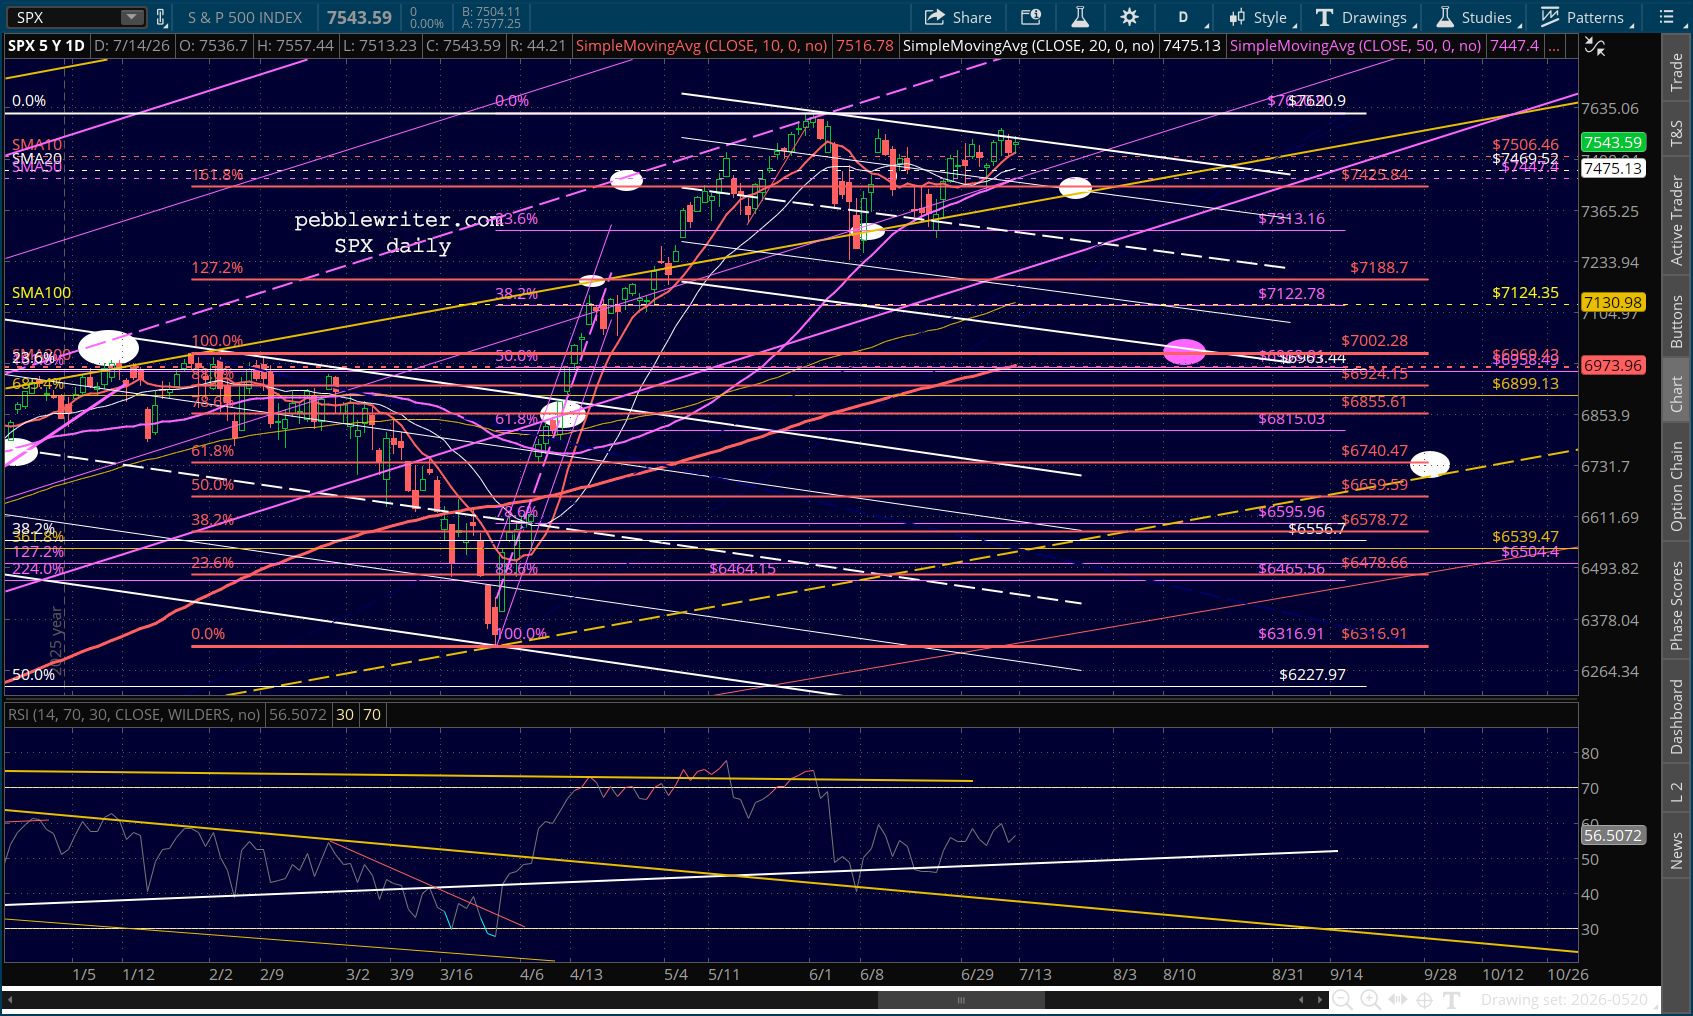
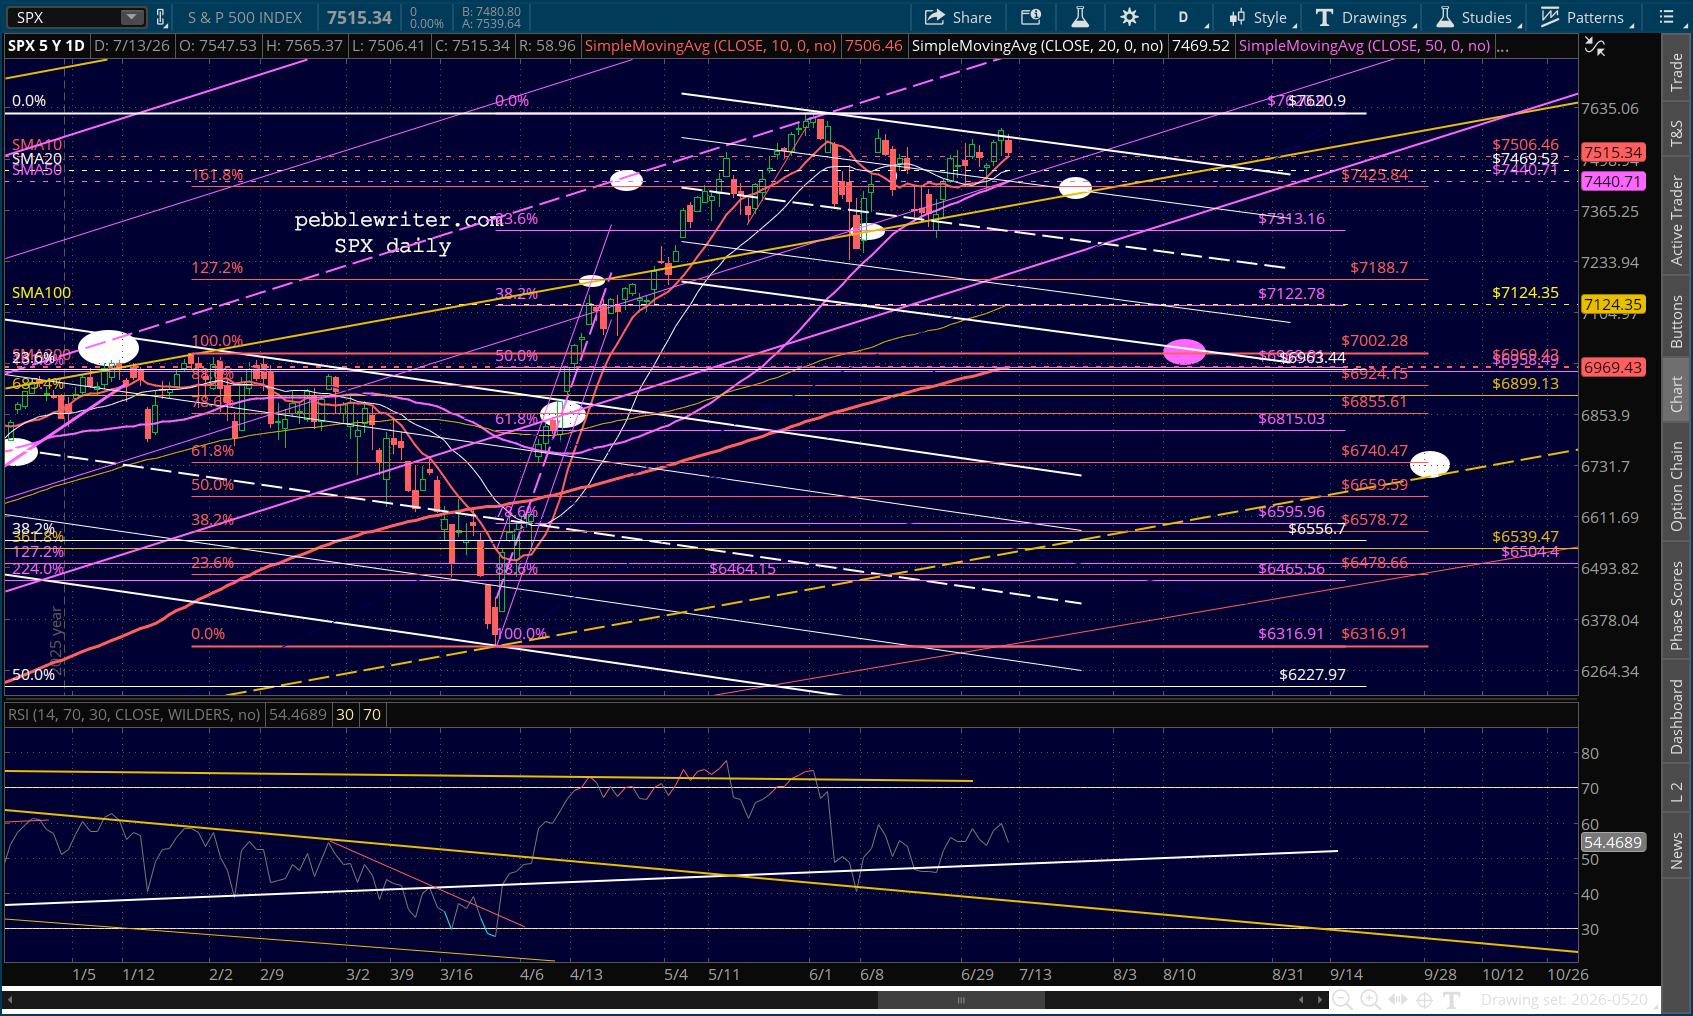
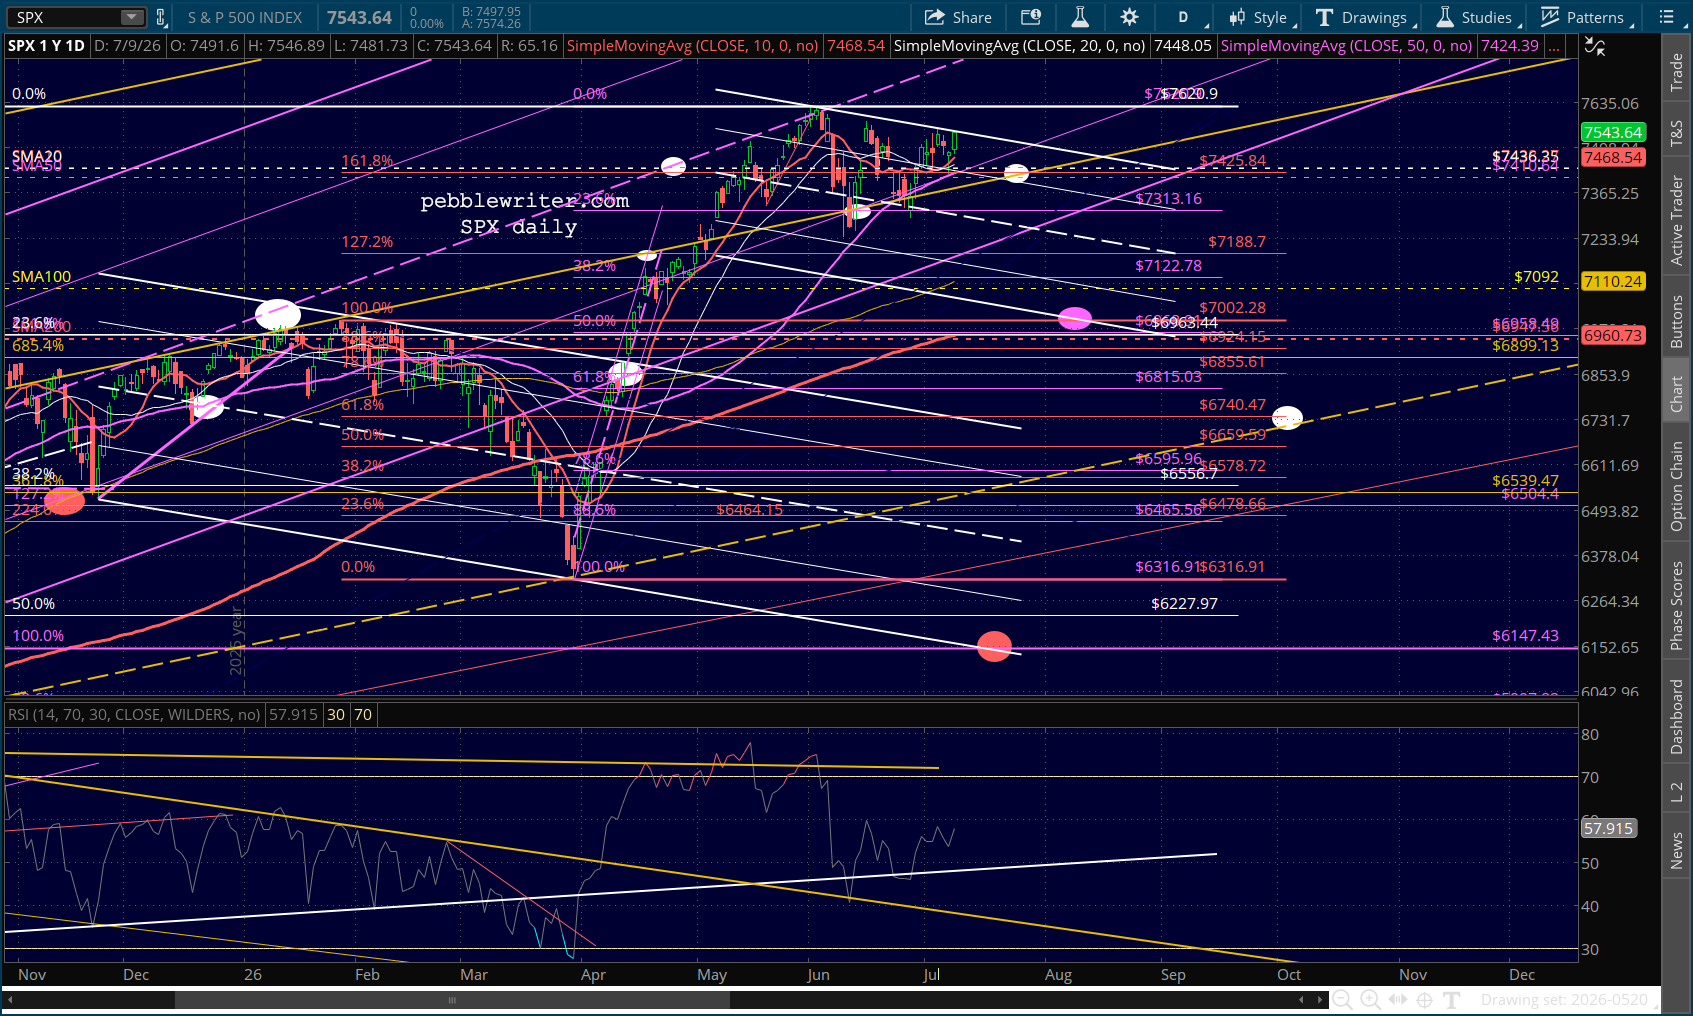
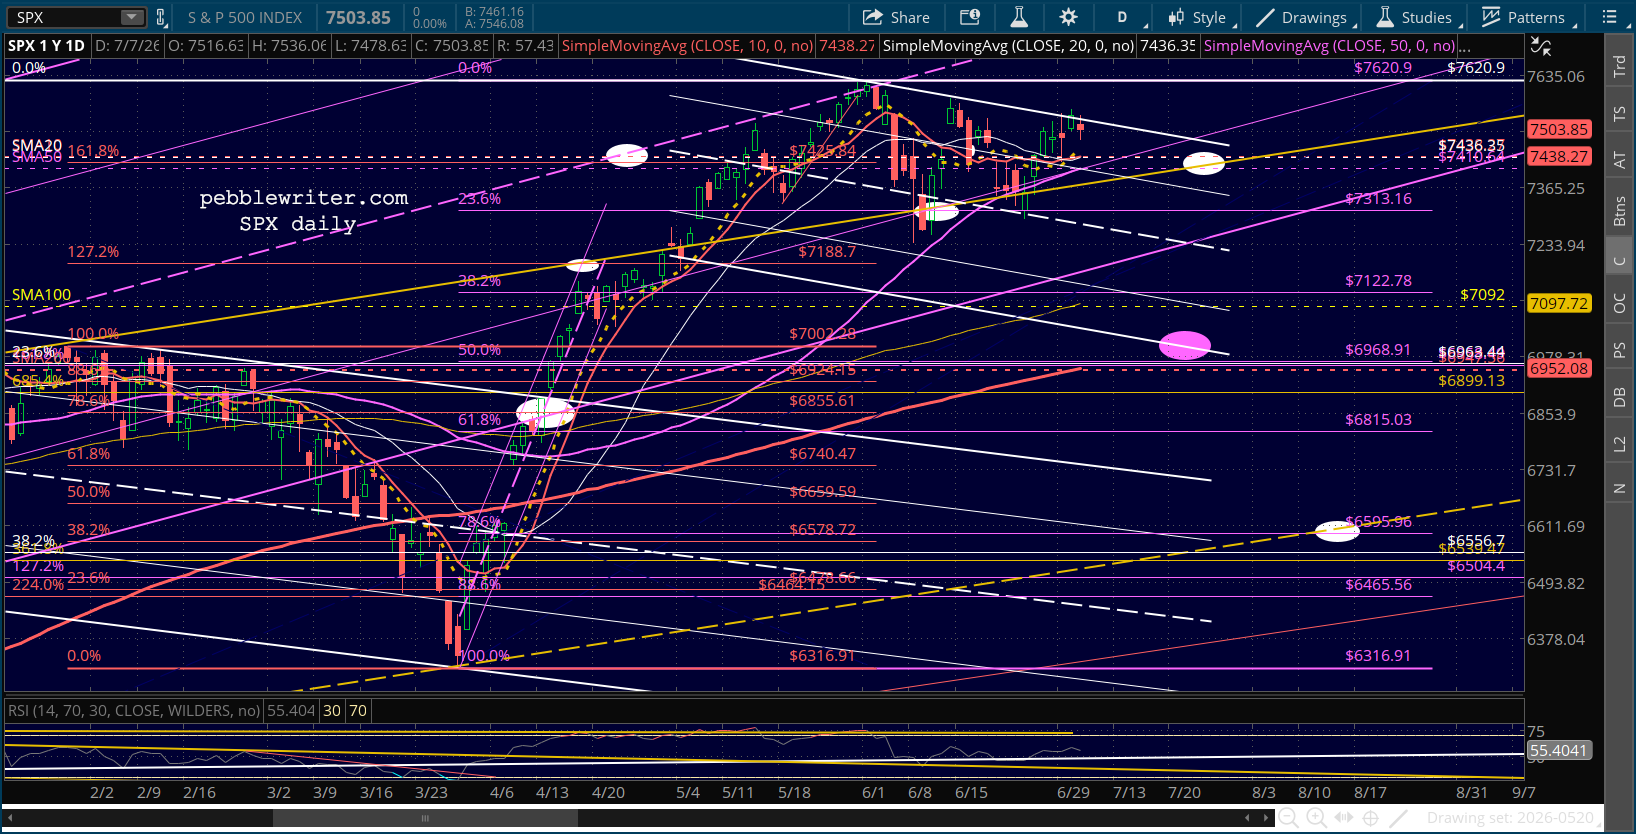
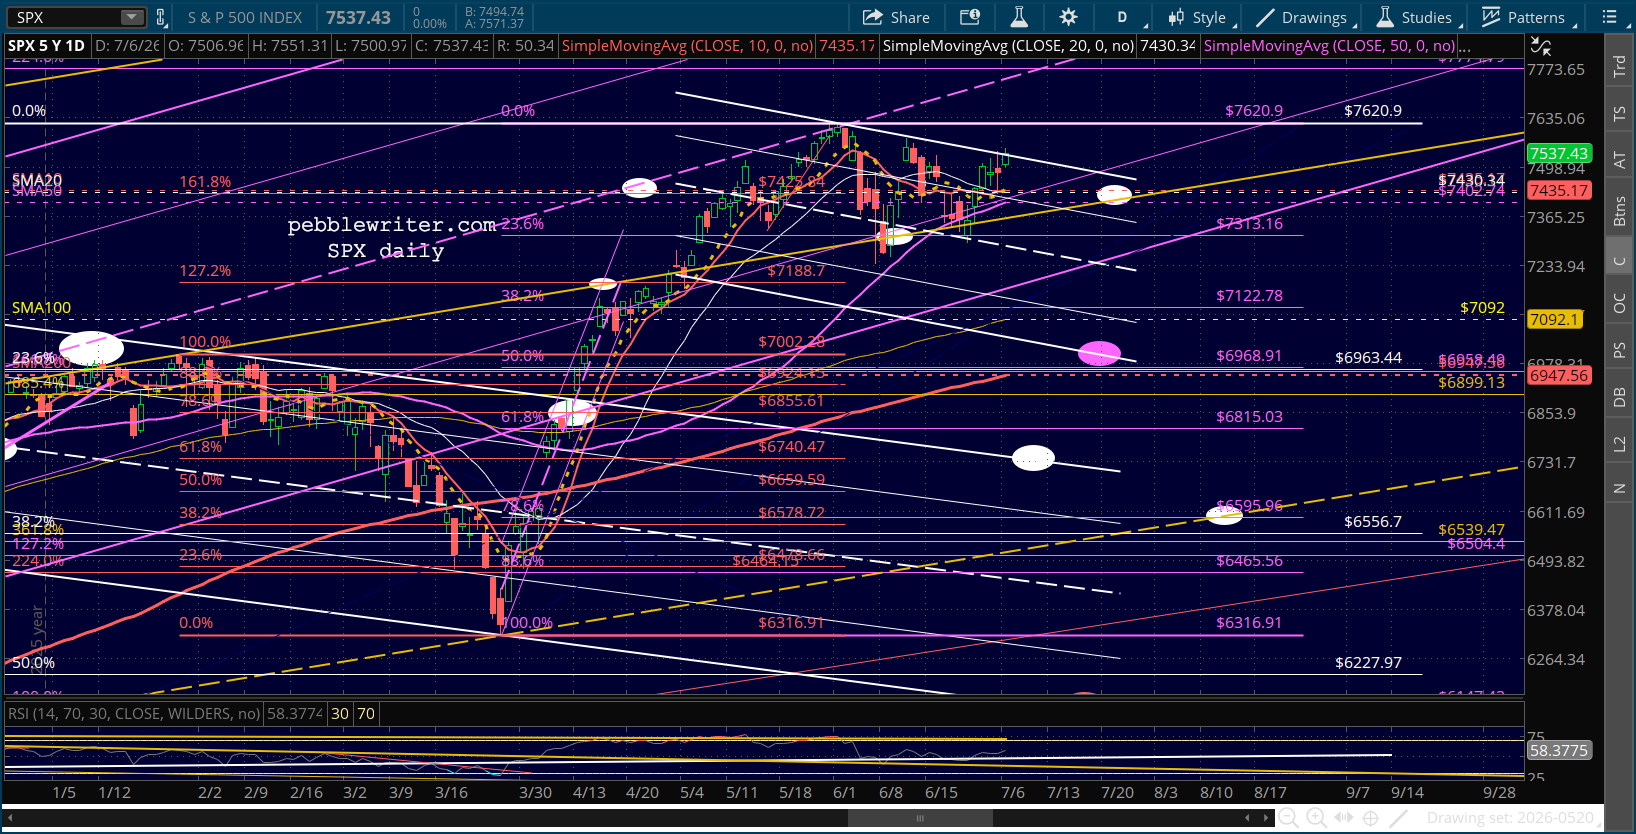
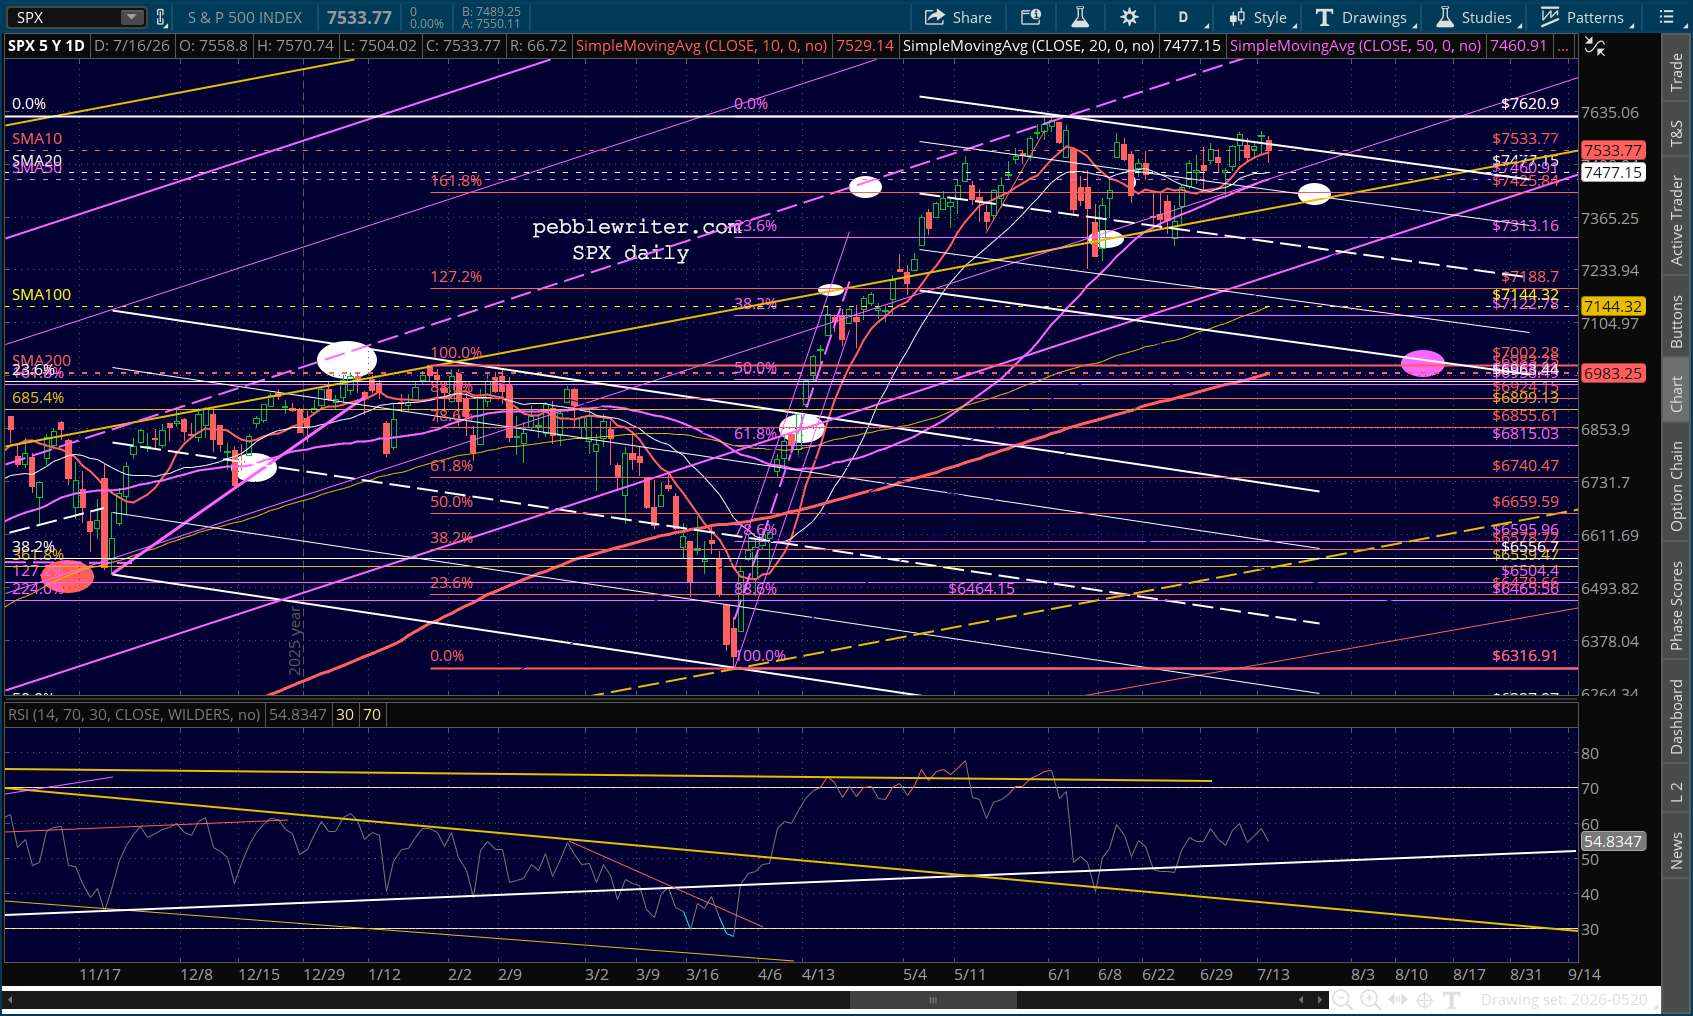
SPX’s backtest target is more like 8.1% from its all-time highs.
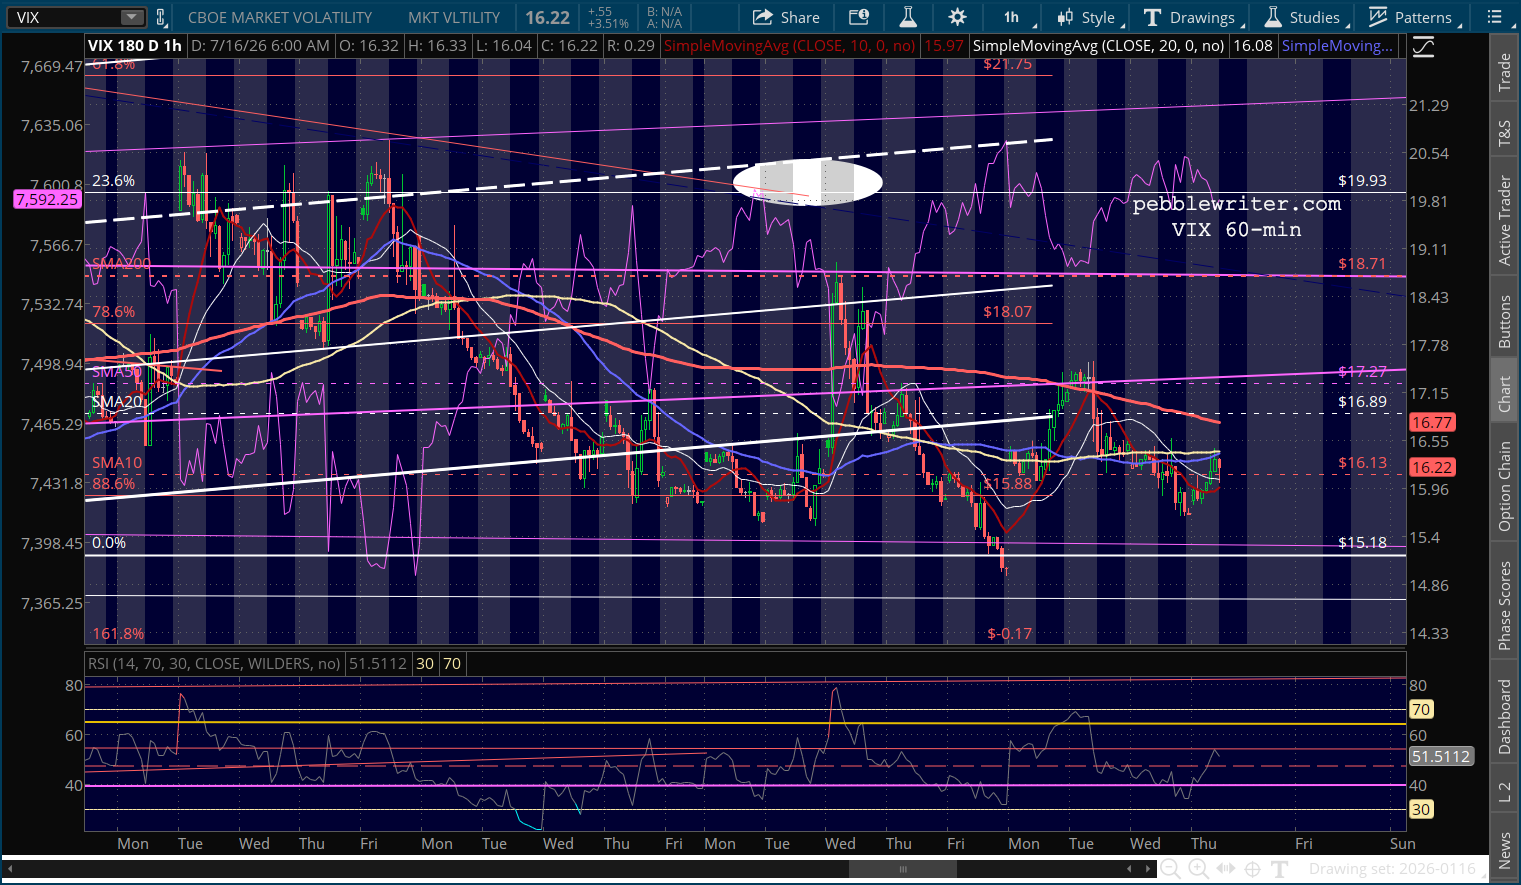
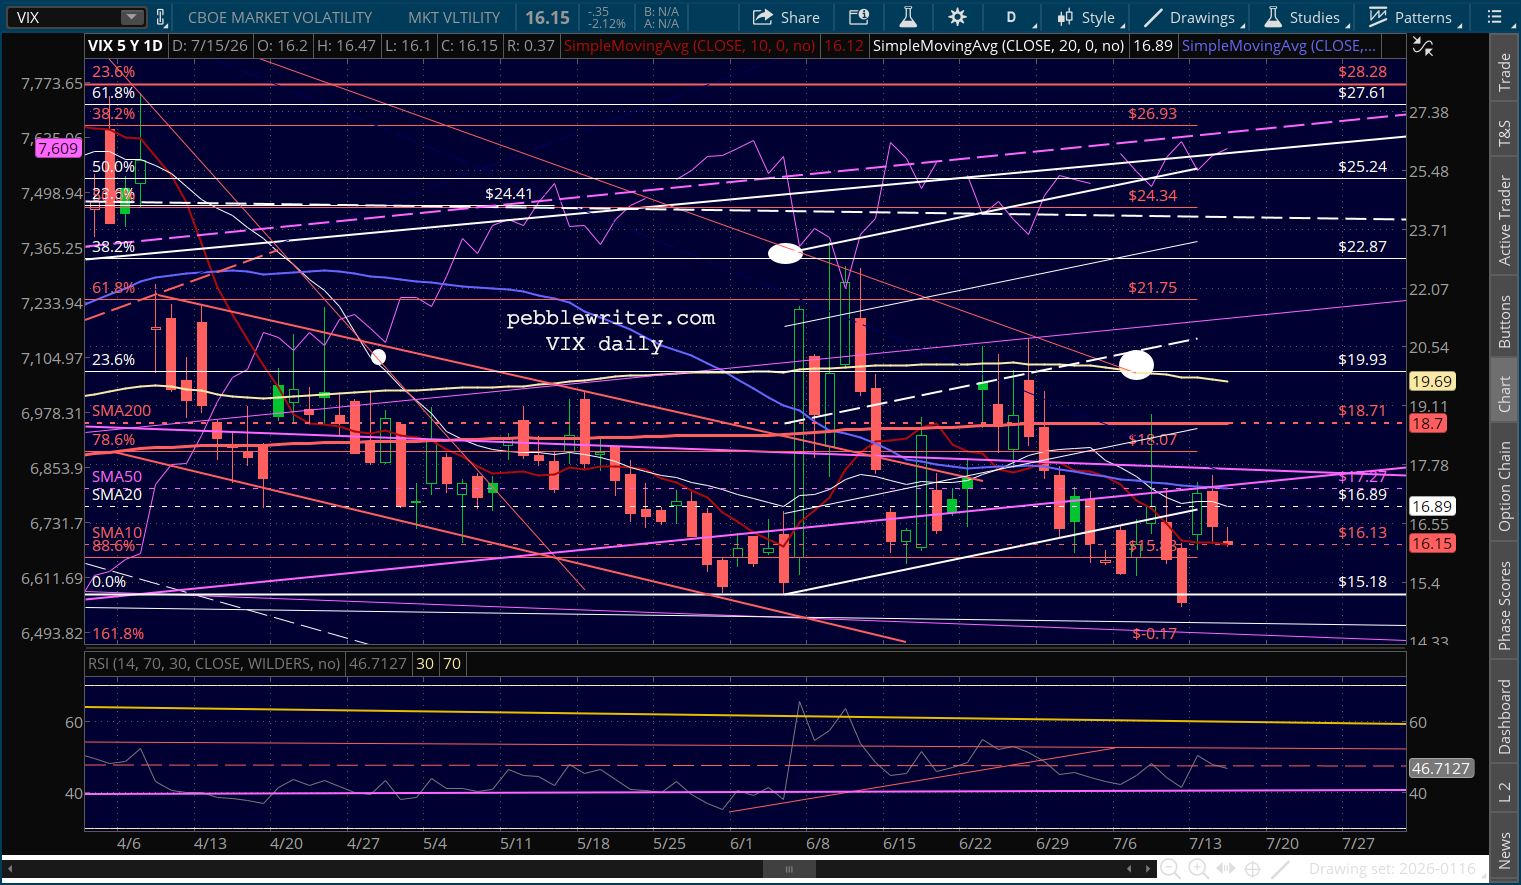
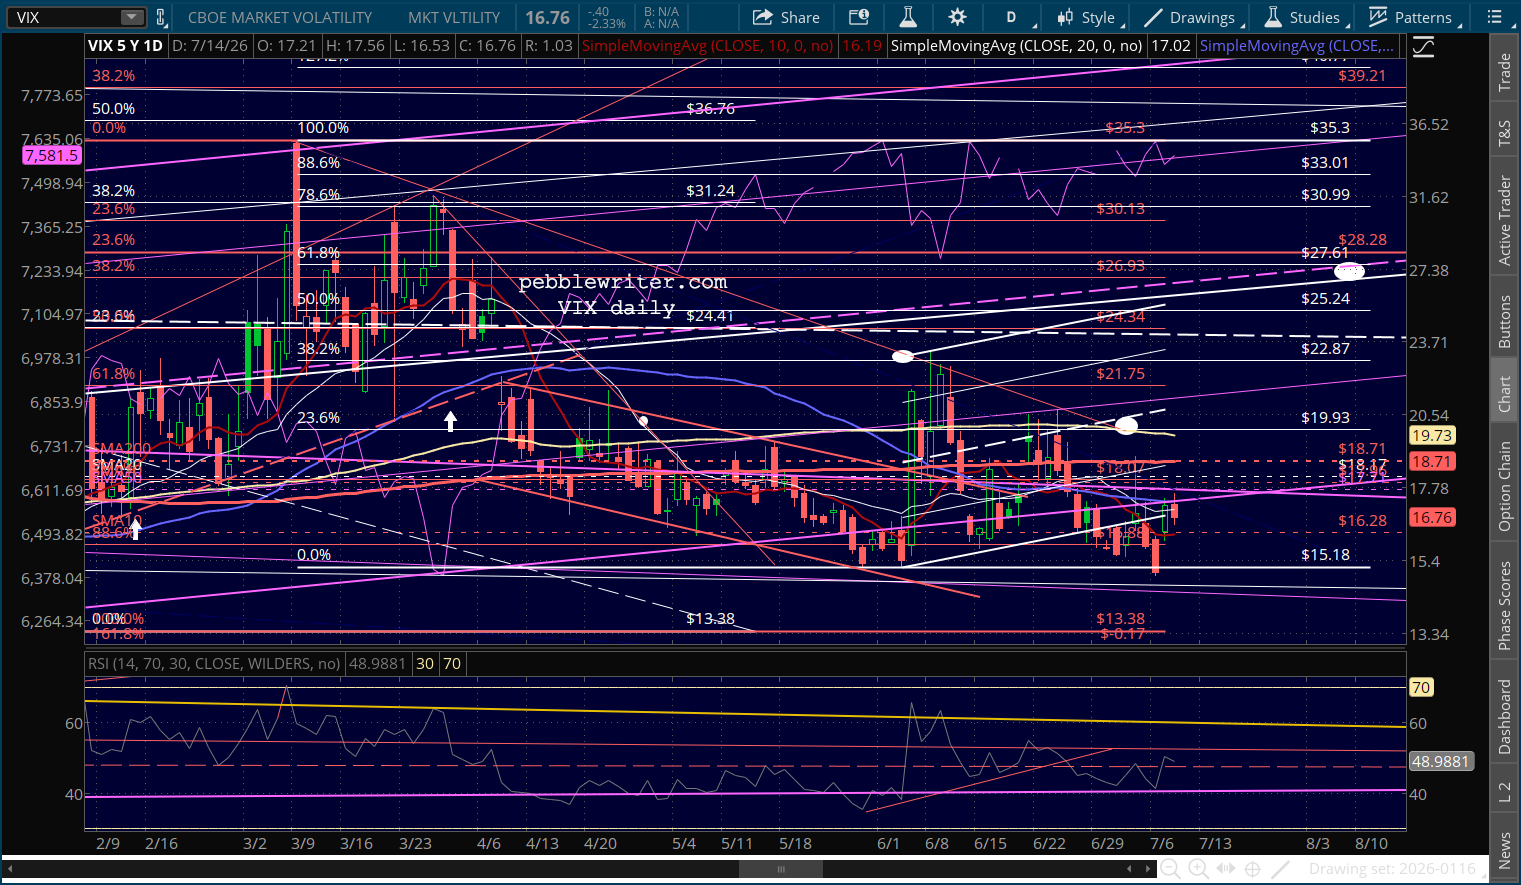
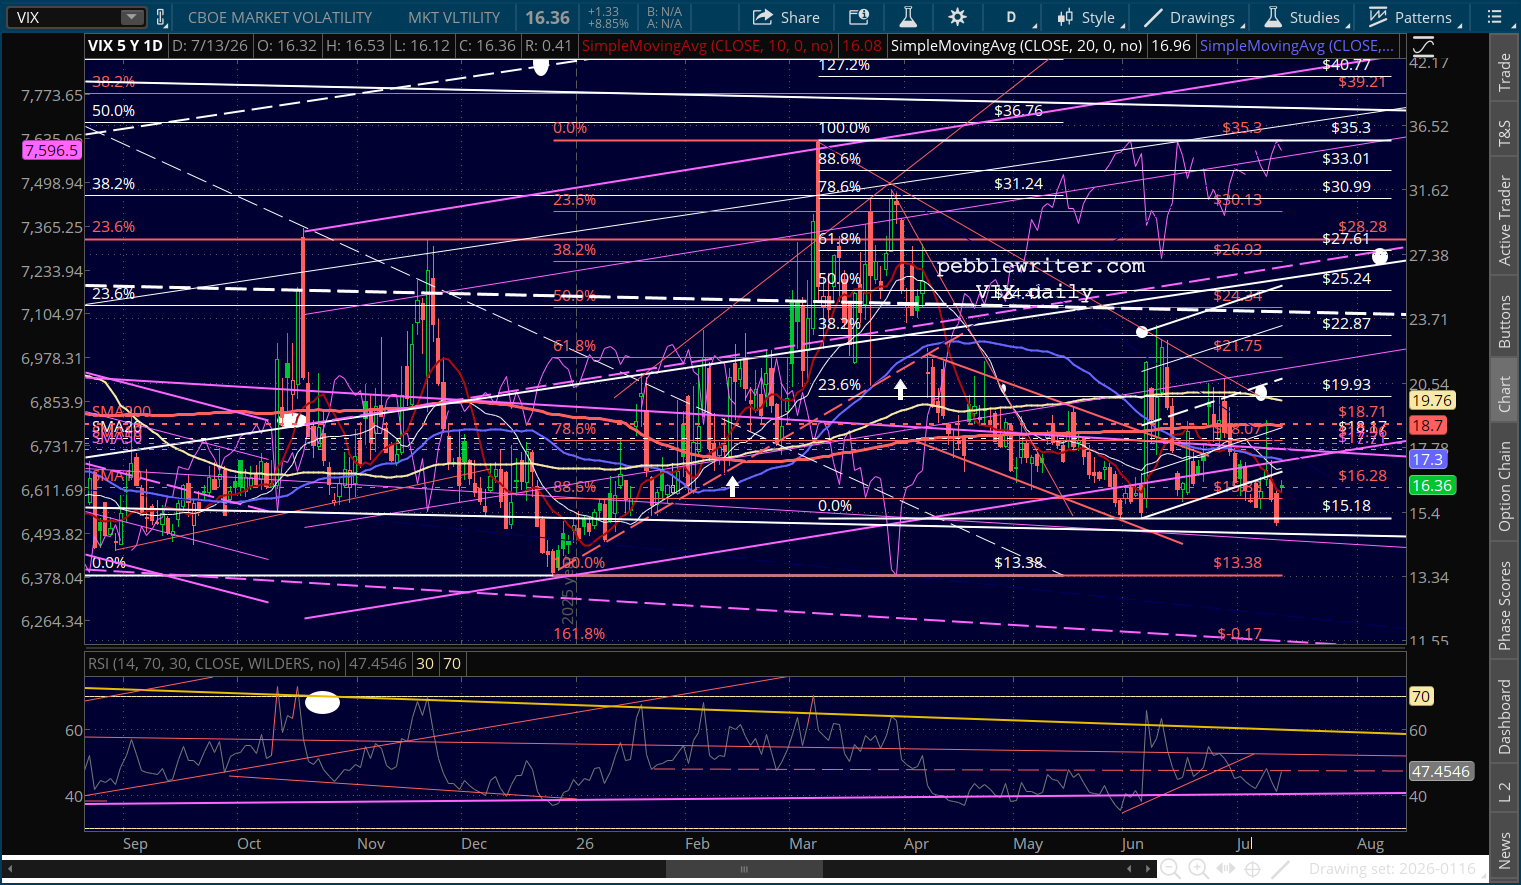
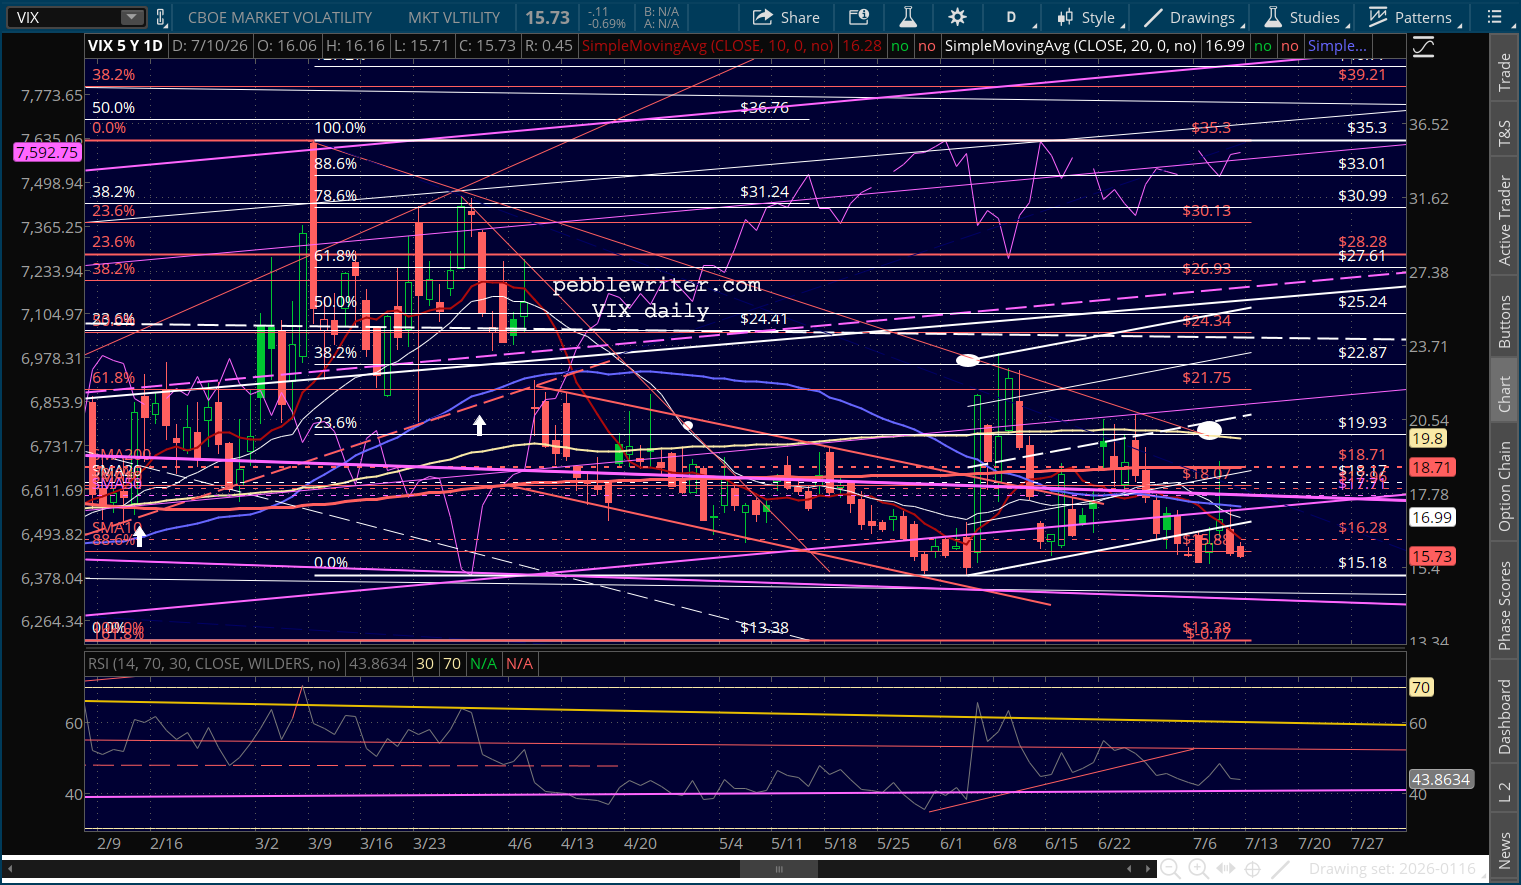
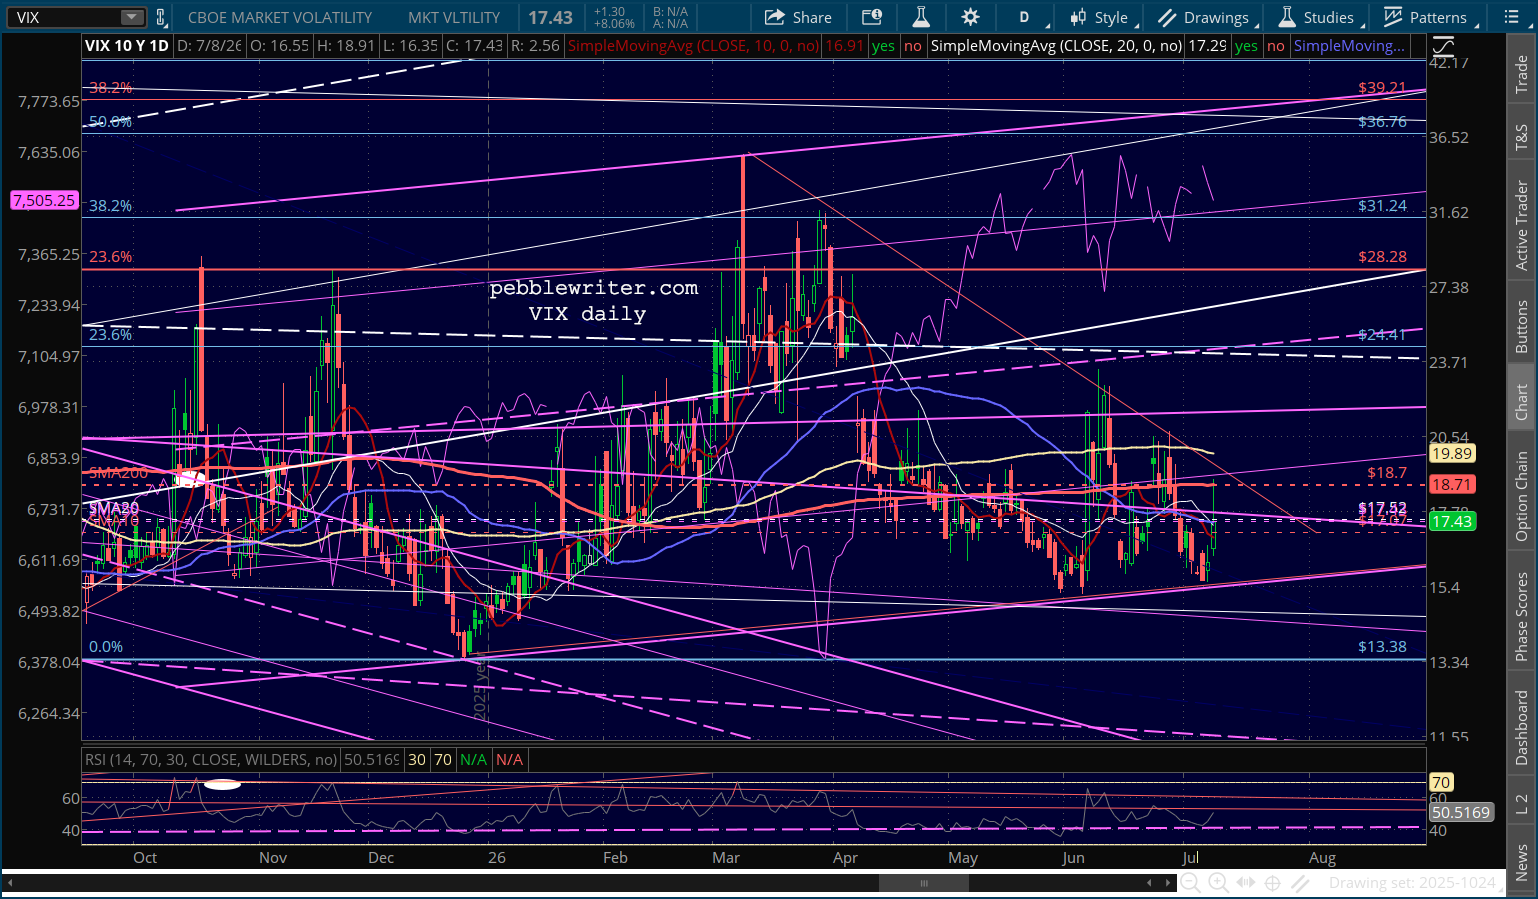
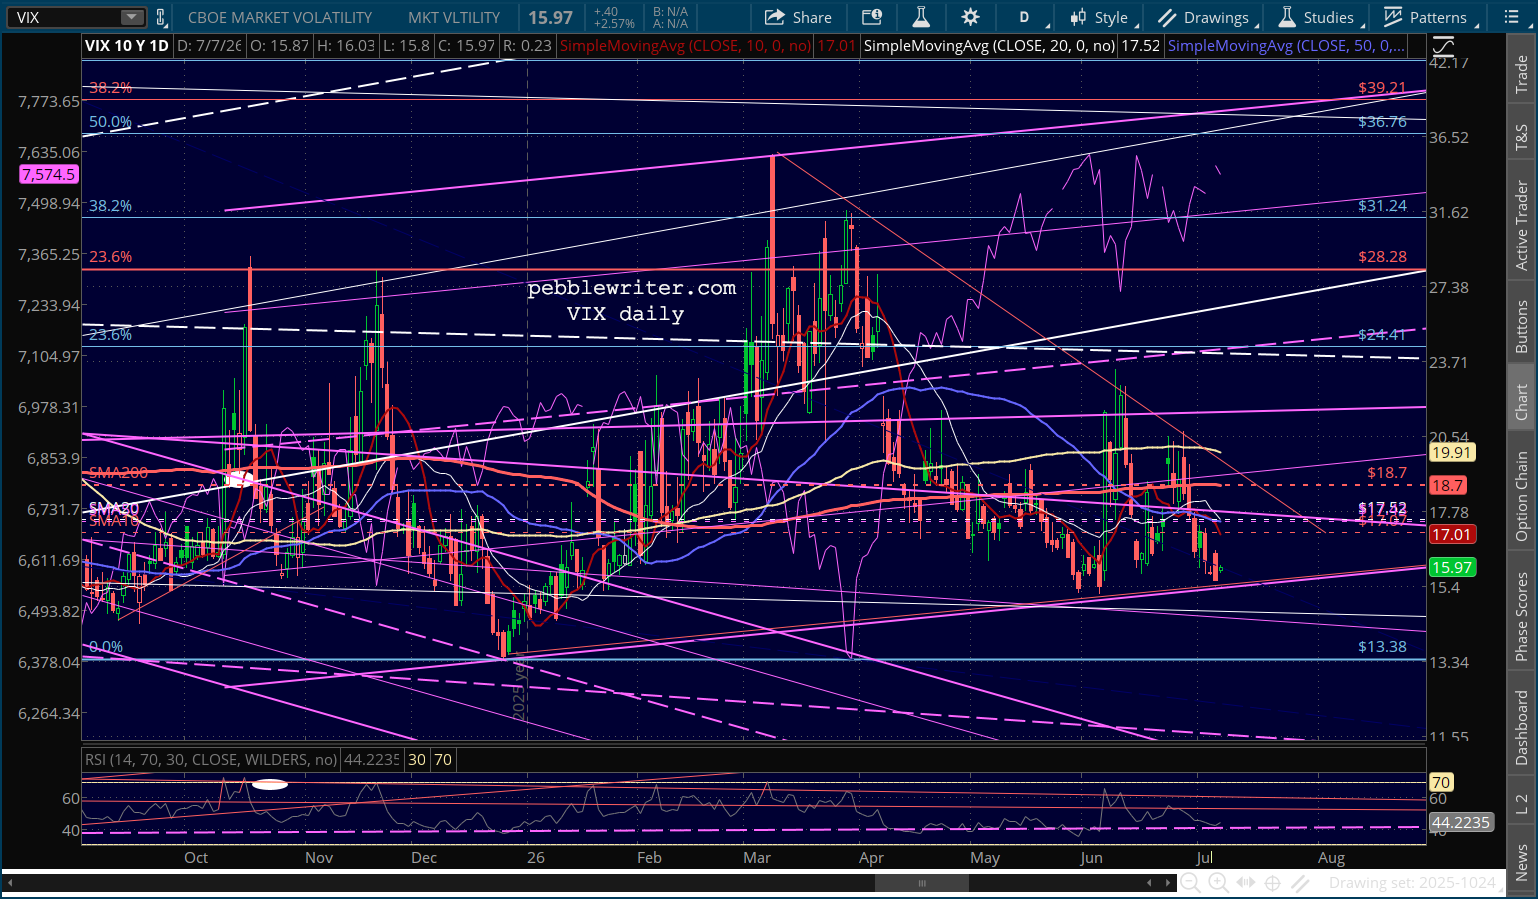
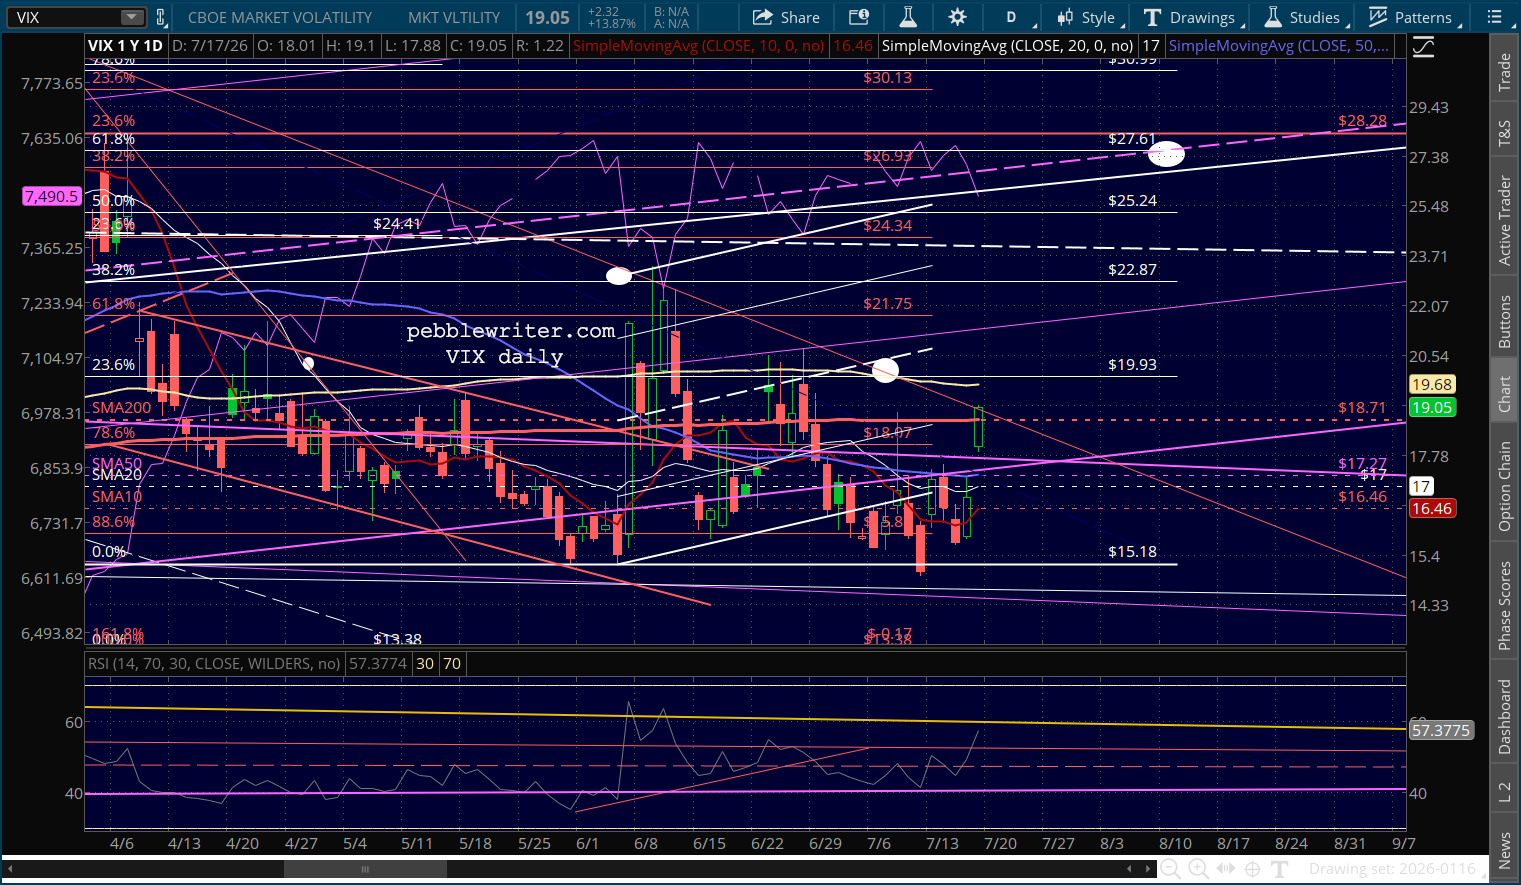
 While VIX is pressing up against overhead resistance…
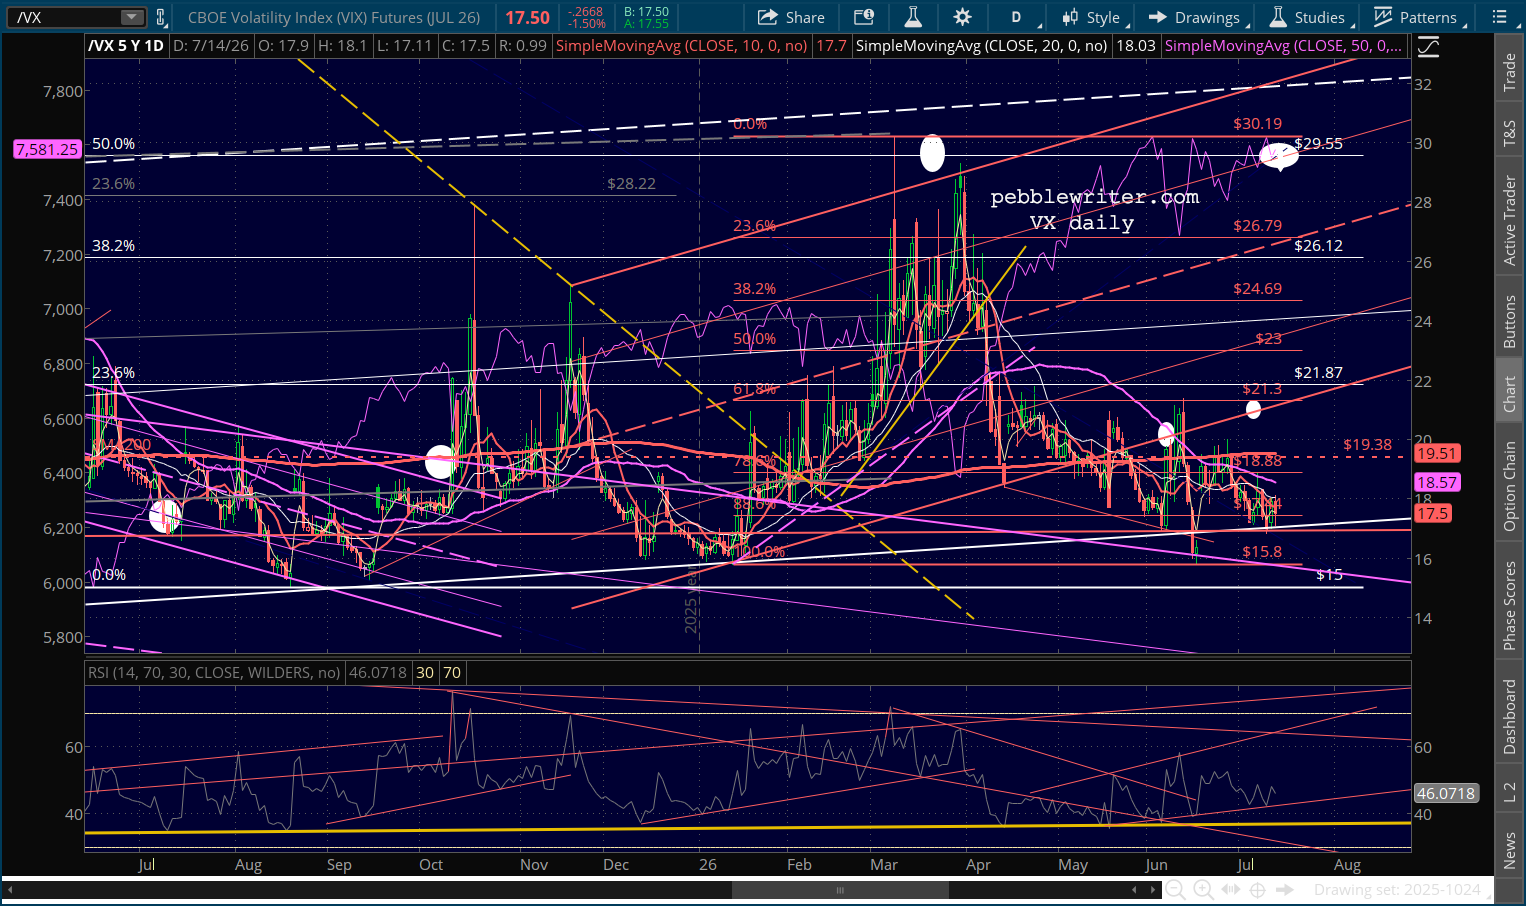
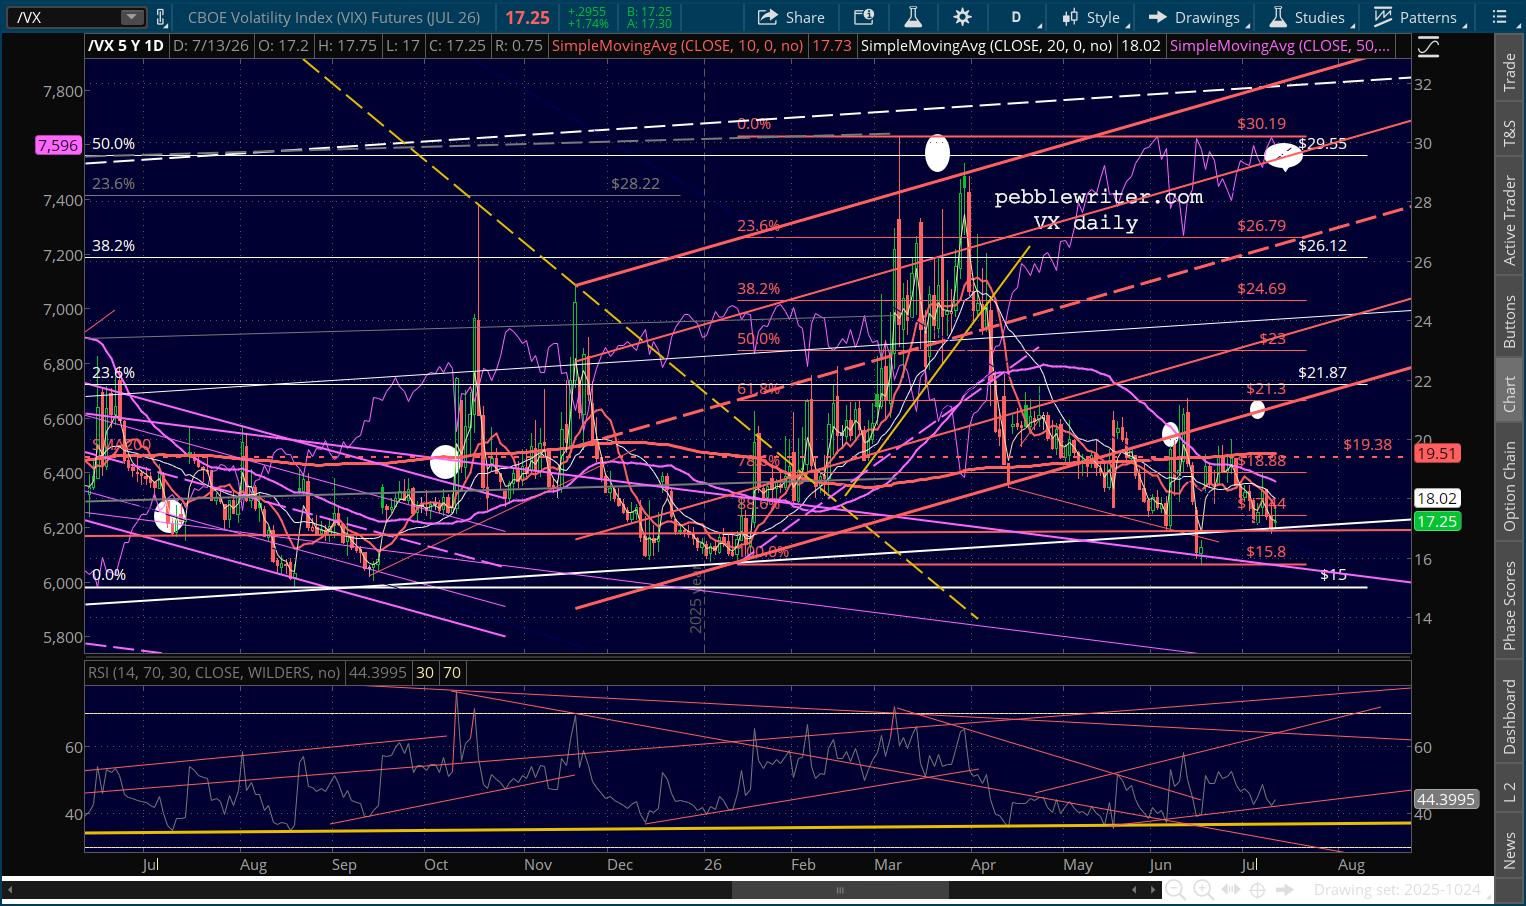
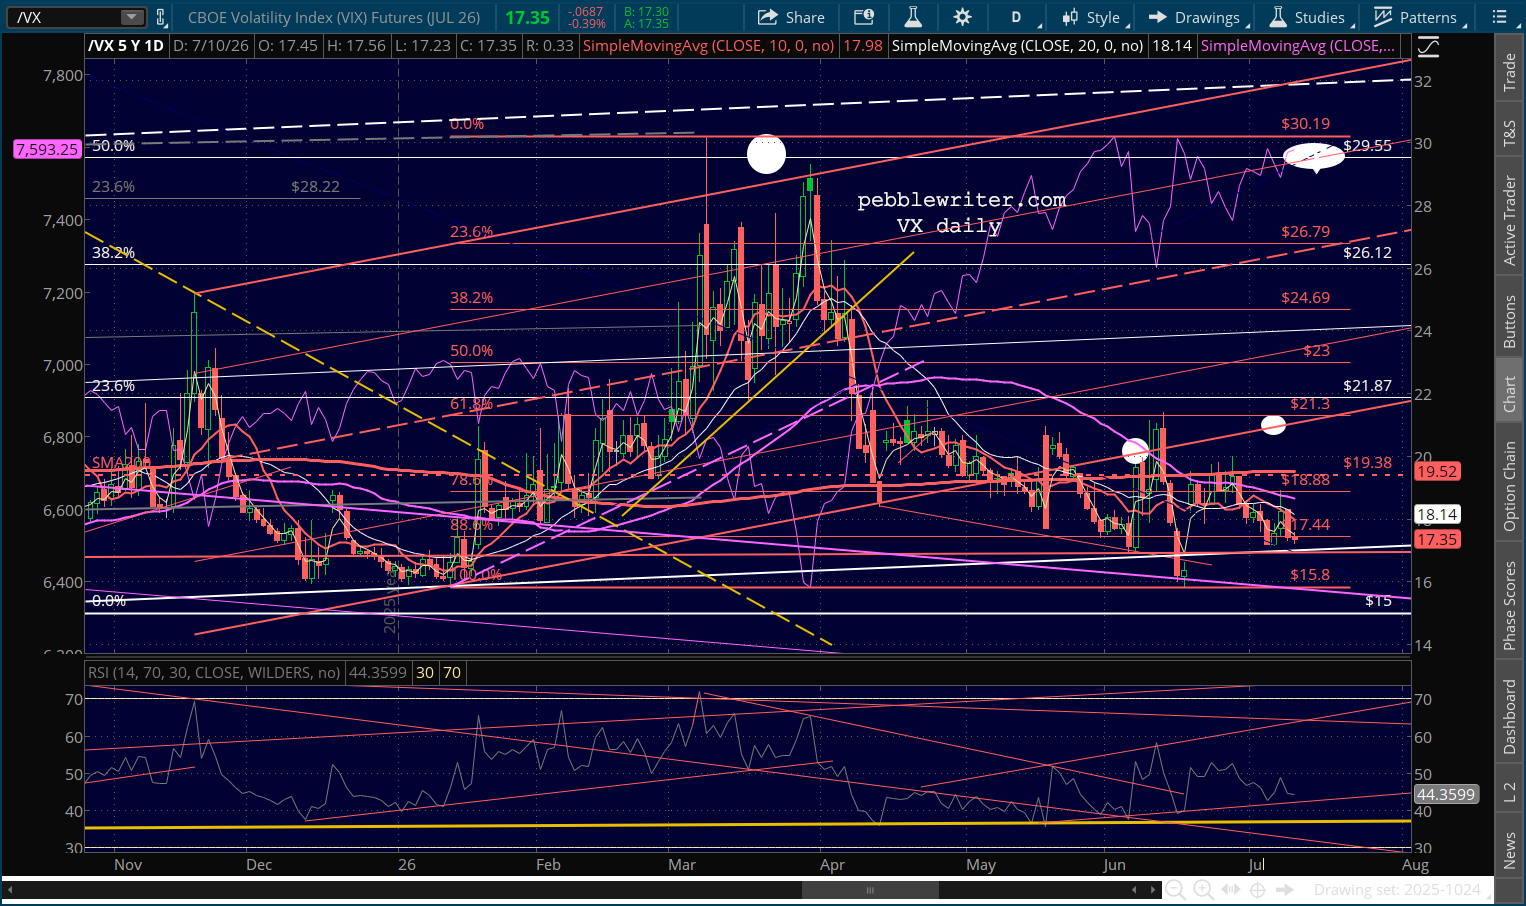
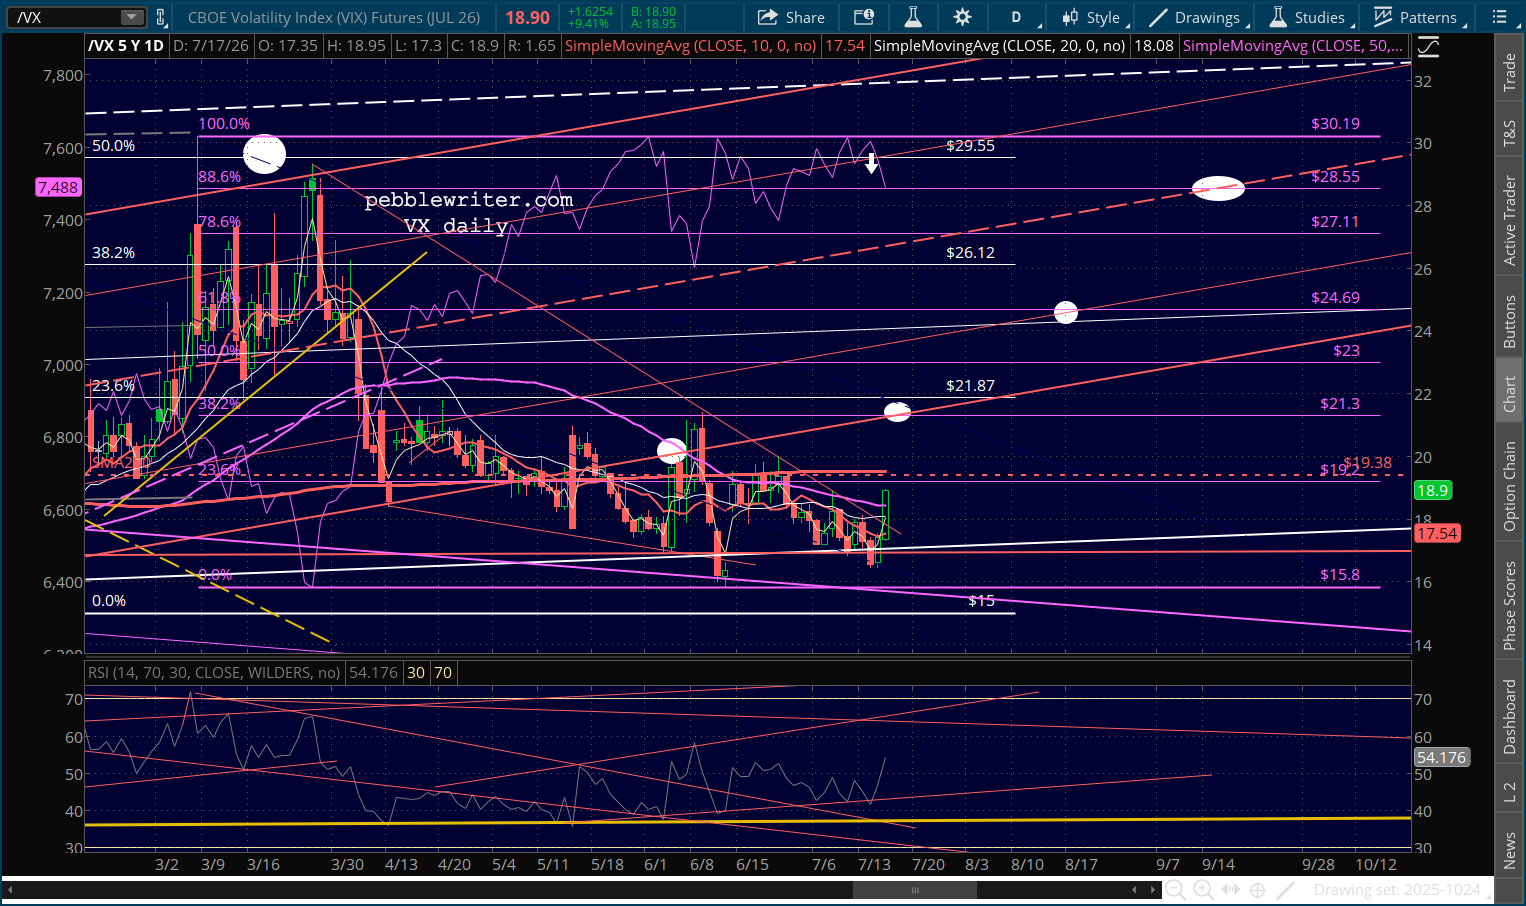
 …VX has already broken out.
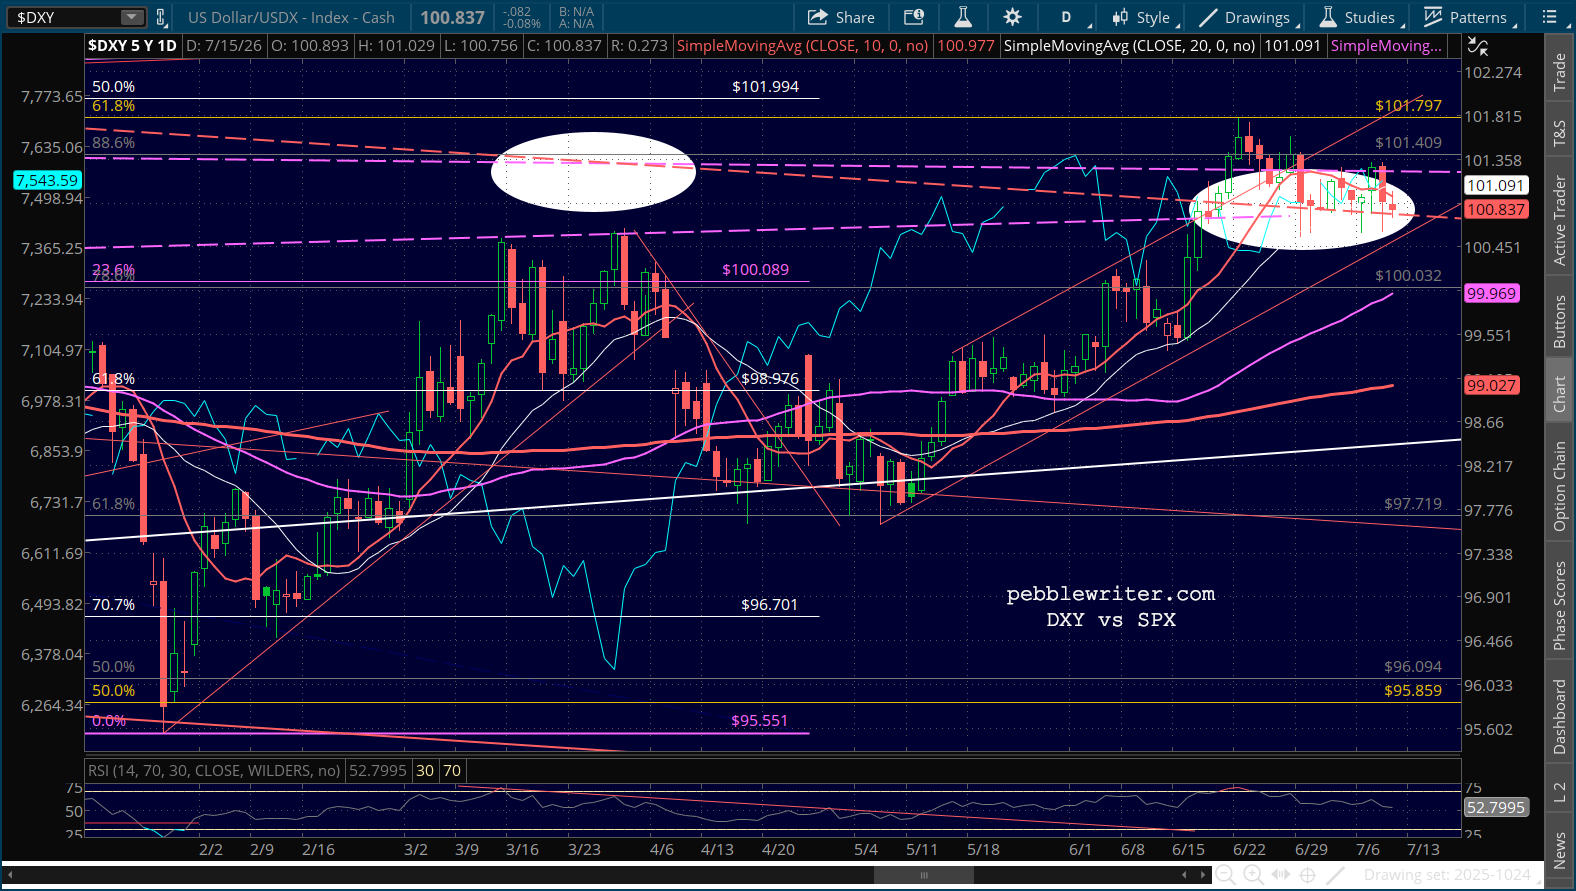
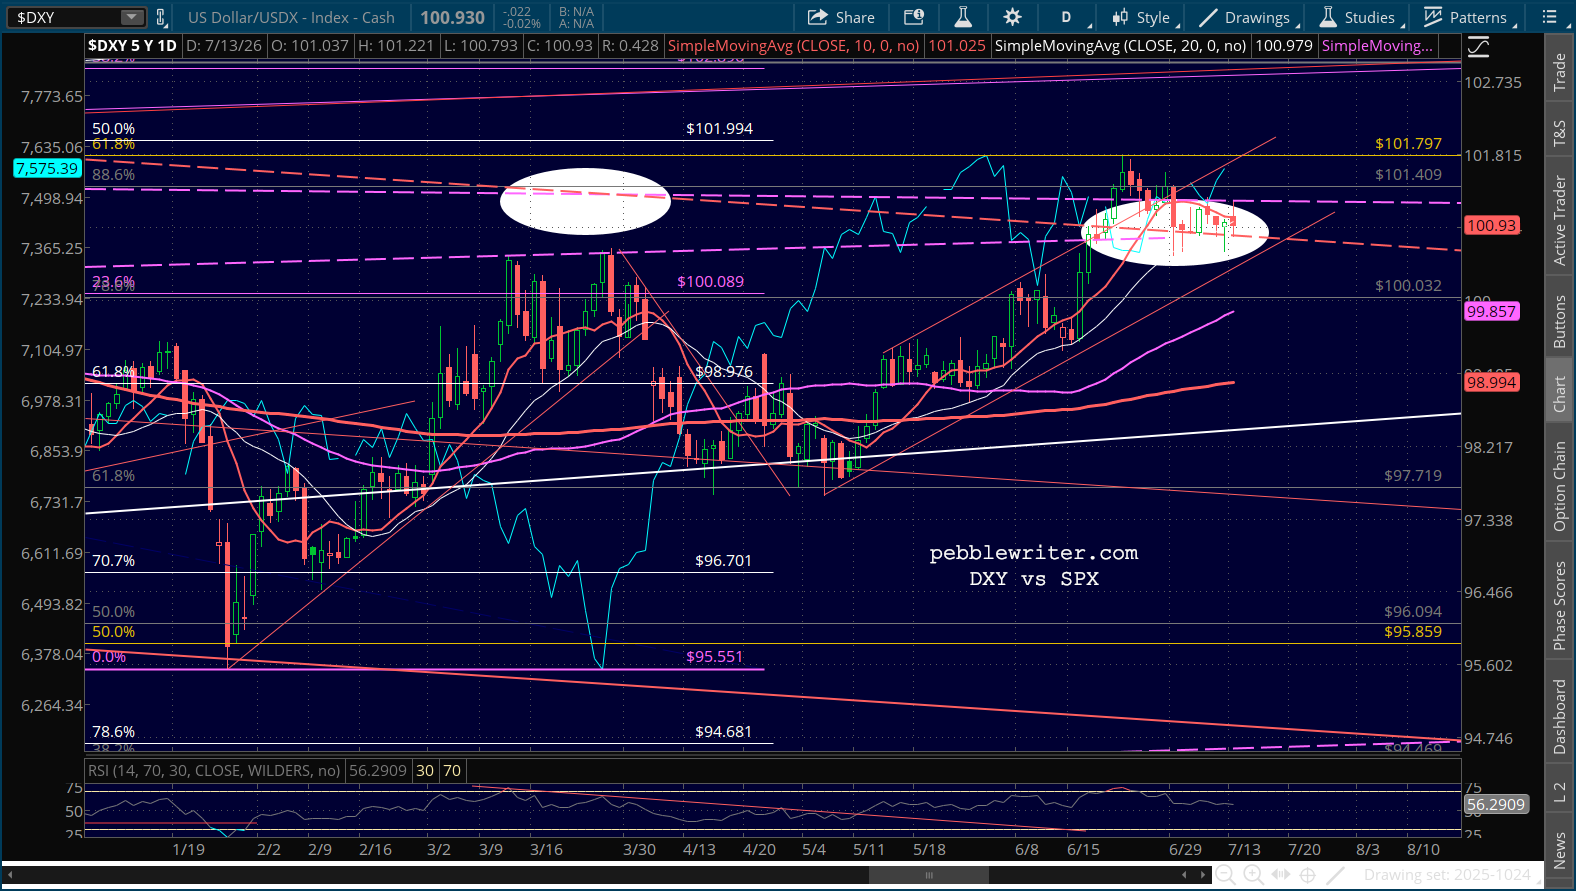
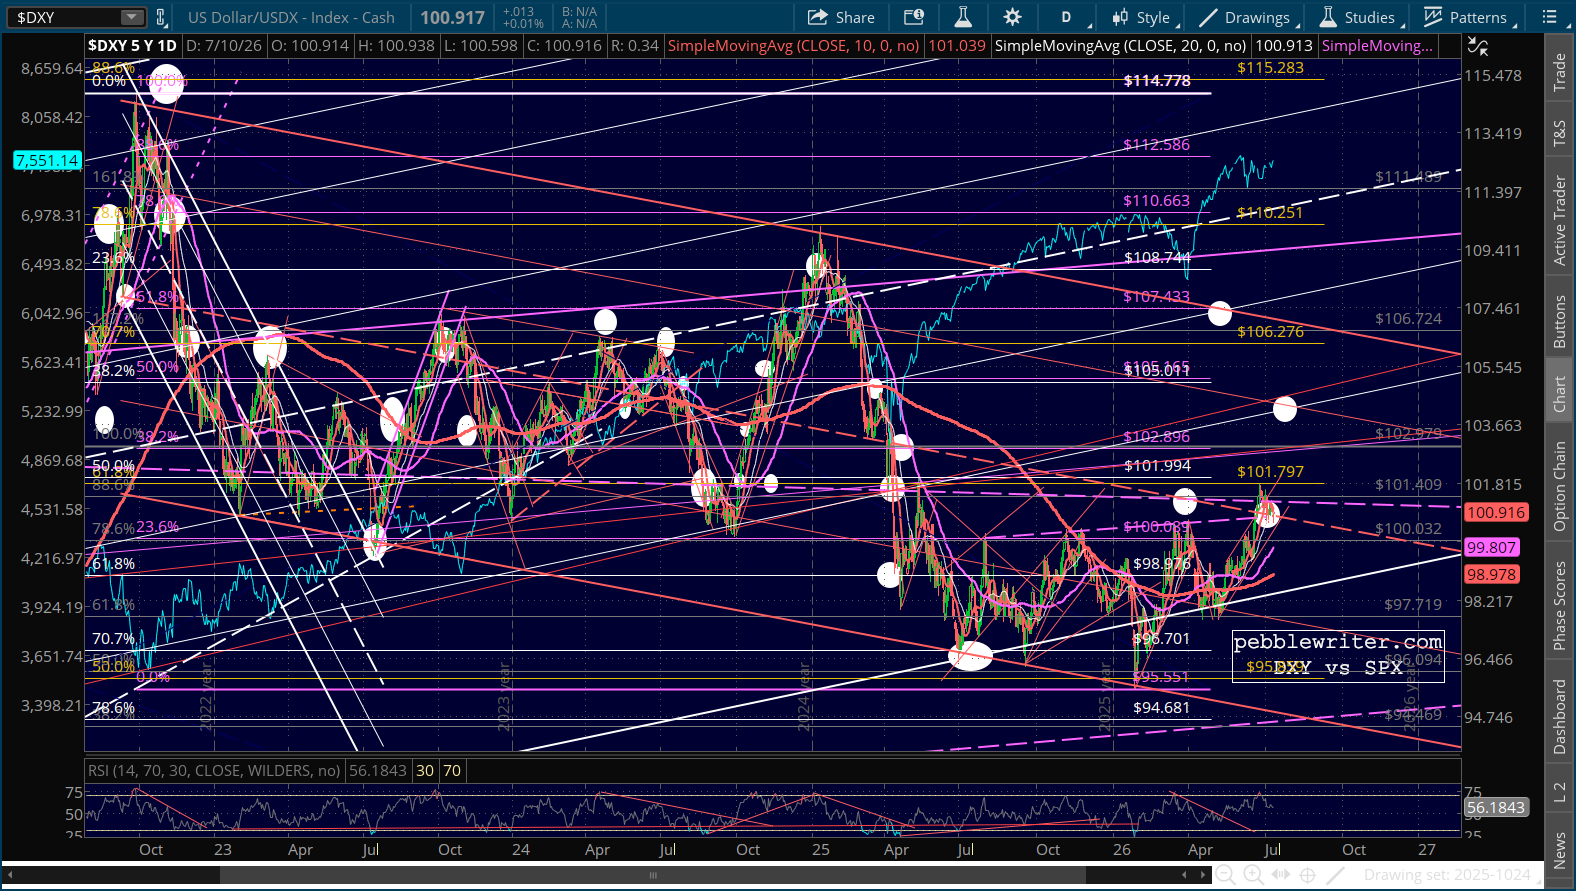
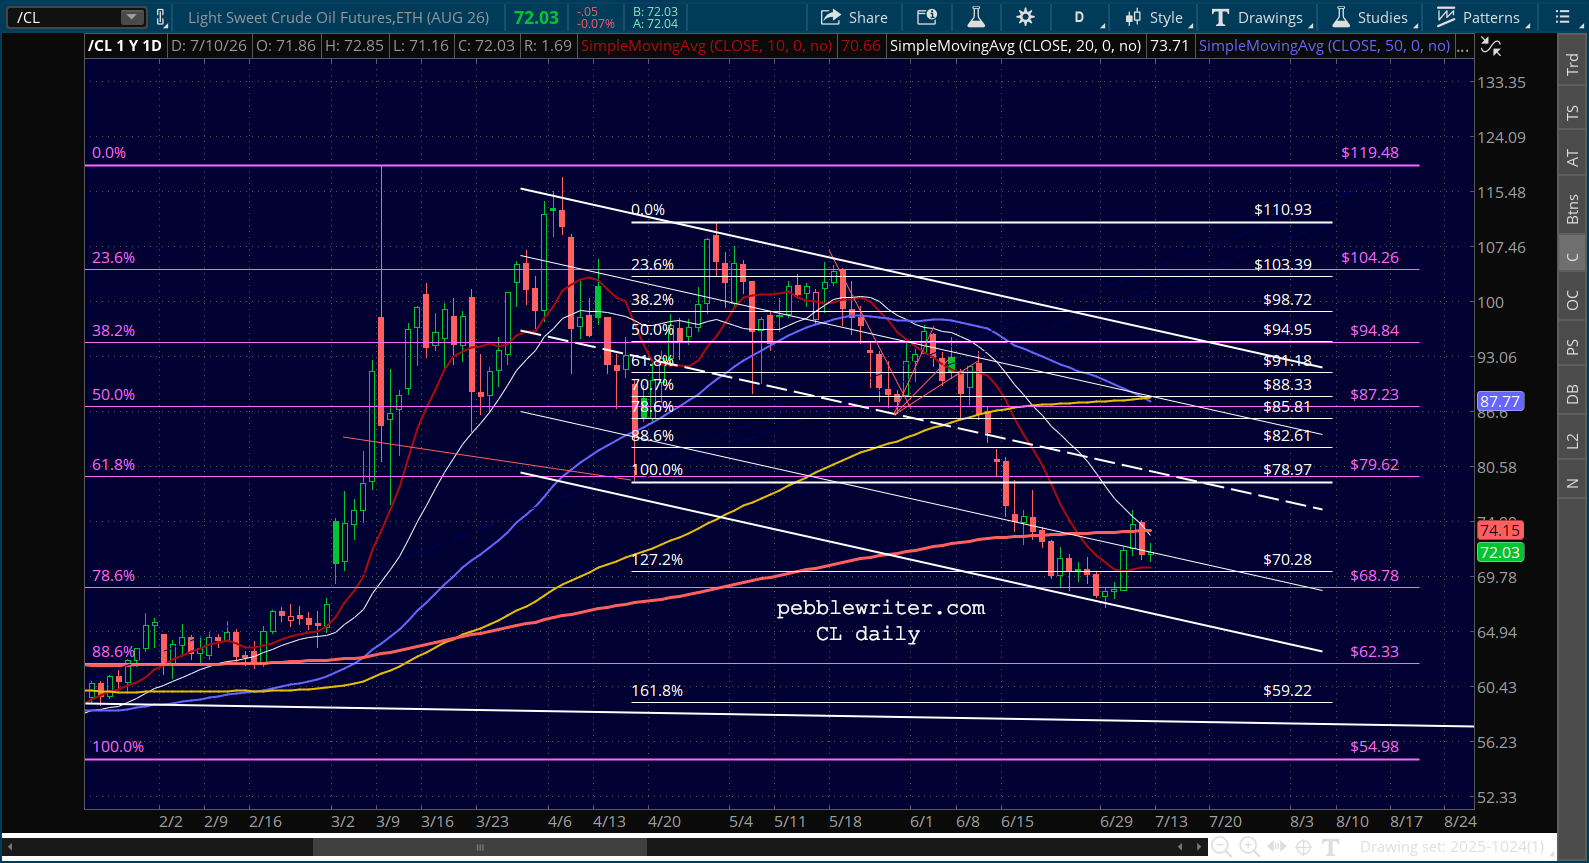
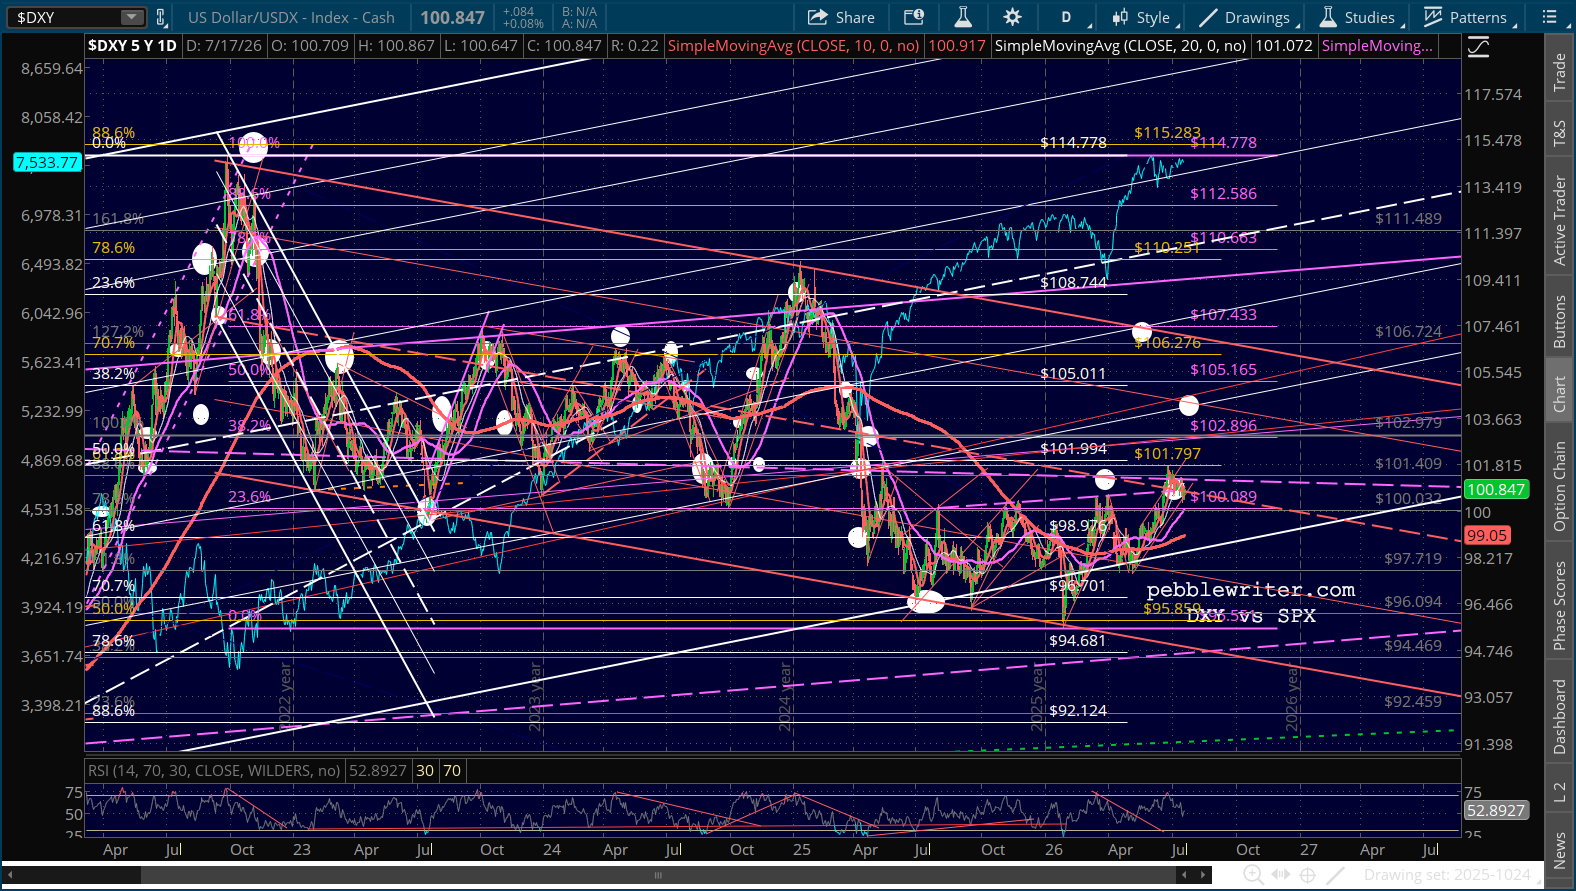
Much will depend on DXY’s ability to finally break out…
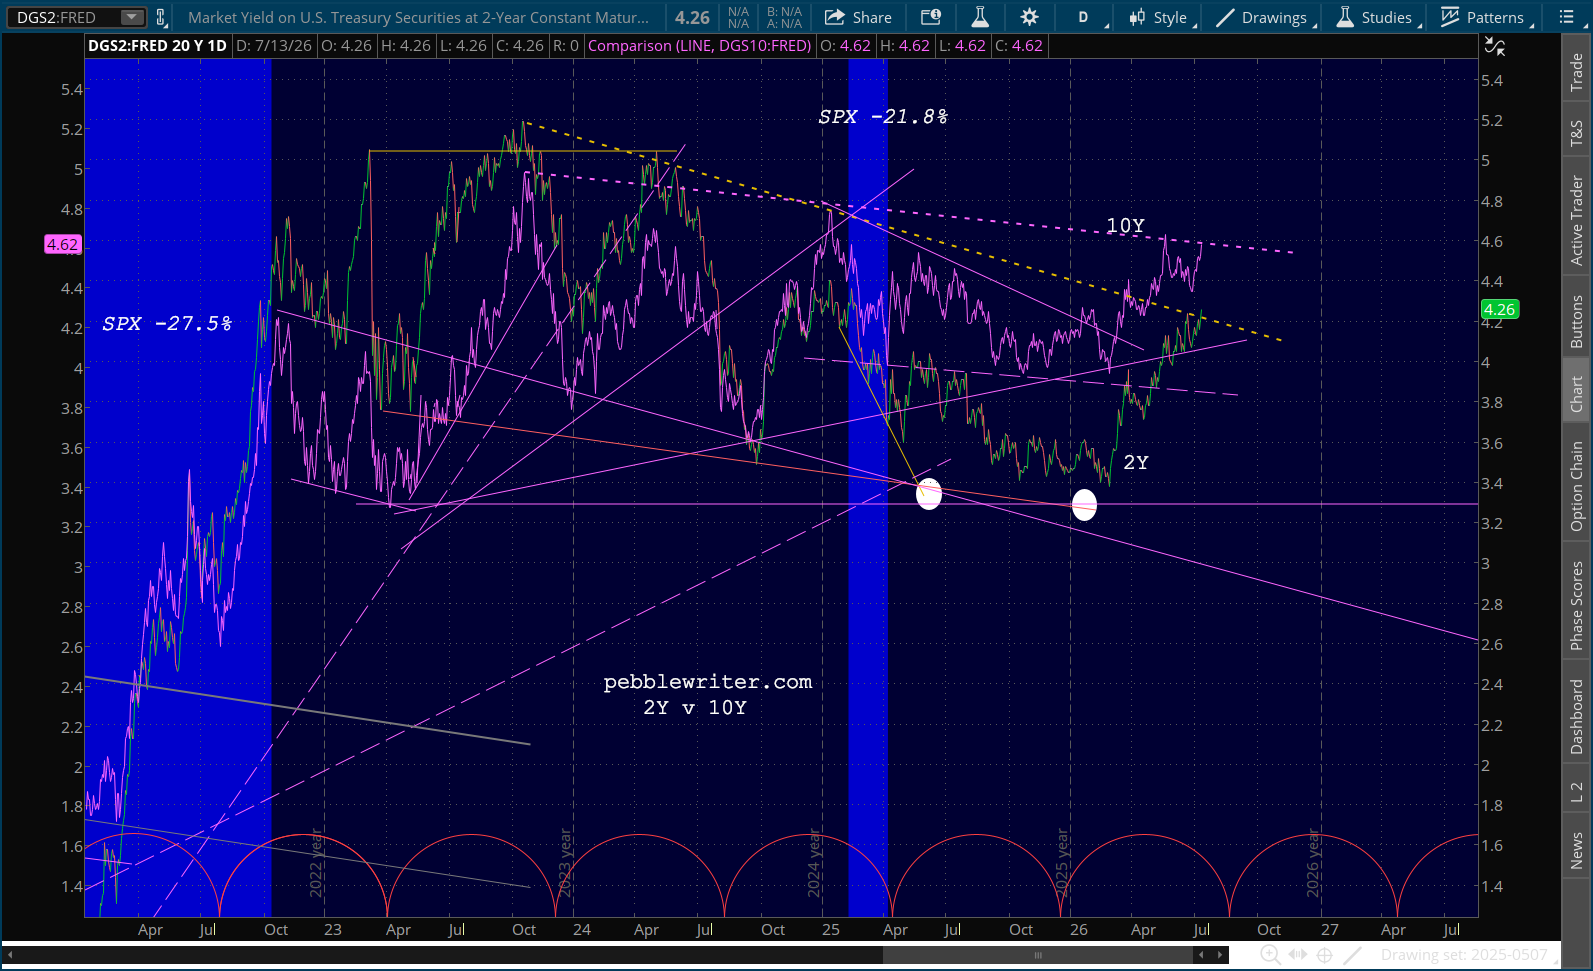
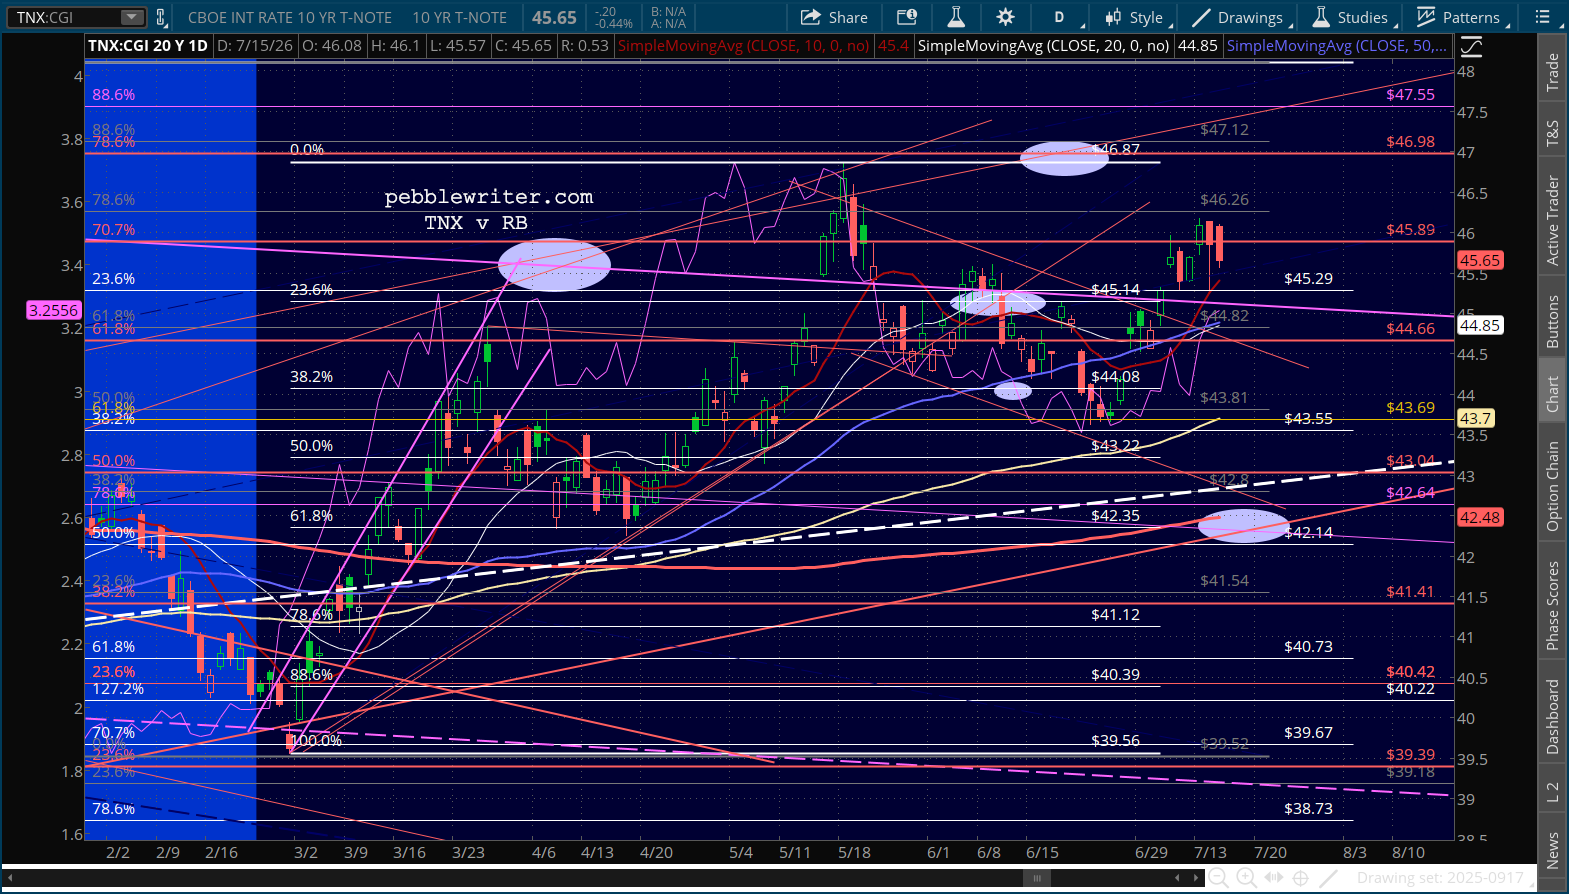
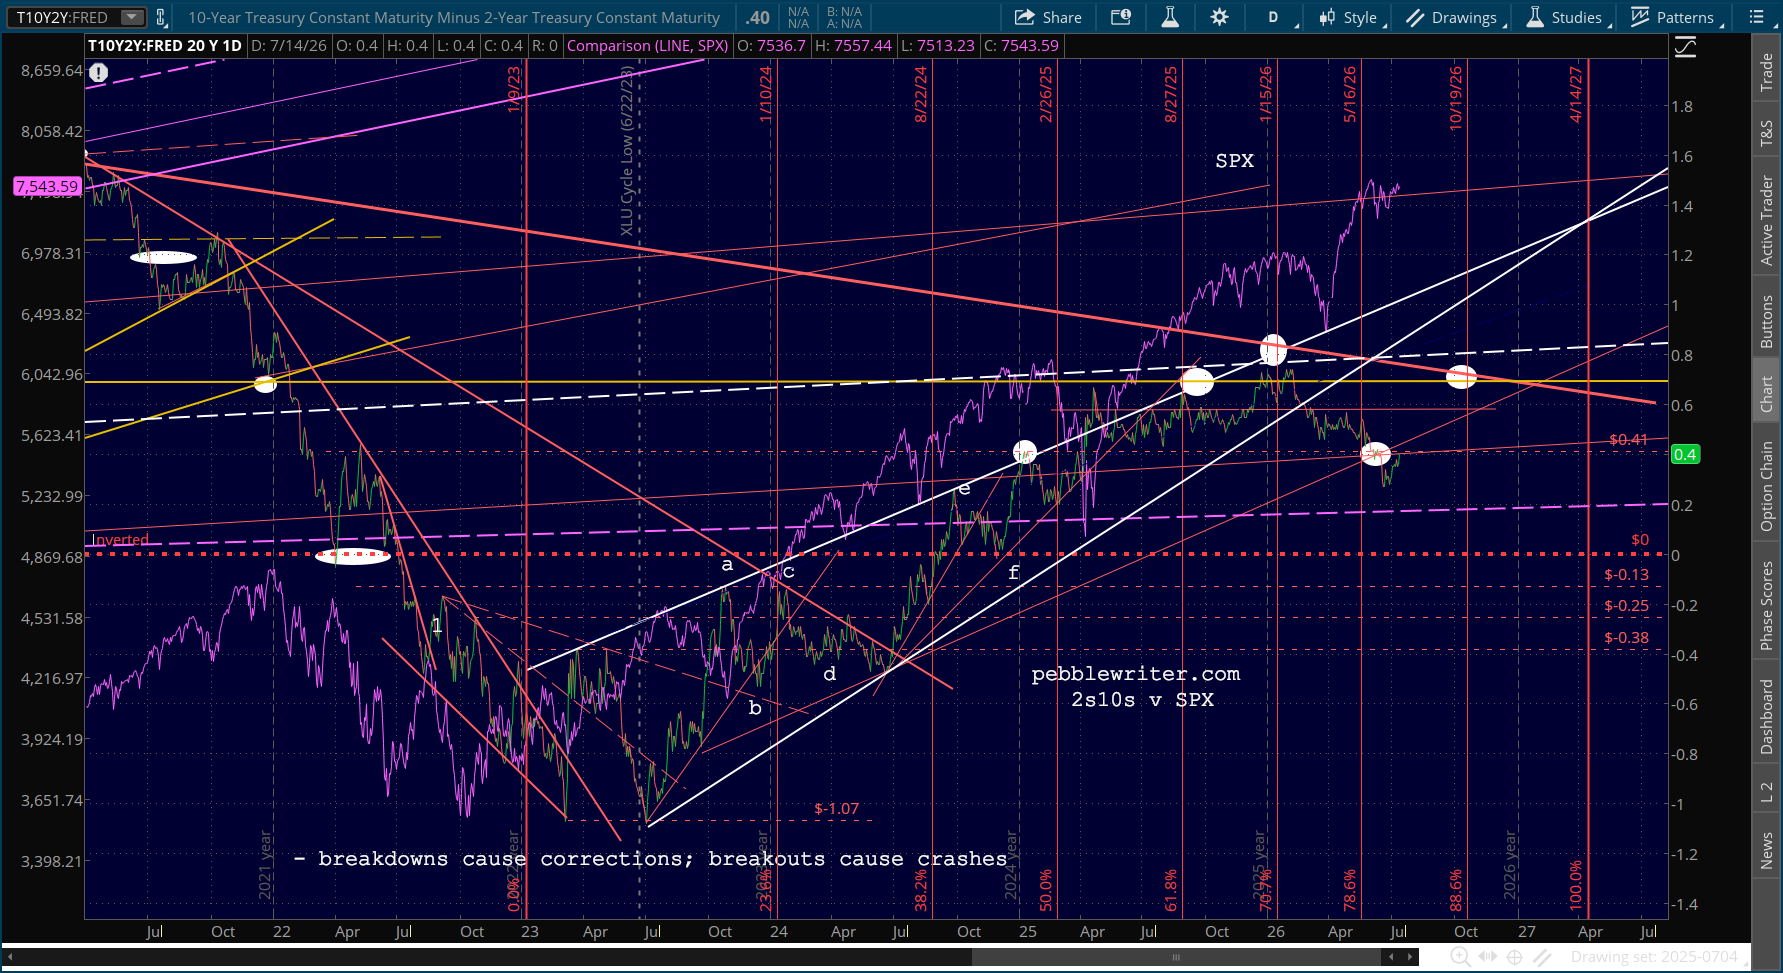
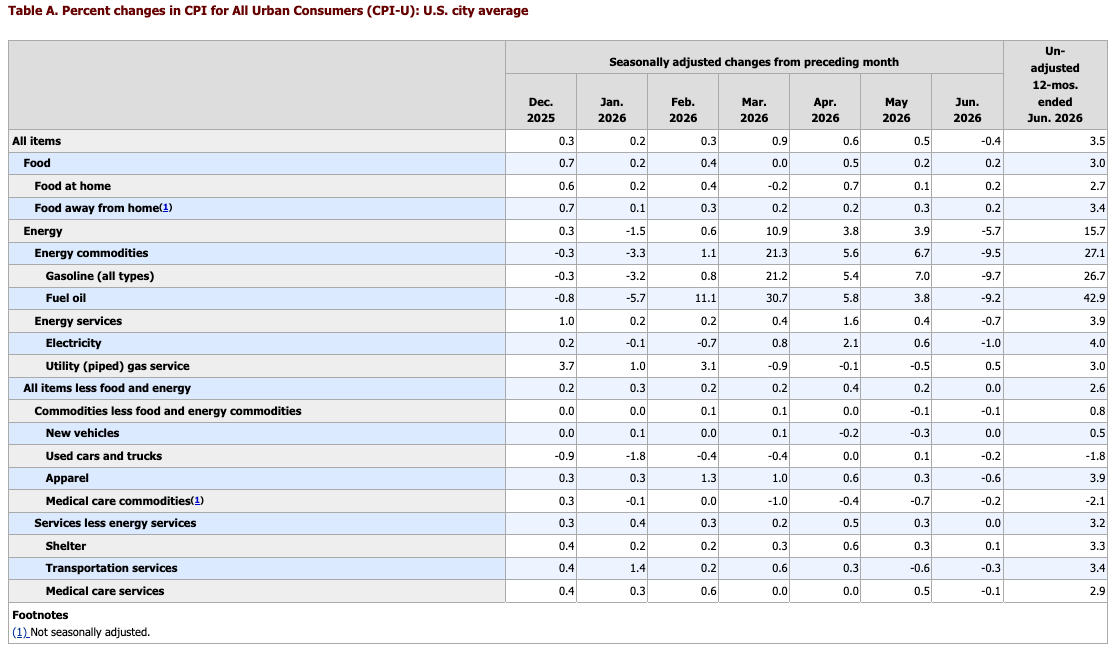
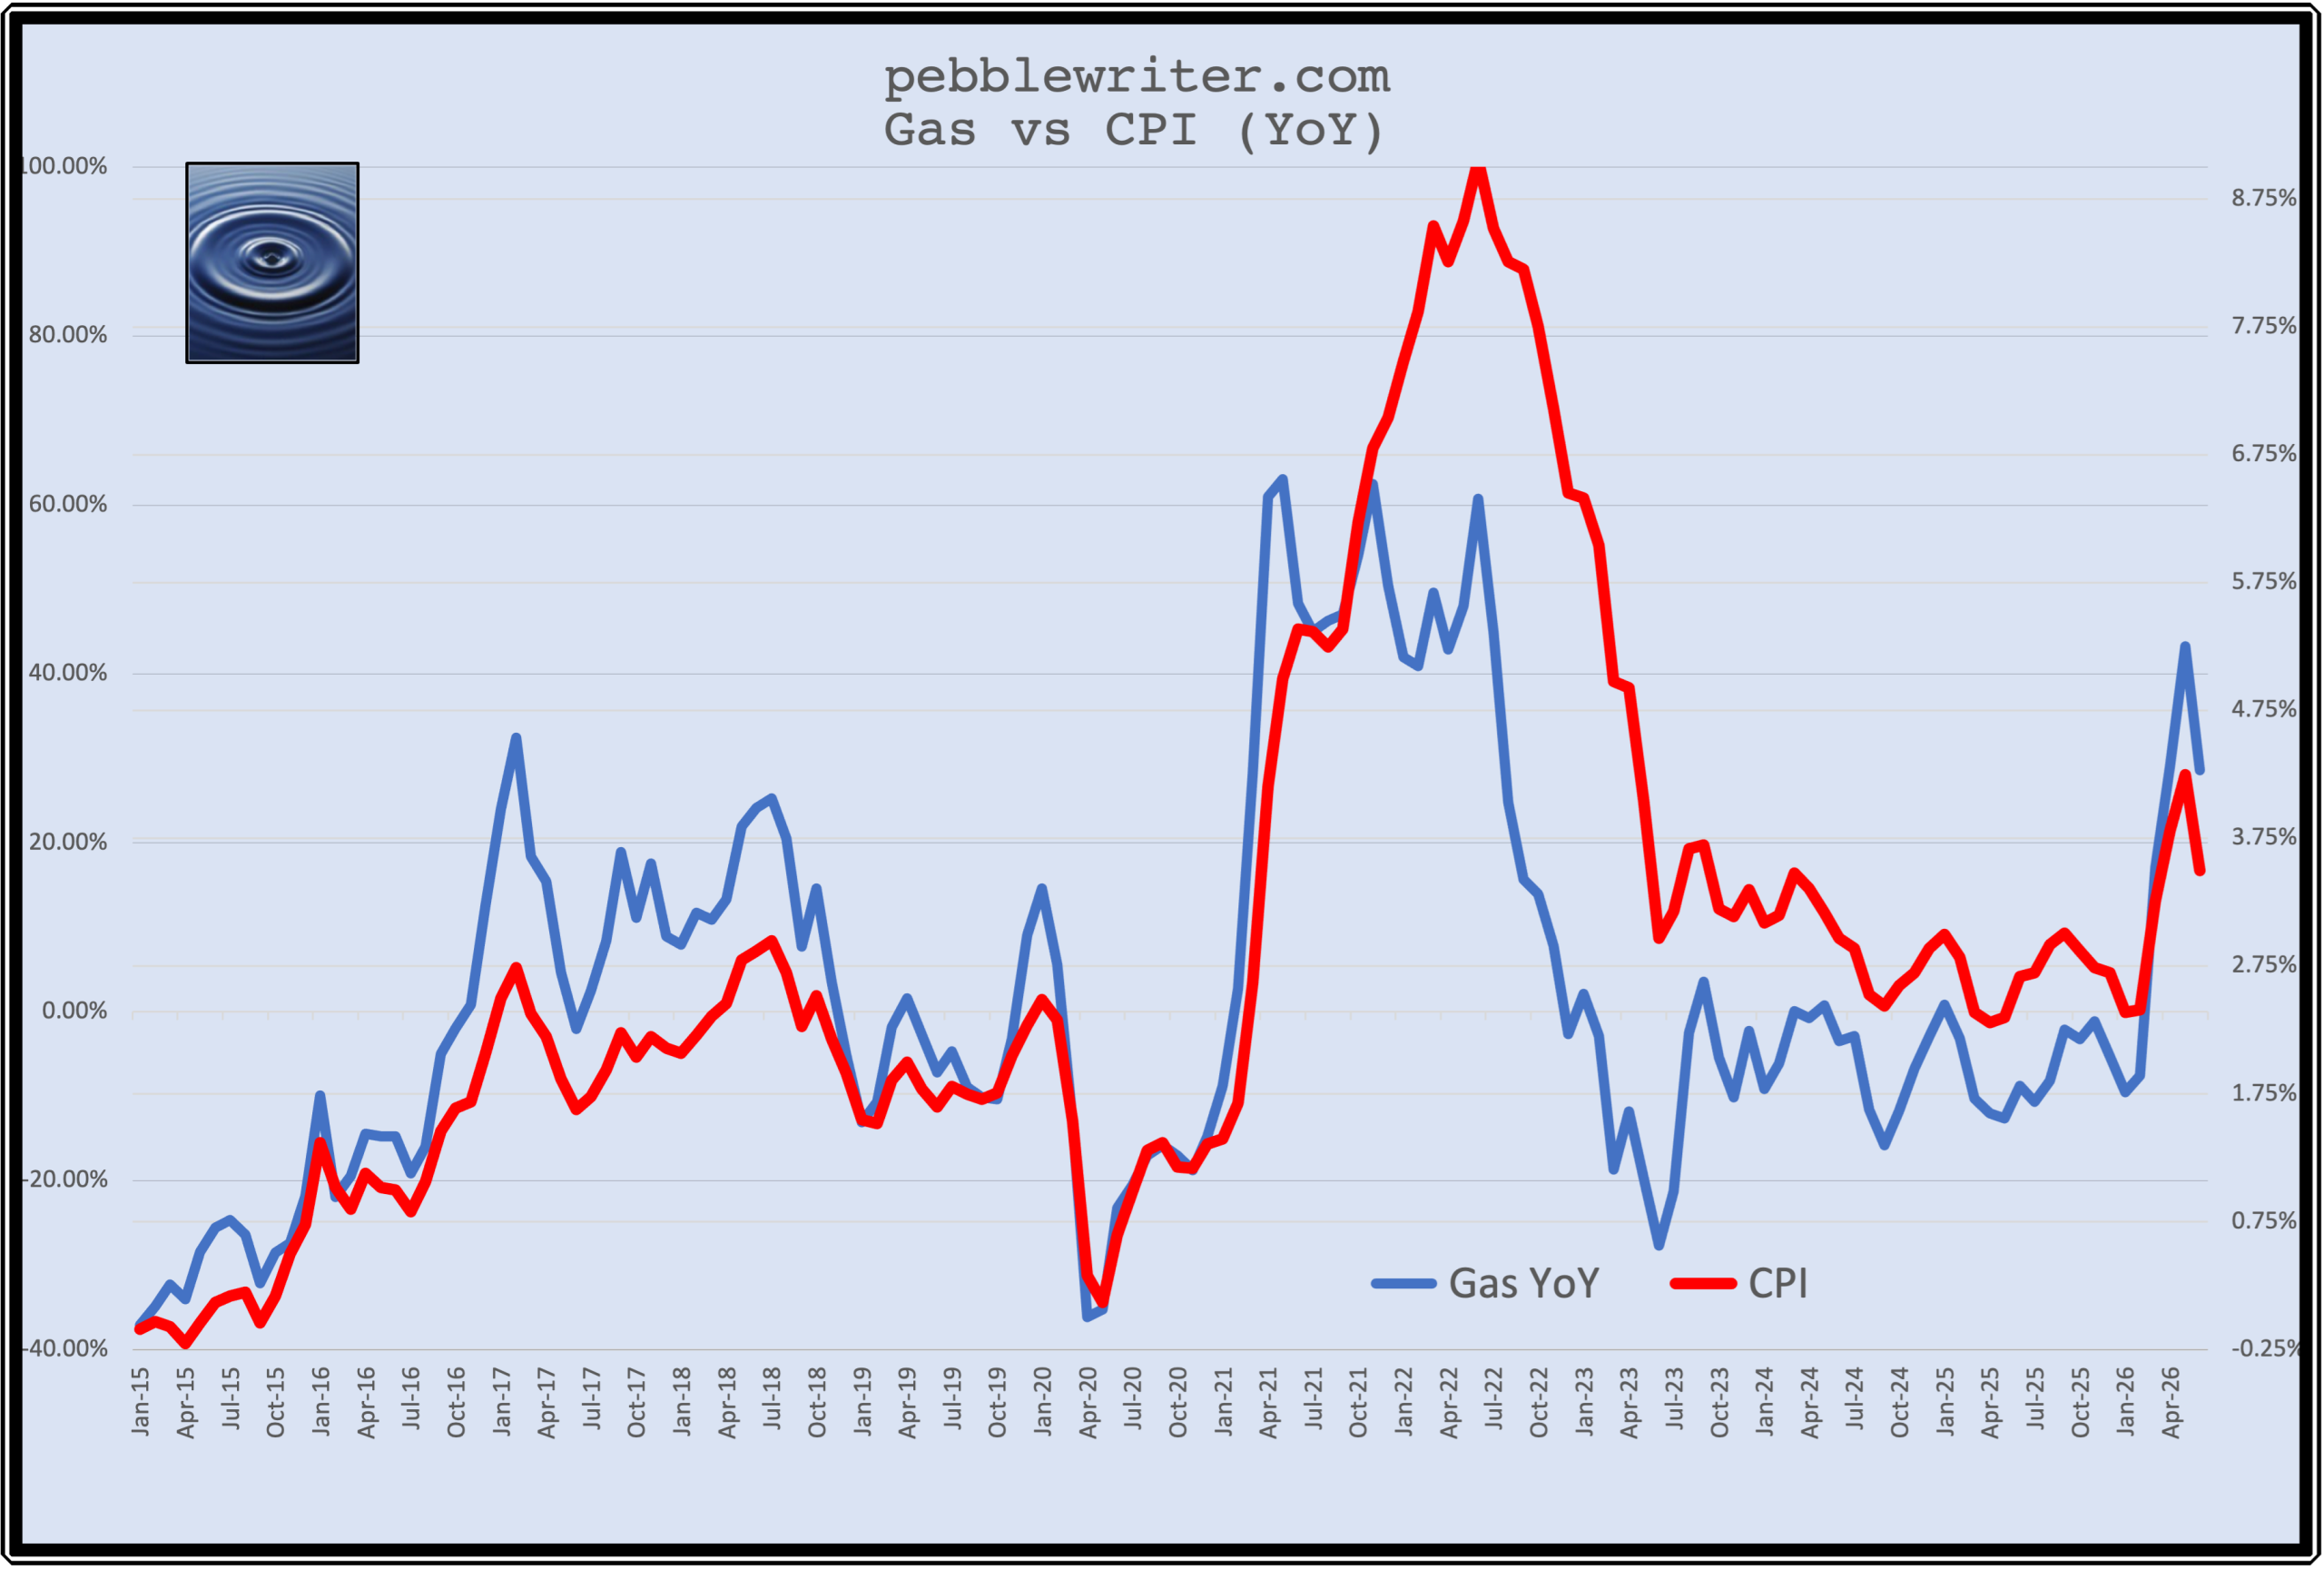
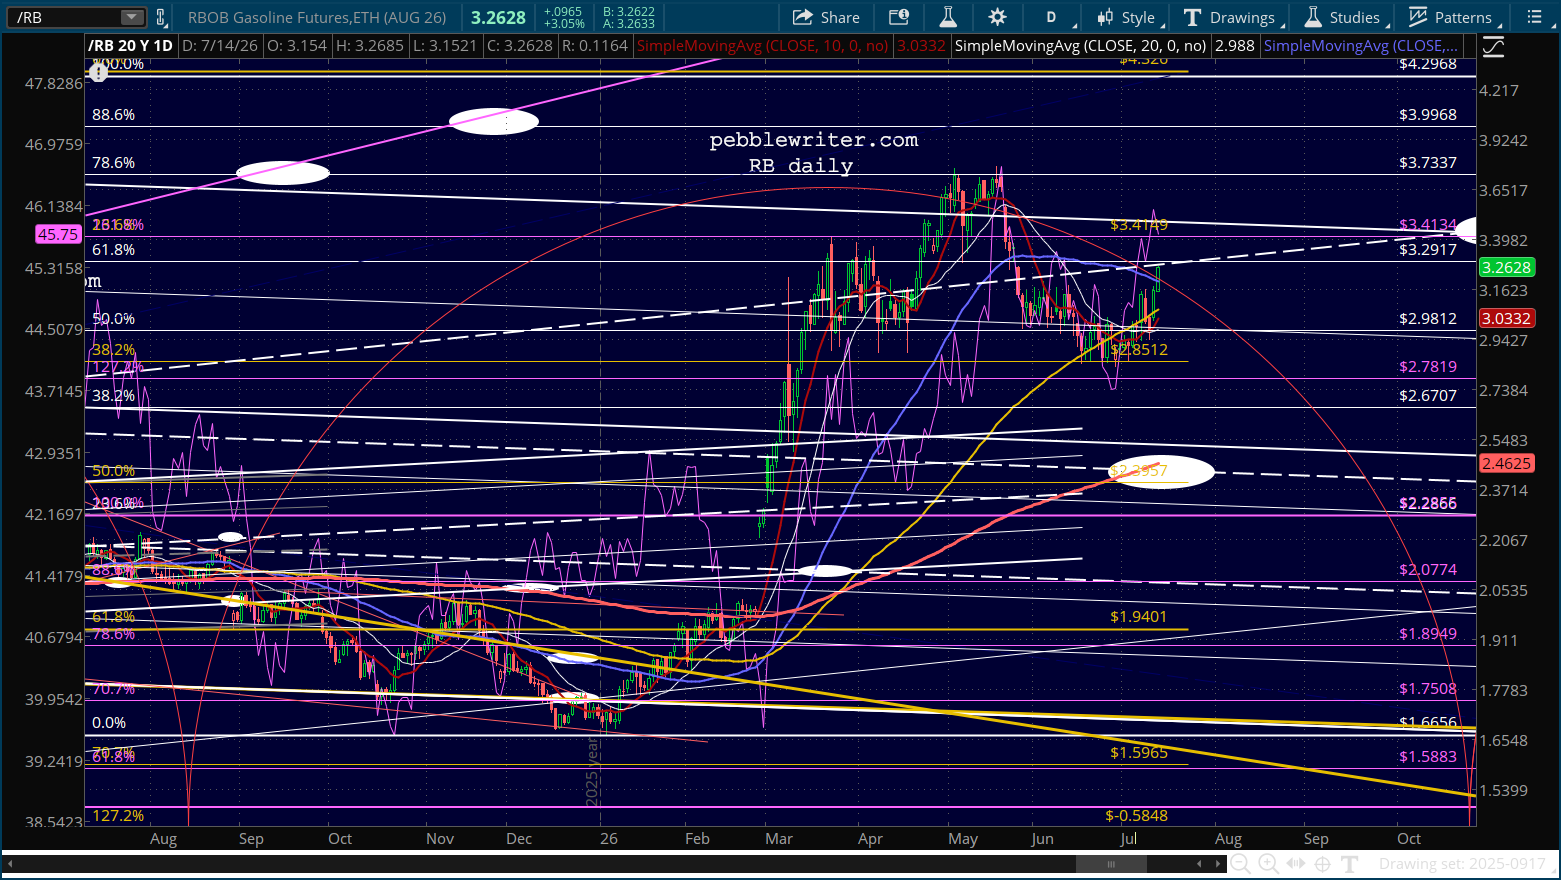
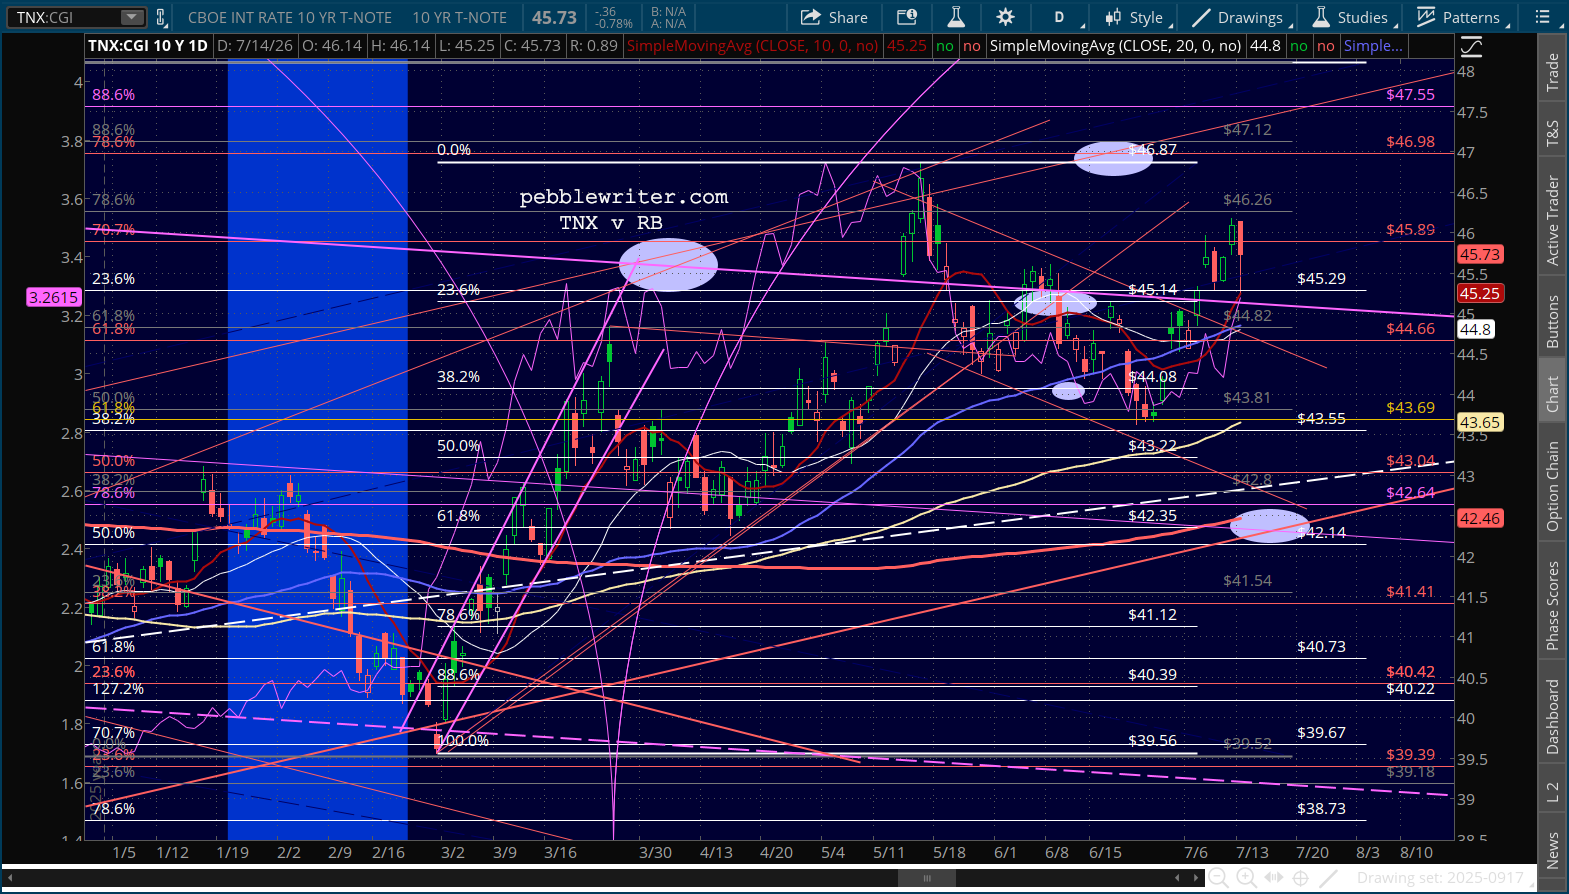
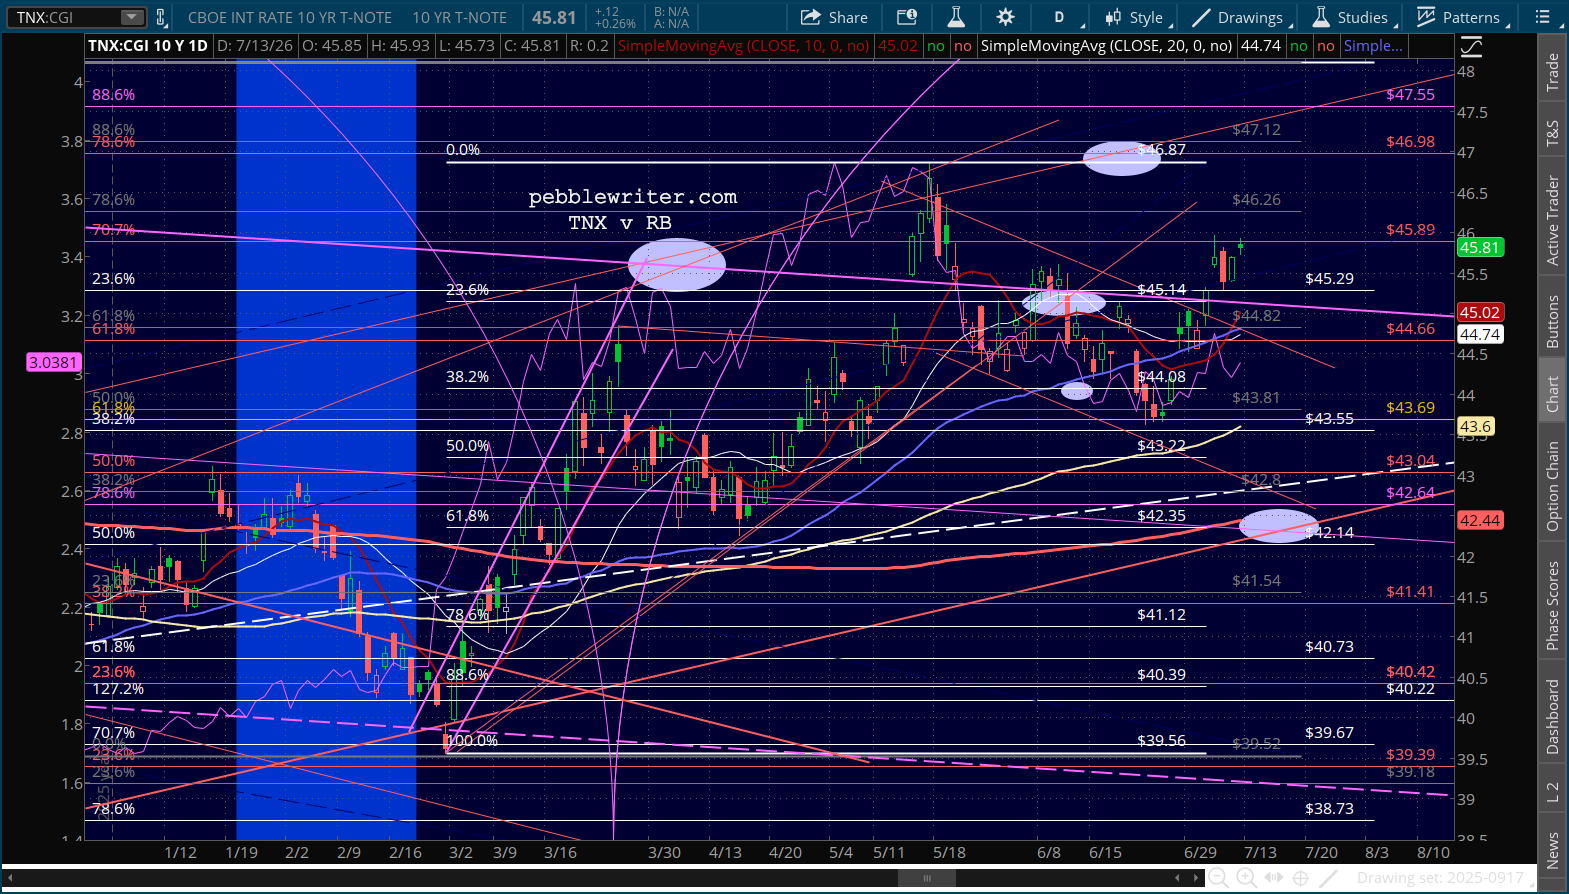
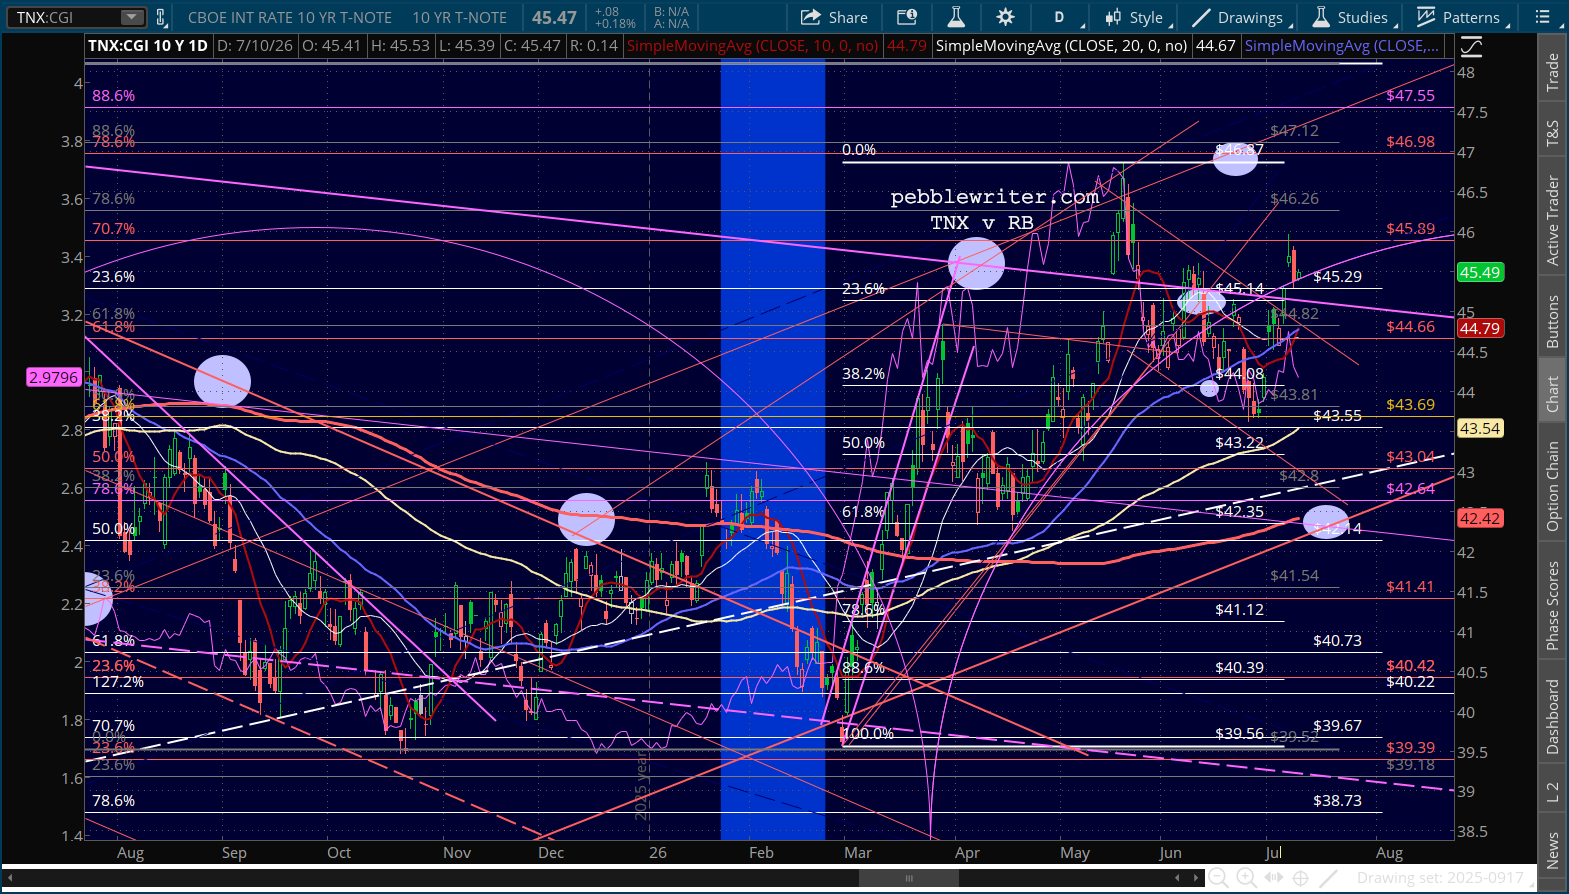
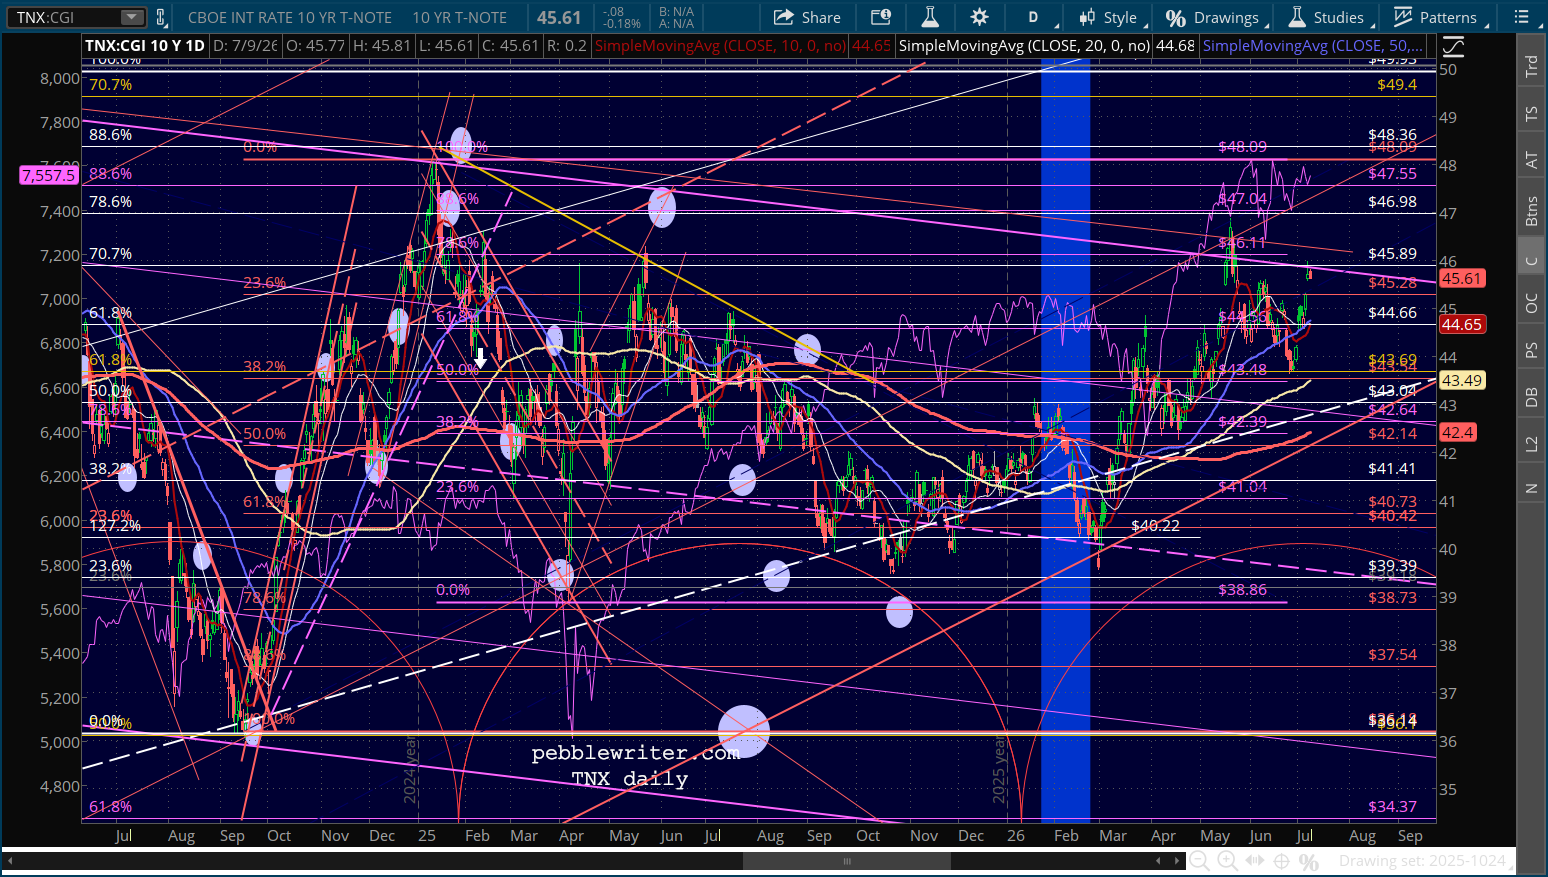
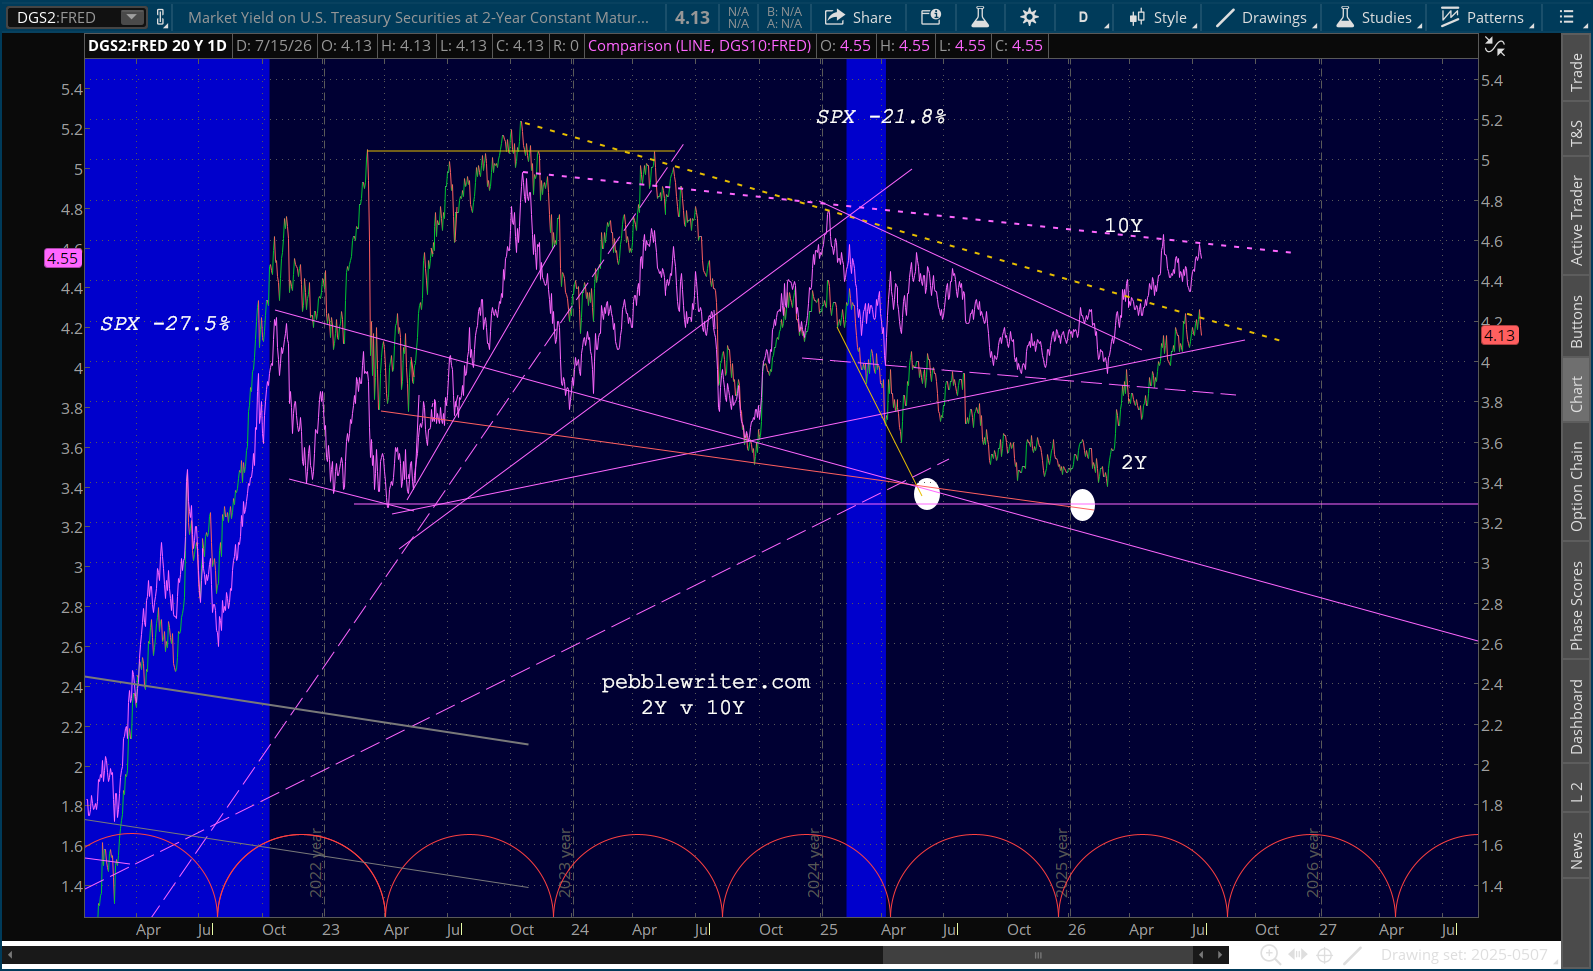
…and the 2s10s’ ability to break back above 0.42…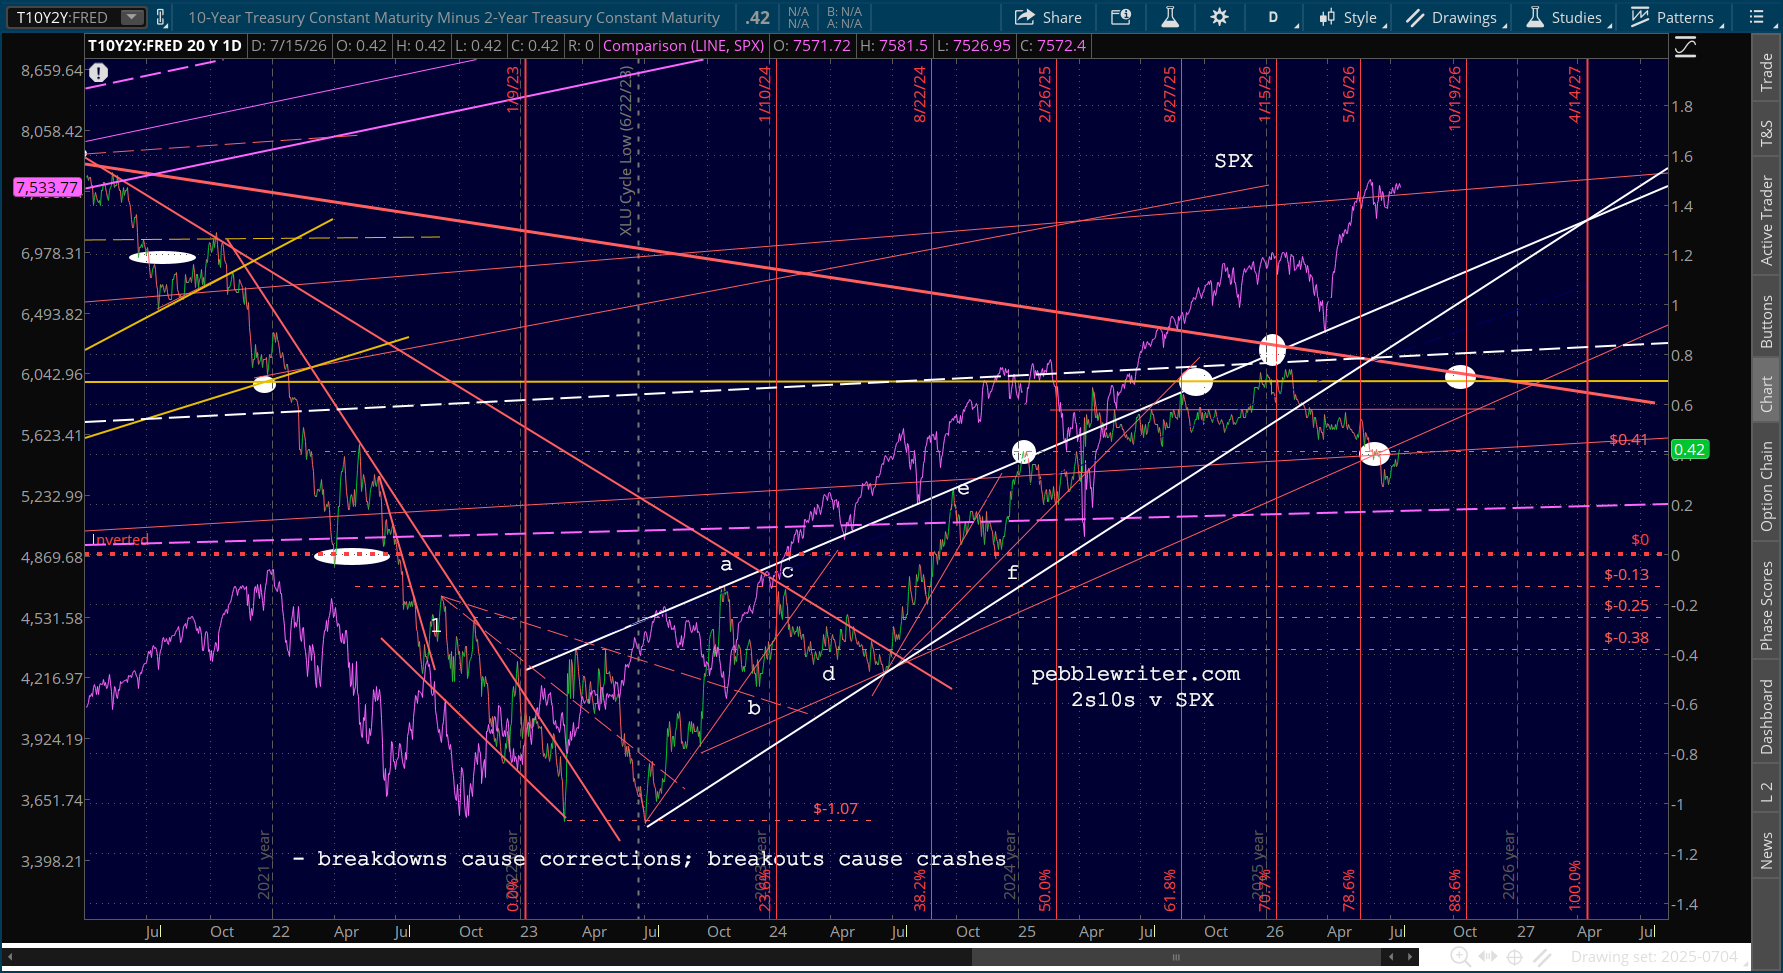 …which basically means that 2Y yields fall faster than 10Y yields — a likely scenario given the ongoing inflation problems.
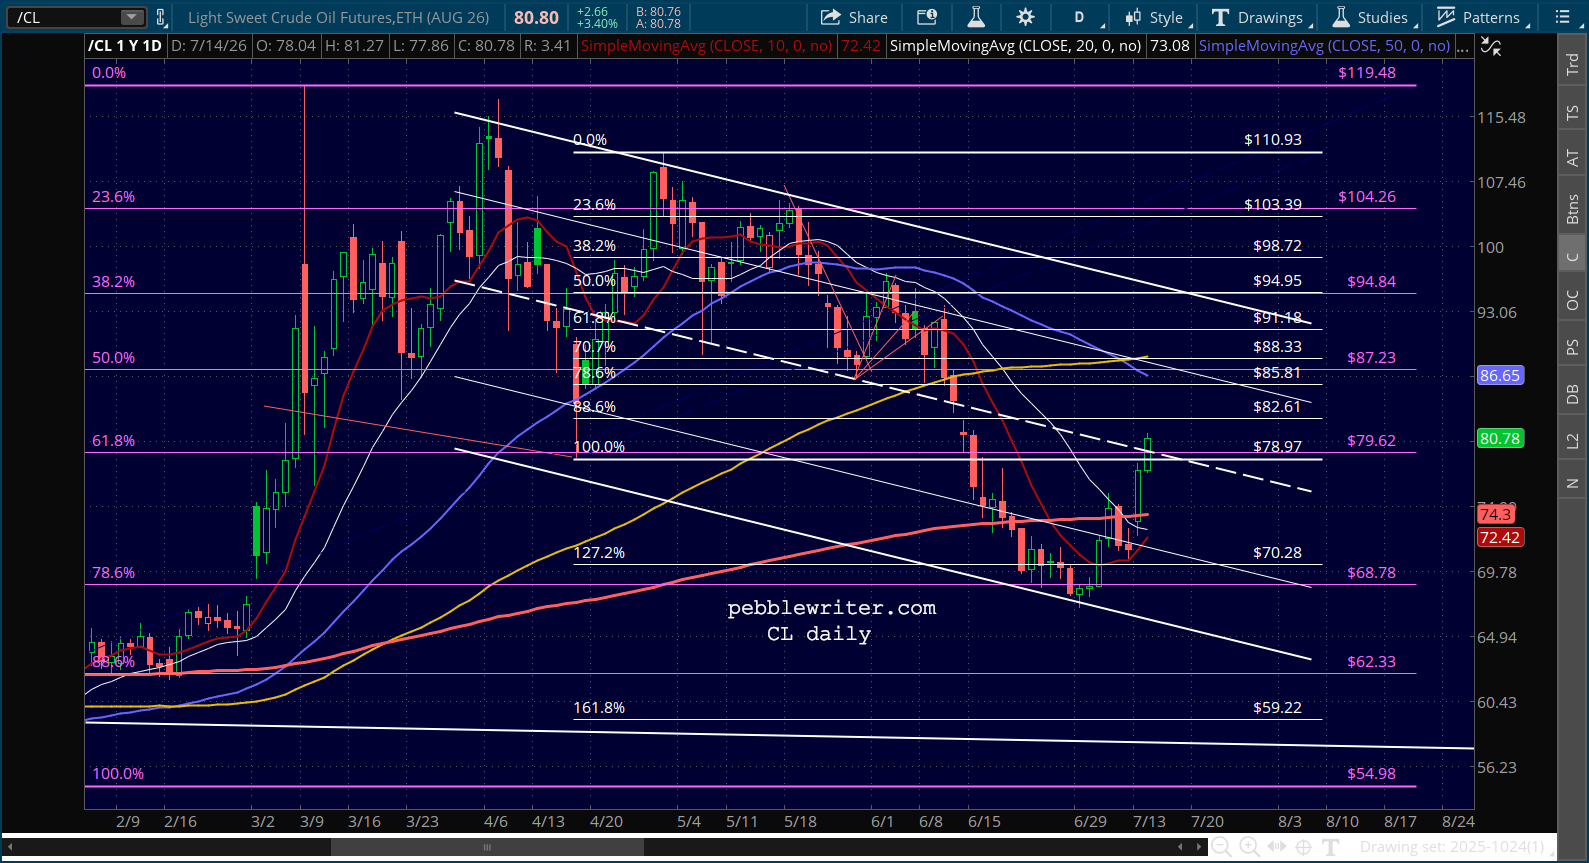
It would help if Trump could bring himself to disengage from his war on Iran. But, he seems much more focused on engineering a midterm win — which is even more unlikely given the inflation that his Iran War is generating.
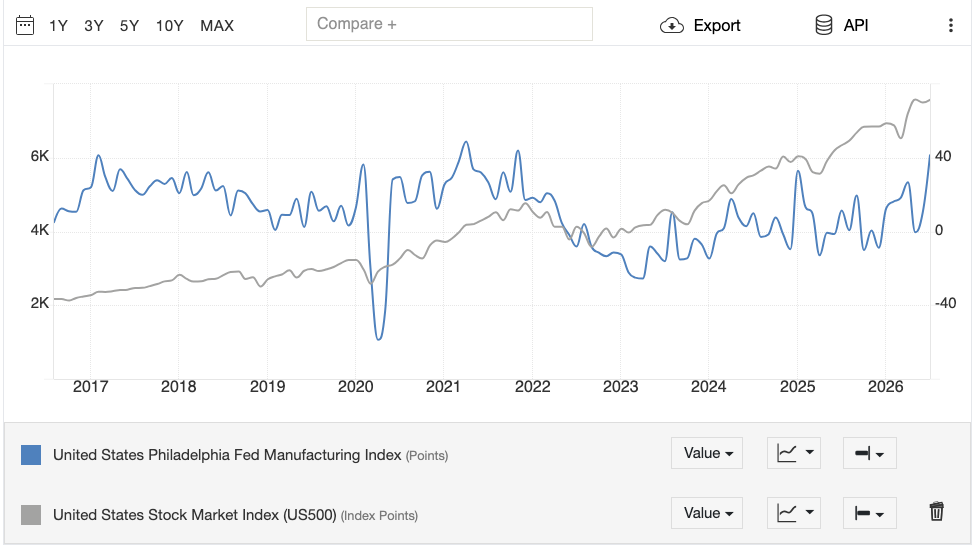
My research shows an average August return since 2000 of about 0.4% – essentially flat – with a range of -6.4% (2001) to +7.0% (2020.) The average drop from the summer highs to the August lows, however, is about 6%.
But, August is rarely the low point in these selloffs. Seasonal weakness historically bottoms in late September/October. So, an August low is often undercut a few weeks later.
Stay frosty.