

To quote the great Yogi Berra, “it’s tough to make predictions, especially about the future.”
But, there are a number of important themes that should drive markets in 2024. The elephants in the forecasting room are the so-called Magnificent Seven (AAPL, GOOGL, MSFT, AMZN, META, TSLA and NVDA) which soared 105% in 2023 versus the S&P 500’s 24%.
These seven stocks make up roughly 30% of the S&P 500, so even that index’s returns are suspect. Without the Mag 7, SPX gained only 9.94%. So, don’t chastise your investment manager if they returned only 10% last year by exercising prudent diversification.
 Will the rest of the market catch up to the Mag 7 or will the Mag 7 “catch down” to the rest of the market? Investors tempted to join the party and pile into the Mag 7 should remember that, in 2022, these same stocks plunged 40% compared to the rest of the market’s 12% losses.
From a fundamental standpoint, their price to earnings multiples are historically quite high, meaning that any disappointments will be dealt with harshly. We saw this last week with AAPL. While SPX fell as much as 2.2% from its highs, AAPL was off a whopping 9.7%.
 We’ll spend the next several days examining the equity charts for clues as to what to expect in the year ahead. We’ll also zero in on the currencies, commodities and interest rates which greatly influence equity values.
As always, our goal is to get most them right most of the time, as we did in 2023 [see: The Year in Review – 2023.] Chart patterns and technical analysis are great tools for doing so. We’ll start with a very obvious chart pattern for SPX which should make all the difference between a stellar year or a slump. It ties in with another chart pattern dating back to the Great Depression.
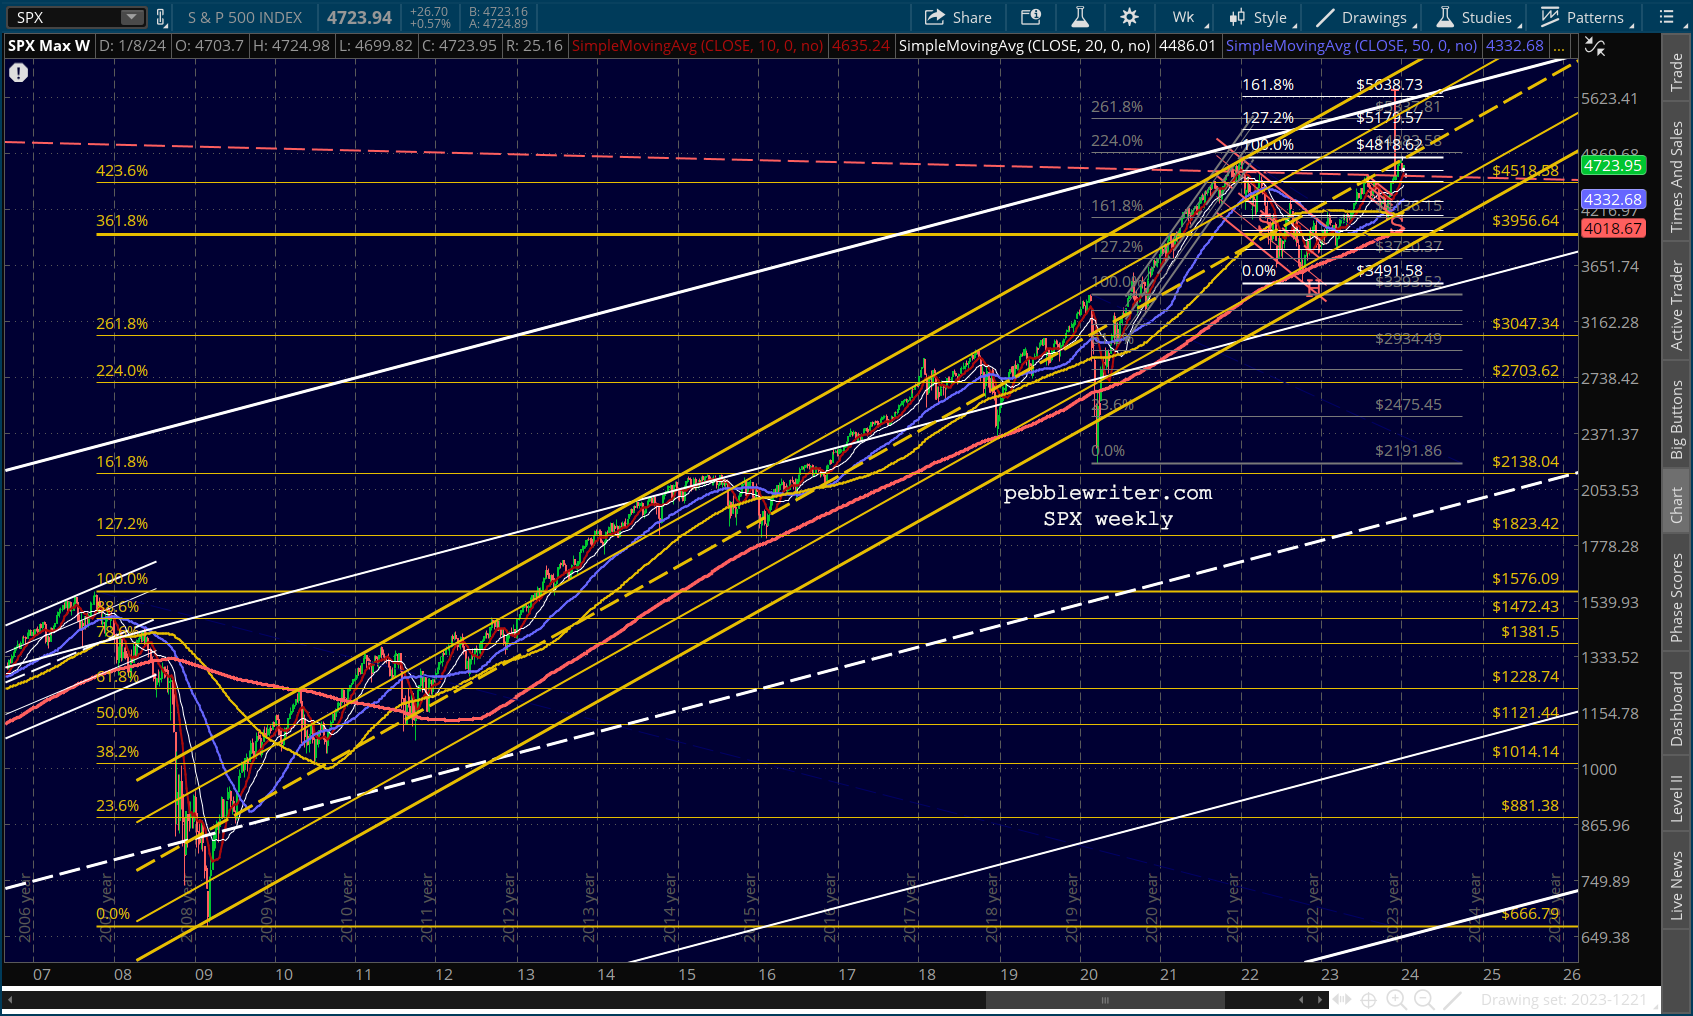
The most important chart pattern for SPX is the large Inverted H&S Pattern which completed on Dec 11.
 continued for members…
It points to 5727 (a 24.5% rise from the neckline) and, if it’s to align with the large rising white channel, would reach its target in late June 2024.
 It’s ability to play out is especially important in light of the large white and yellow channels which were recently tested as seen on the monthly chart going back to before the Great Depression.
 A close up says the same thing, that a return to the top of the white channel and yellow channel .786 line could occur around June 2024.
 The timing is critical because a return to the top of the rising yellow channel would break SPX out of the huge white channel.
 The ES version shows a target of 5810, right next to the white 1.618 extension. It intersects with the yellow channel top around August.
 We’ve had many IH&S patterns over the years. The one set up by the Dec 2018 correction promised a 20% gain, which it accomplished in about 10 months.
 It’s important to note, however, that it wasn’t exactly a layup. SPX not only broke back down below its neckline three times, it broke below its SMA200 in May 2019 [see: May 29 market news] following what looked, at the time, like a very bearish double top.
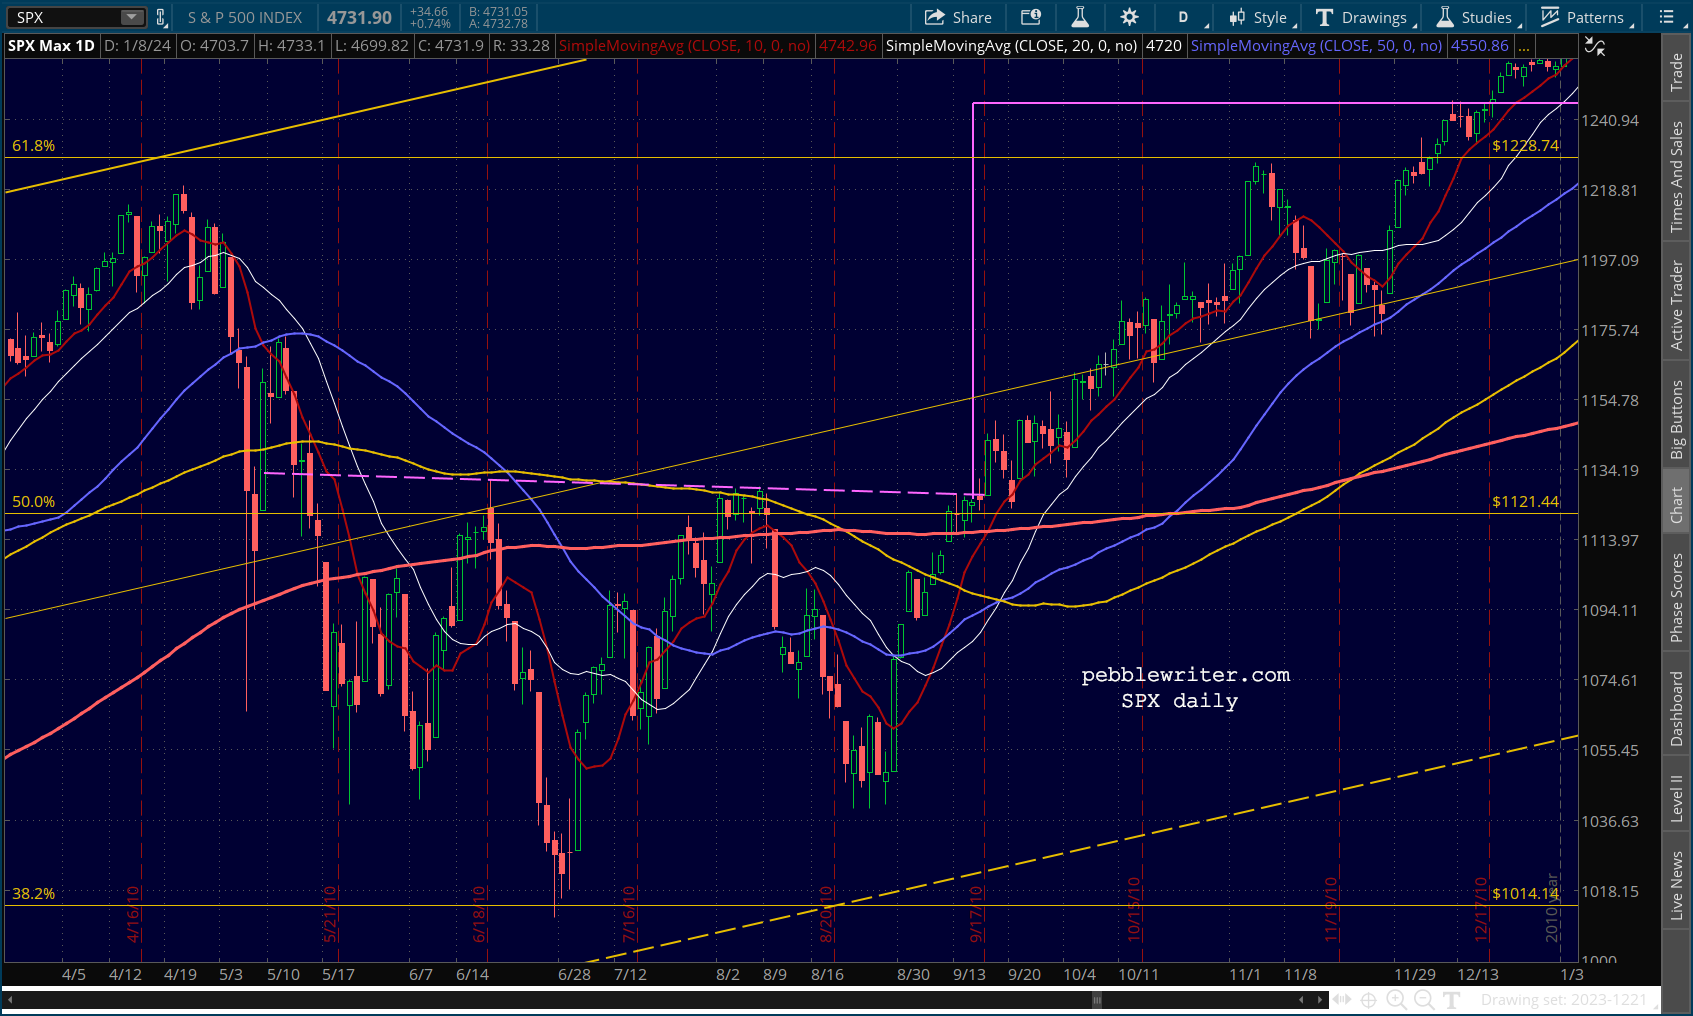
The previous one in 2016 promised a 14.4% return, which paid off 11 months after completion. This one was also problematic in that SPX fell below its neckline a second time in November 2016 – tagging its SMA200 in the process.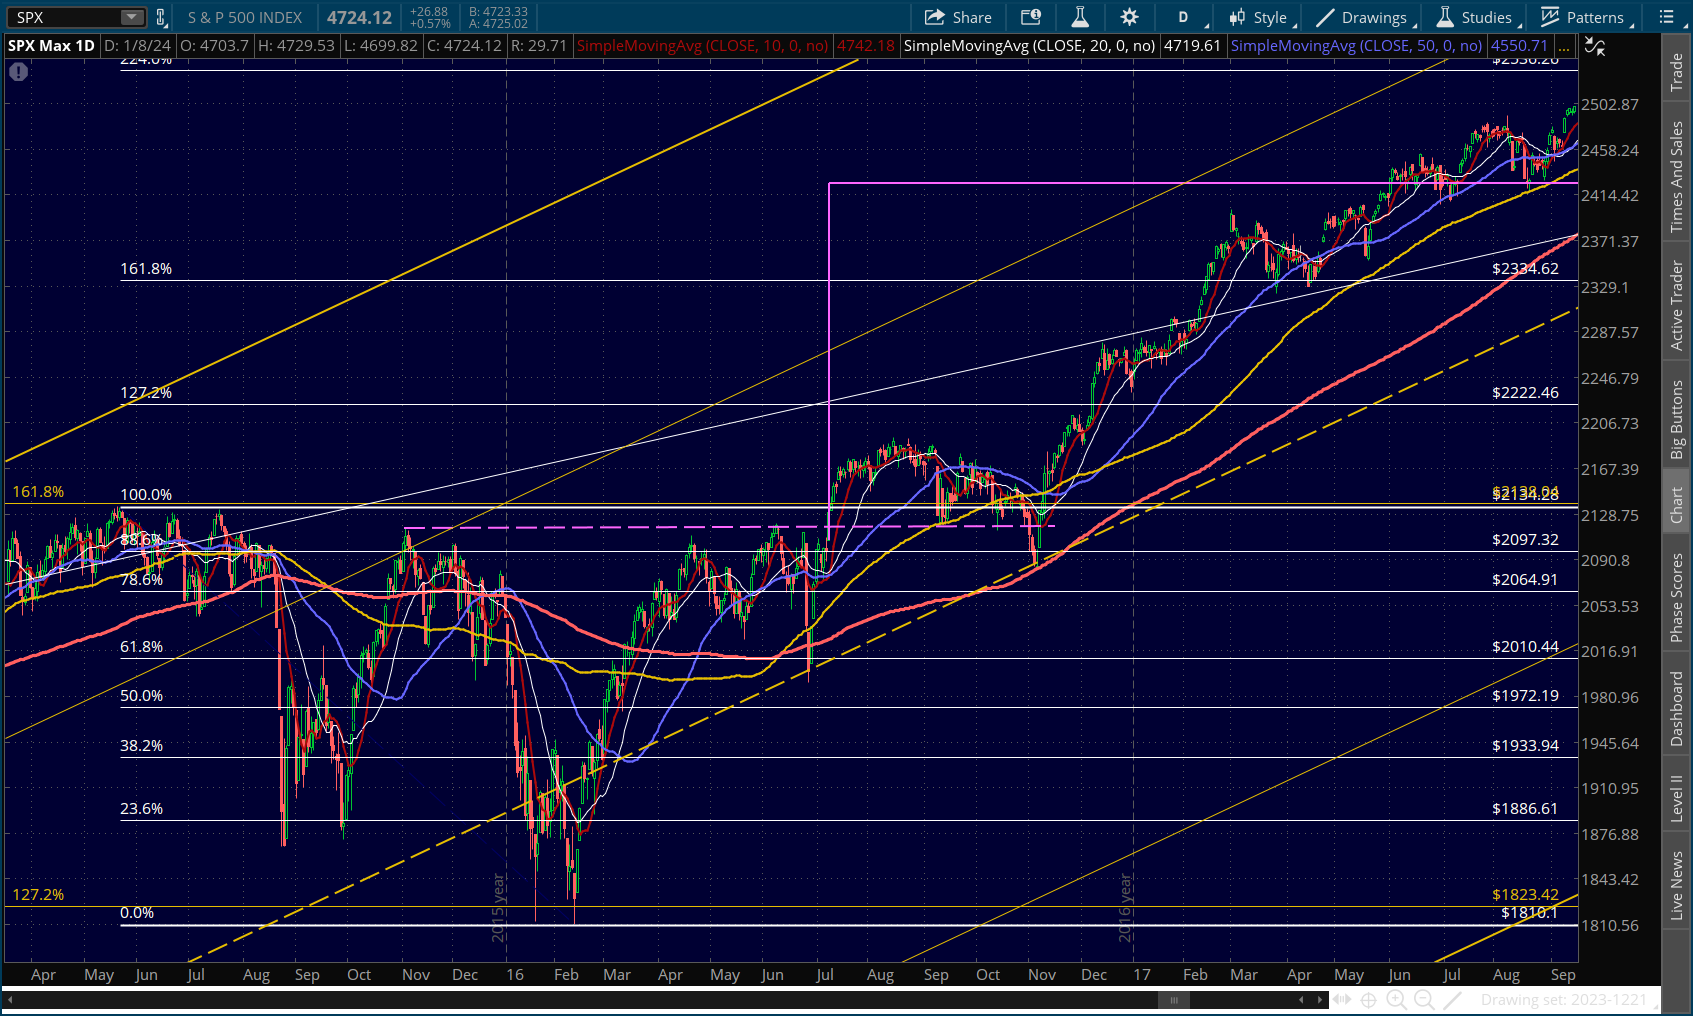 The previous IH&S occurred in 2010, though it promised only a 10.8% gain from the neckline. It also behaved quite differently from the other IH&S patterns discussed above in that it backtested its neckline only 4 days after completing and then reached its target only three months later.
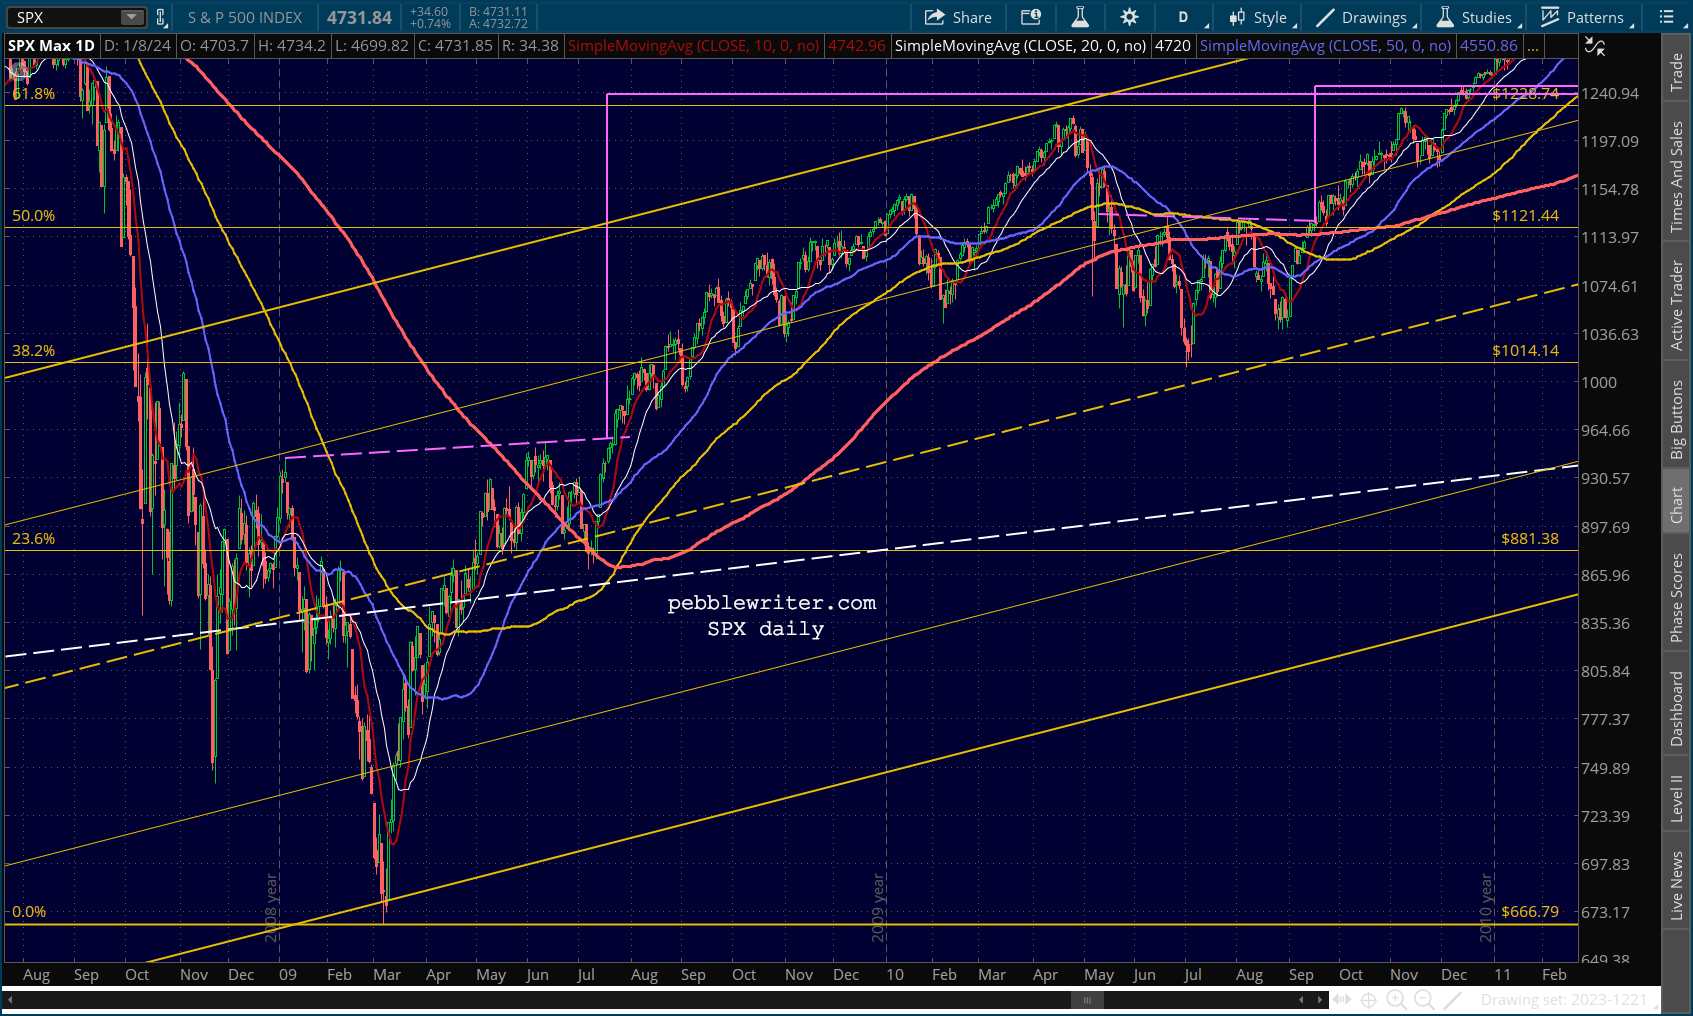
 The last IH&S since the GFC was the 2009 one which promised a 29% return from the neckline. Note that this target very nicely overlapped with the target of the 2010 IH&S pattern as well as the SMA200.
It came within 20 points of its target 9 months after completing, but took a full 17 months to reach its actual target.
It never did backtest the neckline, though it came within 5% of it in October 2011 (long after it had paid off – so it doesn’t really count as a neckline backtest per se.)
 Bottom line, there has not been an IH&S pattern failure since 2009, when the Fed became much more involved in guarding the markets via not only their interest rate policy but public comments, currency manipulation, and – in my opinion – derivative manipulation.
Even the most troubled IH&S patterns such as the 2018-19 one ultimately paid off. The average time from completion to payoff of the three larger patterns was 10 months. The current one is comparable in size to those three, so we should assume that it will reach its target of 5727 by the end of the year – presumably as rate cuts are taking effect.
As to the need for a backtest of the neckline at about 4600, it is more common than not but there is no requirement that it happen. My personal belief is that we will get one as the SMA50 – currently at 4551 – reaches 4600. This looks to happen sometime between Jan 11-16. We have CPI coming out on Thursday and PPI on Friday; either has the potential to move markets the 3% necessary to reach 4600.
Both SPX and ES appear to have paths to their SMA50s. Though ES’ chart also shows that it has already come quite close to completing a backtest.
 Taking a stab at the path higher, there is definitely a possibility that October works just as well as June for the IH&S payoff.
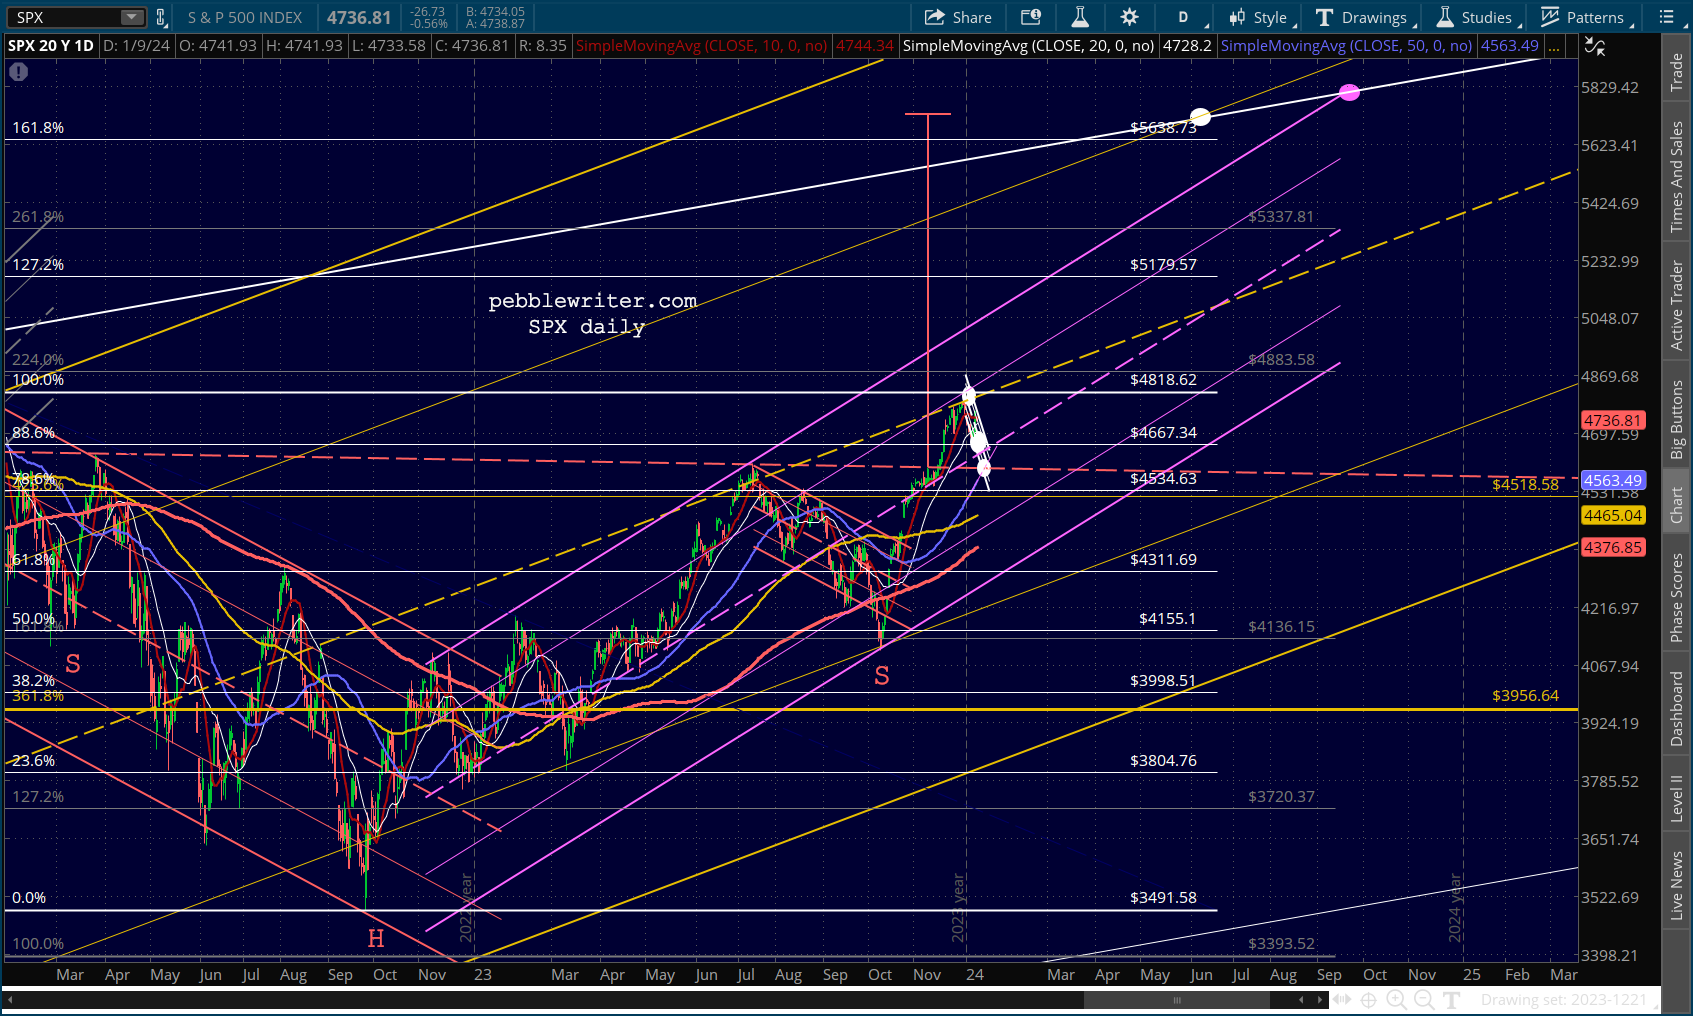 What if the IH&S pattern fails for the first time since the GFC? I don’t expect it to unless something goes really wrong with the Fed’s plans (e.g. an oil price spike due to widespread war in the Middle East), but the neckline should provide a good line in the sand. A drop below SPX 4600 would open the door to lower backtest targets such as the SMA200 (currently at 4376 and rising rapidly) around Feb 15-28.
Oil & Gas:
Since CPI and PPI come out in a few days, we’ll tackle oil and gas next. They’re the biggest wild cards, so please understand that this is a total crap shoot.
CL spent from Mar 2022 to July 2023 traveling from the top of the rising purple channel to what should have been the bottom of that channel at 53.87 – the red .618.  OPEC+ took a stand (output cuts), however, in early May 2023. CL ranged 6.2 on May 4 and began a slow, choppy recovery that broke out of the falling white channel that originally targeted 53.87.
  CL constructed a nice, clean, rising red channel that lasted until Nov 2023 before breaking down. That breakdown very nearly broke down from the rising purple channel bottom, and is still in the “will it or won’t it” phase.
The sharp decline from Sep 27 to Dec 12 made it possible for the 10Y to plunge over 100 bps and stocks to soar into year end. At 4%, the 10Y is threatening to rebound along with CL. Such a move would send yields higher and would probably be detrimental to stocks.
There is a very large H&S pattern in CL that would complete at about 65.50. It’s kind of nonsensical, as it would target 0. And, 65.50 would also backtest the top of the falling yellow channel. It’s hard to imagine OPEC+ allowing CL to drop below 65.50, and there’s plenty of reason for it to bounce.
But, central banks which are relying on being able to drive interest rates lower might see things differently. Can they achieve lower rates without further drops in oil/gas?
The chart below compares gas prices and CPI and shows that if gas were to level off at current prices, CPI would still continue to be under modest pressure to decline.
 Headline CPI was 3.14% in November and will likely come in at or below 3% for December, with a continuing decline for the next 10 months as long as oil/gas prices remain steady – producing increasingly negative YoY comps. [note: CPI is out, headline rose to 3.35%]
In other words, there is no need for a further decline as long as other inflation categories play along. But, it’s important that there be no sharp increases either.
Core CPI is theoretically more important to the Fed, but it’s plain old CPI that grabs headlines and determines elections. So, whether or not core CPI drops below 4% – where it’s been stuck in October and November – isn’t all that important except in terms of changing expectations, which are already stacked in favor of rate cuts starting very soon.
The picture for gas is quite similar. RB has reached the bottom of the rising purple channel and will likely stabilize here – at least if OPEC+ has anything to say about it. 
 Again – lots of wild cards involving the Israel-Hamas war, the Red Sea problems, etc. But, in the absence of those issues becoming more problematic, CL and RB should remain fairly steady, with a slight bias toward higher unless economic activity slows markedly.
In my opinion, however, this upside bias isn’t enough to make a very compelling case for investment. I would consider a long position if CL or RB can push back above their SMA50s, but with fairly tight stops.
Inflation still has a housing problem which will prove very difficult to solve. If CPI remains above 3%, it will be because of the shelter component.

This is perhaps a good time to wade into the bond market and see what to expect from interest rates.
First, a reminder of the long-term channels, cycles and Fib levels. The breakout of the falling yellow channel which occurred in April 2022 was partly a function of the huge spike in energy prices following the Russian invasion of Ukraine.
 But, as the comparison between gas prices and CPI above shows, CPI’s drivers broadened to the point where CPI continued rising even after gas prices subsided. Some of the categories became very problematic on their own and have proven to be quite sticky, i.e. they won’t come back down easily.
As discussed above, one category that defies reversion to the mean is housing. Both owners’ equivalent rent and rental costs continue to climb. The Dec CPI report released on Jan 11 shows a 6.5% YoY increase in rental costs and a 6.3% increase in OER. Traditionally, high rates of increase were mitigated only by recessions and real estate market corrections (or crashes.)

 There is a clear positive correlation between interest rates and the rate of rent increases. But, the rent increases have far outpaced interest rate increases – due largely to the massive injection of liquidity into the markets.
 This same phenomenon occurred in the 70’s…
  …and in both the 2000-2003 and 2007-2009 crashes…
 …but never to the same extent as it has this time.
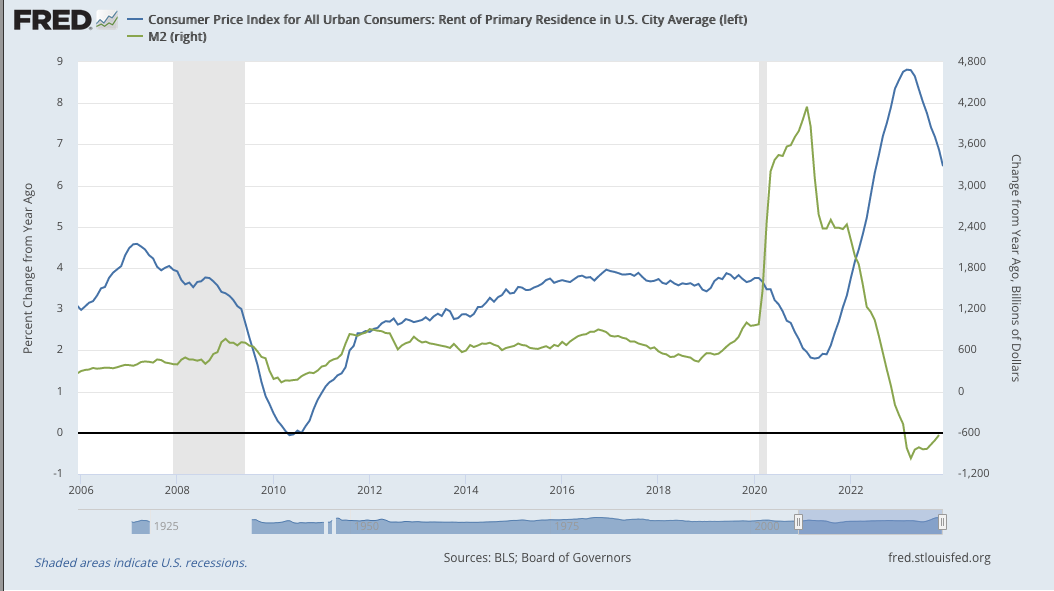 In fact, the previous instances barely register in comparison to the latest. Is it any wonder that real estate and so many other investment assets spiked so much in value?
 The other takeaway from the above graph, of course, is that big rent declines almost always occurred in conjunction with a recession (the shaded periods.)
The 10Y almost always required a big decline in inflation in order to head lower.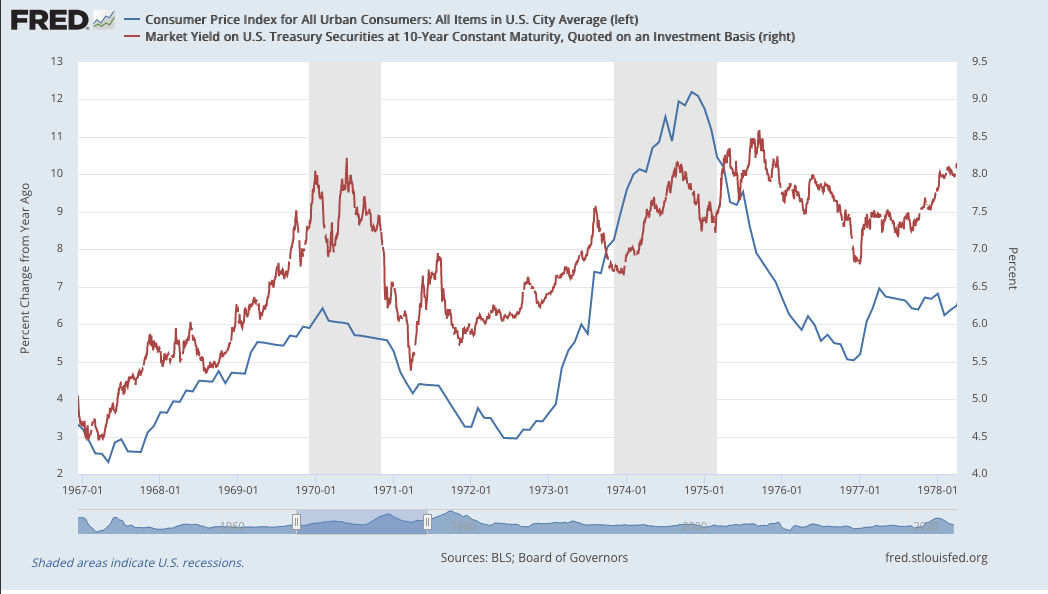
 One of the few exceptions: the 2007 crash, which saw the 10Y plunge as the equity market cratered. This was a so-called fear trade, which the Fed then morphed into an artificially low interest rate environment which essentially lost its connection with inflation until 2020.
 All that being said, what are the chances that inflation will ebb and allow interest rates to slide back down to 2-3%?
If the Fed forces rates lower with rate cuts, it will prop up real estate prices and counteract their inflation fighting efforts.
They can hope that other goods prices drop substantially, but the goods component of CPI is already low. Commodities less food and energy registered a meager +0.2% YoY compared to +5.3% for services – which entails shelter, medical care and transportation: all extremely likely to decline except in the event of a recession or worse.
When the Fed says rates will be higher for longer, we should believe them. They say it because it’s true. Either they give in and allow the recession to proceed or they wait for a long, slow reversion to the mean in inflation.
Here’s what the charts say. The breakout from the falling yellow channel took place in what we’ve drawn as a rising red channel. Note that since the original yellow channel backtest, the 10Y has had trouble dropping back through the red channel midline.
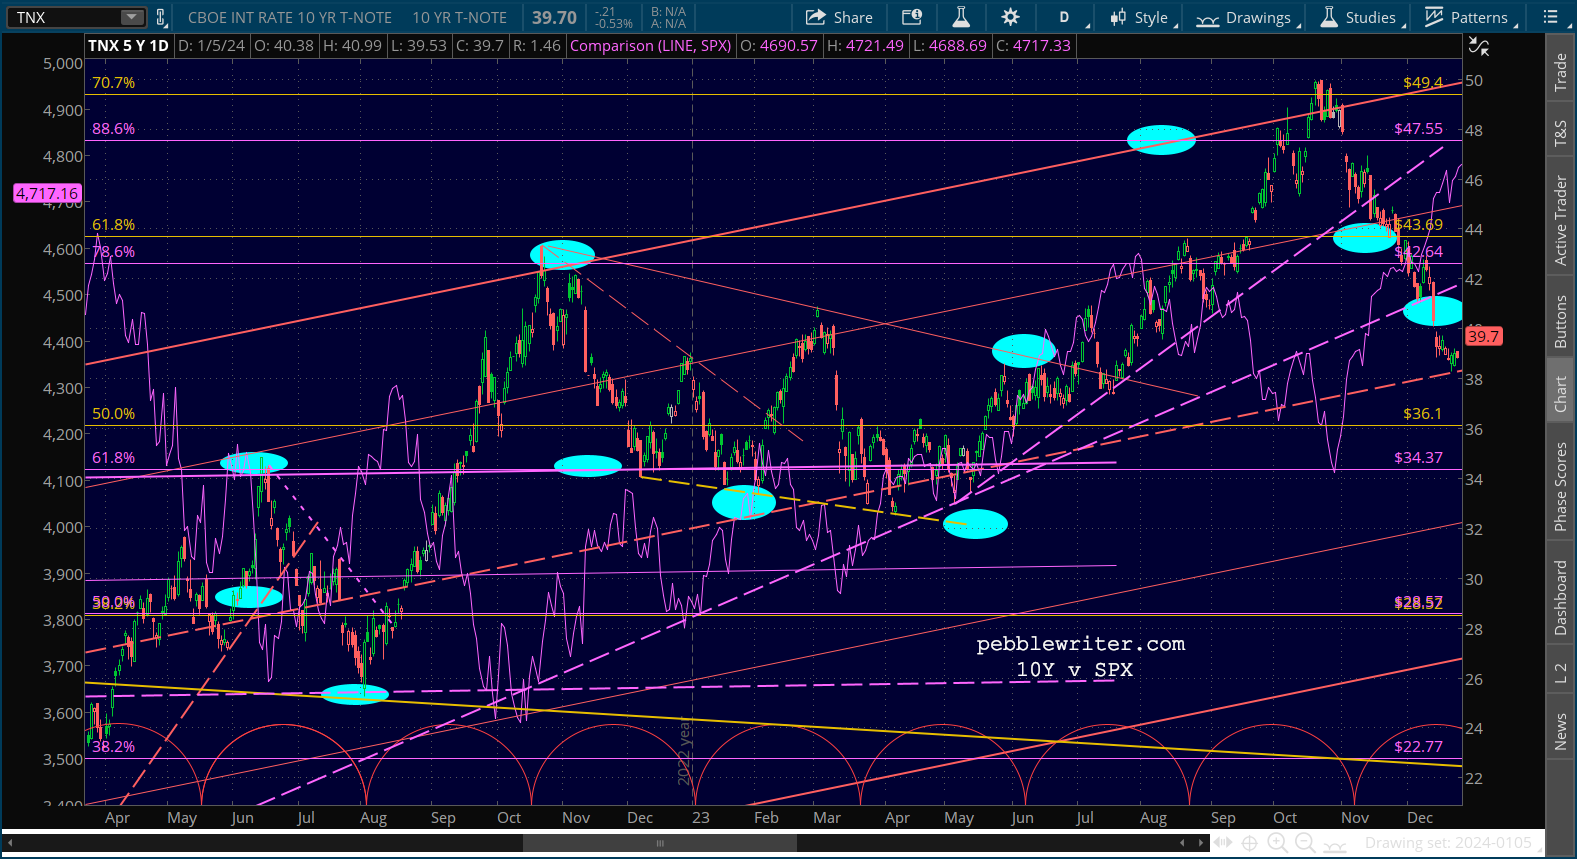 The sharp decline from the November highs that helped fuel the year-end equity rally is essentially over unless the red midline breaks down.
 If you believe that the higher for longer argument makes sense, take a fresh look at the cycle chart. Remember, it shows significant lows occurring roughly every 231 weeks – about every 4.4 years. The next cycle low would be around May 2025.
I readily admit this is a stretch, but assume that that significant low came as a backtest to the broken falling yellow channel. Now connect as many recent highs together into a channel top and drag the bottom of the channel to the lowest low on the chart. You get this:
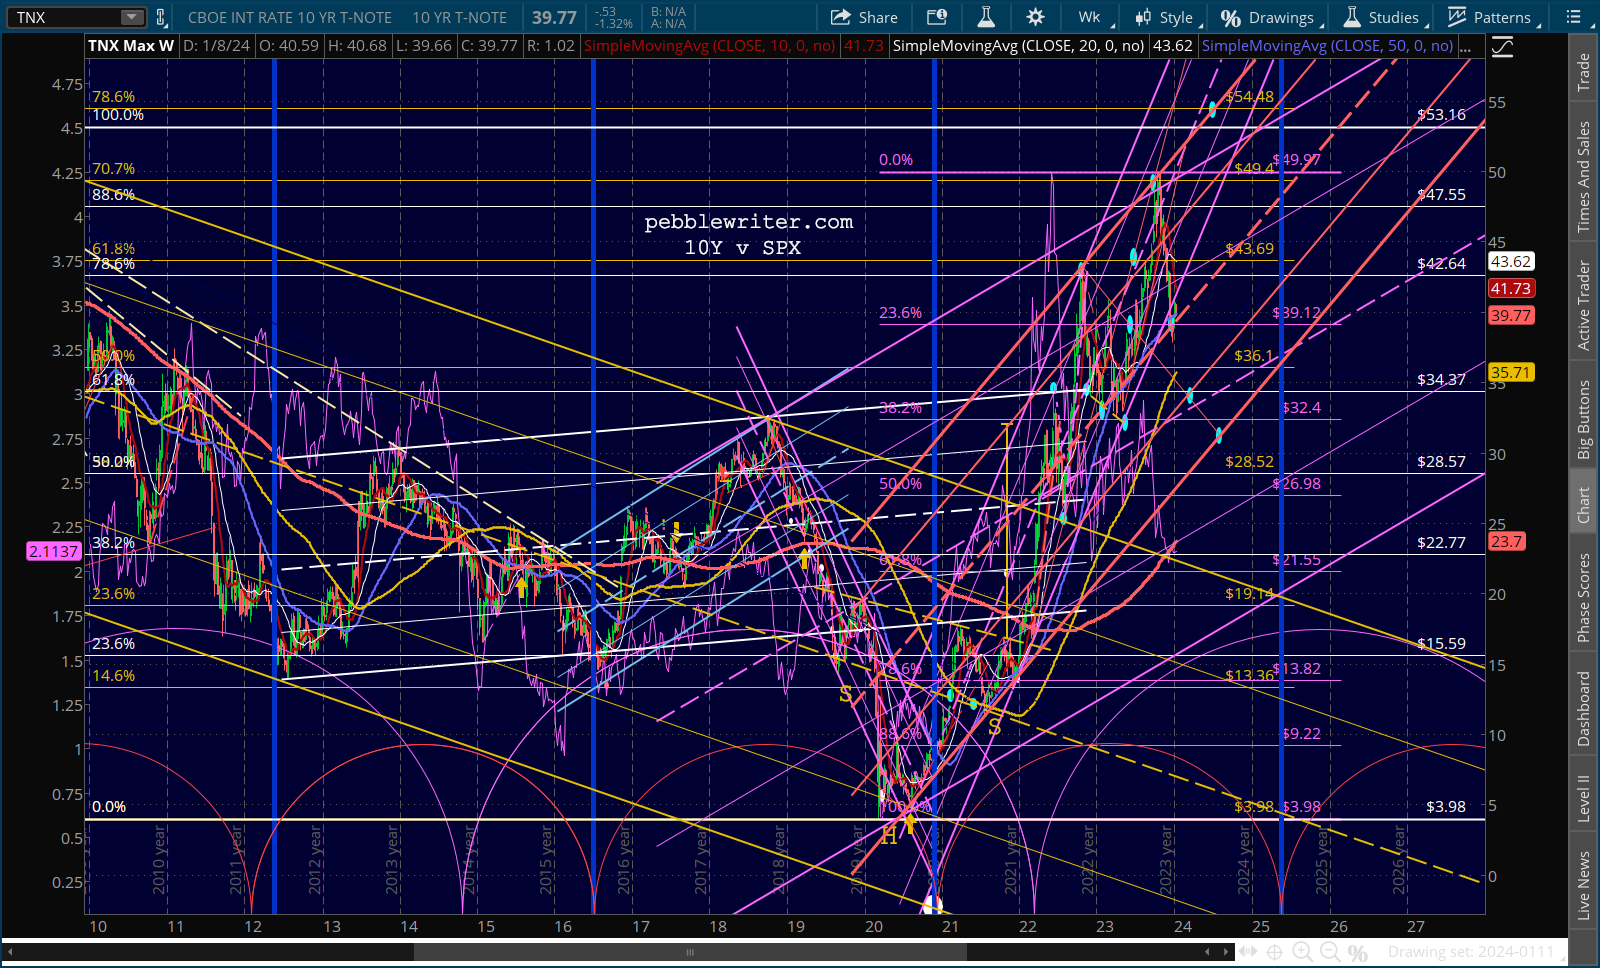 The resulting rising purple channel essentially expands the rising purple channel from 2016-2019 into a very large channel which intersects with the falling yellow channel very close to when the cycle says it should.
Since the smaller rising purple channel has already broken down and been backtested, and the flat white channel has already run its course, we can eliminate both – leaving a somewhat cleaner chart.
Then, we’ll add a channel back in to get rates down to 2% by May 2025. We’ll make it parallel to the 2018-2020 falling purple channel.
 We can see that this channel would come close to the rising red .236 line and rising purple midline at approximately 3.3-3.5% between Feb 15-Mar 15, the bottom of the red channel at about 3.05 between Jun 15-30, and the .236 line of the rising purple channel at roughly 2.6% in mid-November.
 Interestingly, these time frames align with the XLU cycle chart lows.
 It would mean that TNX’s SMA200 is likely to hold, and that the next leg is down – which also means that oil/gas prices might break down in spite of the strong support at current levels.
I’ll chew on all the above and wrap up the Look Ahead at 2024 tomorrow this weekend. Apologies for the delay, as I ran into computer problems today and then just ran out of juice.
Currencies
EURUSD and USDJPY have both taken a turn supporting stock prices lately. EURUSD broke out of an 8-month flag pattern that had signaled a downturn after an 18% rise from the Oct 2022 lows. It also ripped back up through the red channel midline after not even reaching the .236 line.
In the midst of that decline, which mirrored that of SPX, EURUSD started bouncing in early October, about 3 weeks prior to SPX. The breakout on Dec 21 allowed SPX to zoom up through its .886 retracement of the drop which began in Jan 2022. Otherwise, SPX almost certainly would have at least backtested the IH&S neckline.
 EURUSD also broke out of the large falling red channel it has been in since 2006. It did the same thing in Nov 2020 to aid stocks in the wake of the COVID crash. By Nov 2021, the market had climbed to new highs and stocks needed no more help.
 As discussed above in the equities section, it’s still unclear whether or not TPTB will allow a backtest of SPX’s neckline or they’re satisfied with ES’. EURUSD’s breakout suggests they’re intent on making new SPX highs to go along with DJIA’s – which would imply that EURUSD has upside to 1.1748 in the next few months.
 If EURUSD fails to top the July highs at 1.1272 then it is more likely to drop to 1.0203. Such a drop would be better for the bulls in the long run as it would facilitate a sharper drop in CPI ( a stronger USD.)
I think there is also a good possibility that the ECB will work to help reelect President Biden in November, meaning that they would facilitate at least a modest decline in the EURUSD in order to keep inflation in the US in check. They are reportedly aghast at the prospect of another Trump presidency.
Fortunately, traders have two good potential price signals: the SMA200 at 1.0846 for a short position and 1.1272 for a long position.
How to do so without sending stocks lower? The answer: USDJPY. It helped NKD break out to highs in May, backtest its previous highs in October, and rocket higher since then. This latest move tops the 1998 highs and opens a clear path to 159.14, followed by the 1.272 at 167.25 and 261.8 at 169.29.
 This means higher inflation for Japan, but the BoJ seems to care less. From all appearances, they have pretty good control over their bond “market” so it would probably not make much difference except to the Nikkei, which positively loves the yen carry trade.
A long position is clearly warranted at the current price of 145.85 with stops at the SMA200 currently at 143.66. Nervous types could safely wait for a breakout above the SMA50 at 146.26. If the above upside targets are topped, there are some very lofty targets available at 183.22 and 207ish.
 But, it’s likely that we’d see a pullback upon reaching the falling white channel .786 line at 167.25.
Conclusion
For those who have managed to read all the way to this point, congratulations! You have invested several hours in our speculative ramblings, hopefully to some avail.
As always, these forecasts are very subject to change and can be quickly thrown out the window without remorse should fundamental circumstances change. The biggies: war, central bank goofs, upcoming presidential elections. We’ll talk about each quite a lot in the coming months.
As always, thank you for your support this past year and your continued support in the coming year. I couldn’t do this without you.
Stay tuned…