

Futures are essentially flat ahead of today’s pivotal FOMC decision and press conference. This follows a day that saw stock prices plunge below our initial backtest target… …as VIX actually broke out – at least for a few hours.
  The banking crisis obviously hasn’t gone away. How many more First Republics or Silicon Valley banks are out there – clicks away from a bank run? Even those banks which aren’t already in trouble will most certainly cut back on lending, which will certainly raise the odds of a (worse) recession.
Will the FOMC take that into account as they contemplate future actions?
continued for members…
The big picture hasn’t changed. As it stands at the opening, ES is still below its SMA10, SMA20 and the important yellow 1.618 extension. The 10/20 cross happened yesterday. SPX itself hasn’t yet seen a 10/20 cross but, in the absence of a big bounce today, will experience one.
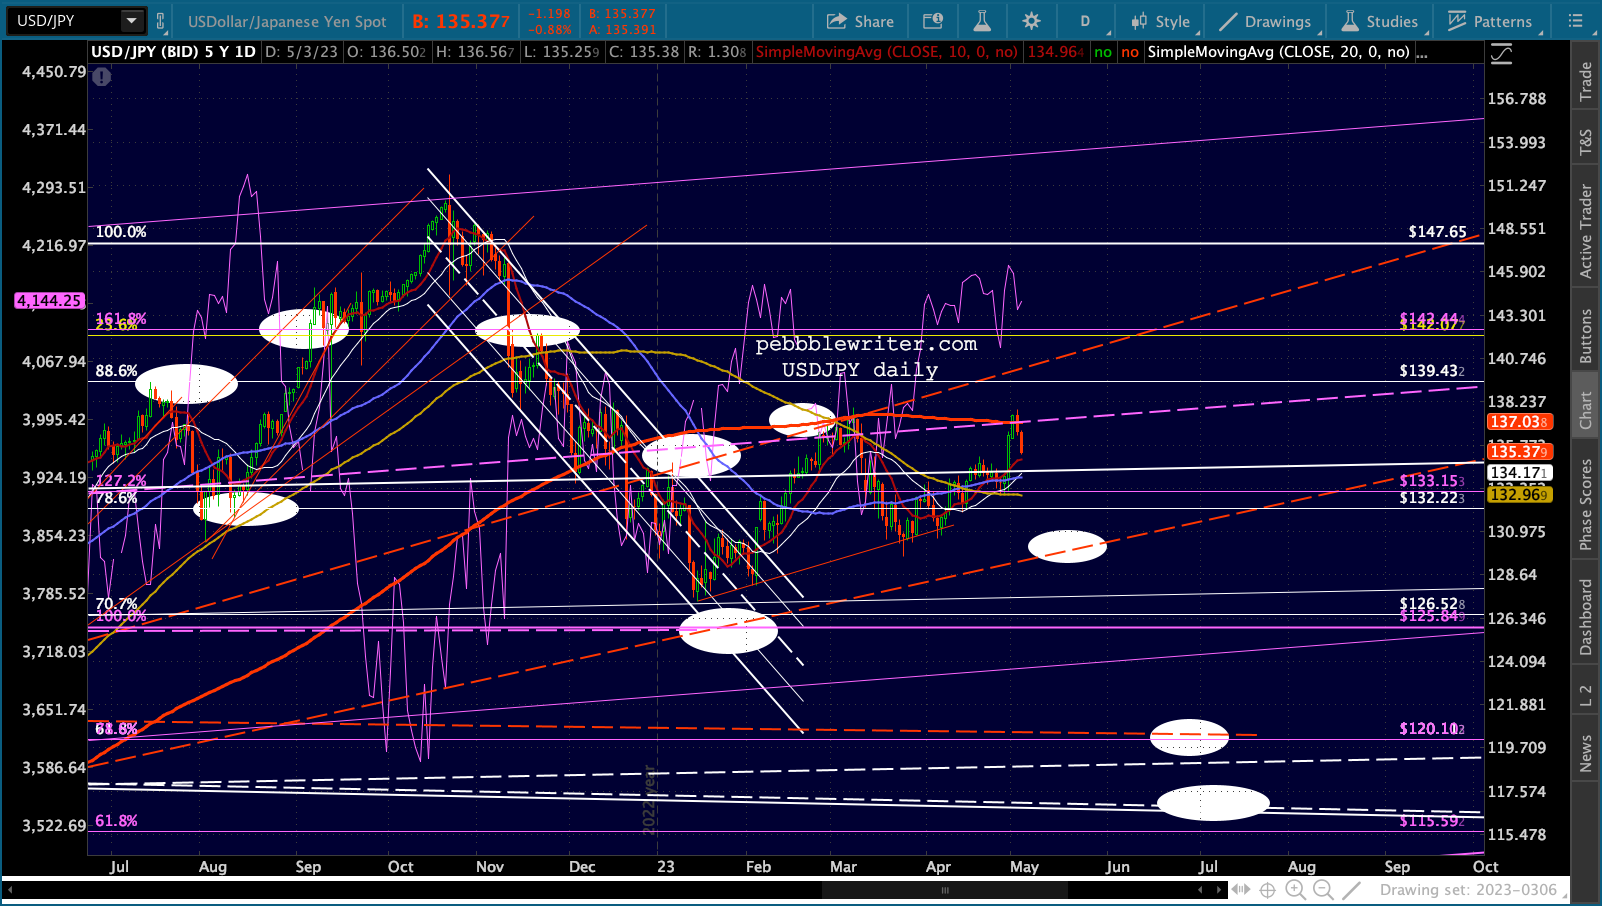
 Currencies are fairly quiet, with EURUSD providing a slightly bullish bounce and USDJPY slipping lower after ensuring a breakout for NKD.


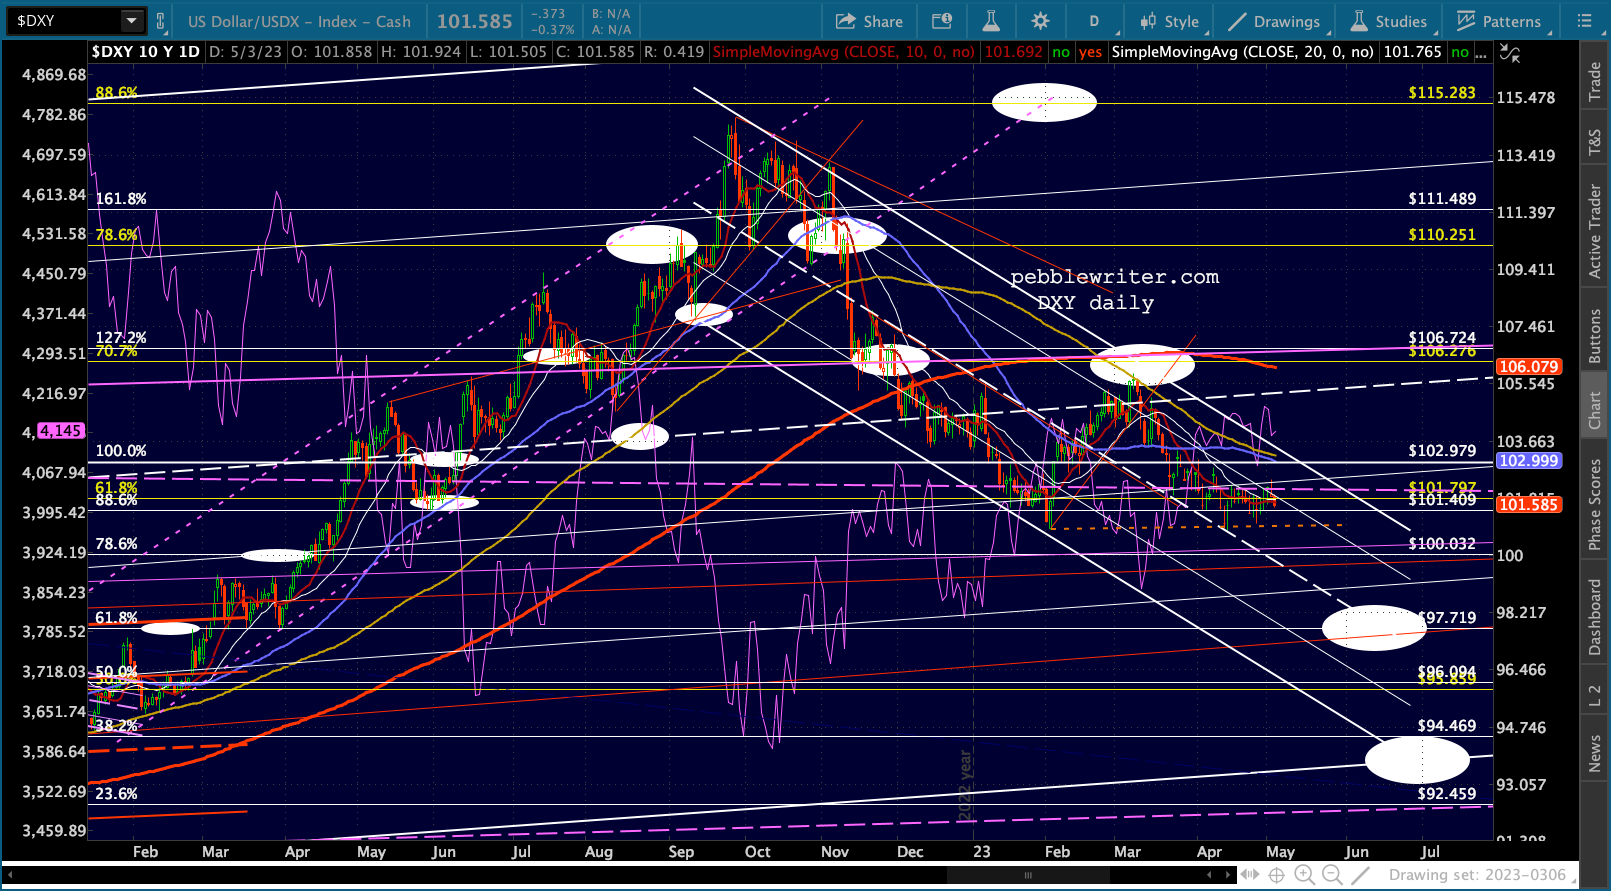 GC and SI are bouncing mildly on DXY’s slight weakness. But, they are clearly susceptible to an equity meltdown as is BTC, which continues to sell off.


CL and RB both cratered yesterday and look to be continue the breakdown today. Our charts suggest much more to come…

 …which typically pressures the 10Y. But, there has been a divergence between them as CL/RB are making new lows while TNX is not.
 Remember, it’s all about the 2Y and the turmoil which occurs when it slips back toward or below the 10Y. All it really needs to do is to drop faster than the 10Y to disrupt equity markets.
 A reminder of past incidents – note the market crashes which occurred every time the 2s10s breaks above significant falling red TLs following an inversion. The losses accelerated when the 2s10s also rose above obvious horizontal resistance.
 It has already occurred this time too, but the Fed was careful not to allow the breakout to top horizontal resistance.
 This closeup identifies the key resistance at -0.38, -0.26, and -0.17.
 It’s admittedly a chicken and egg phenomenon, as short-term treasuries attract investment capital fleeing stocks during an equity meltdown. But, the phenomenon is very real and hasn’t failed since the 2000-2003 crash.
Last, a quick look at our XLU cycle model. After testing its red channel top and SMA200, it has sold off slightly – presumably on its way to at least 64.86 and potentially as low as 56.69 or even 53.45. Since the pandemic crash, equities have failed to follow XLU lower at or near its cycle lows (red time lines) only once. It’s not a slam dunk, but it’s convincing enough for me to have picked up some XLU puts last week.


 The correlation between XLY and the 2Y has been equally strong – though the 2Y has been much more resilient as of late. This raises an interesting question regarding the current cycle.
 Would the Fed signal an end to the hiking cycle in the absence of a troubled equity market? Inflation is clearly falling, but it’s still a far cry from 2%. So, why take their feet off the brakes just yet while equity prices are so close to all-time highs? Seems it would merely make it that much harder to get down to 2%.
So, I suspect they will come out somewhat more hawkish than consensus today, precipitating the equity drop our charts suggest and potentially sending the 2Y lower as money flows out of stocks into short-term treasuries.
Stay tuned…
UPDATE: 15:45
The statement was as expected, with minor changes. But, Powell’s comments leaned toward the hawkish side IMO. The market seems to agree. ES is about to make a lower low and SPX has completed a bearish 10/20 cross. Both are now focused on the SMA50s. VIX has broken out just a bit and should close above its TL from Mar 13.


