

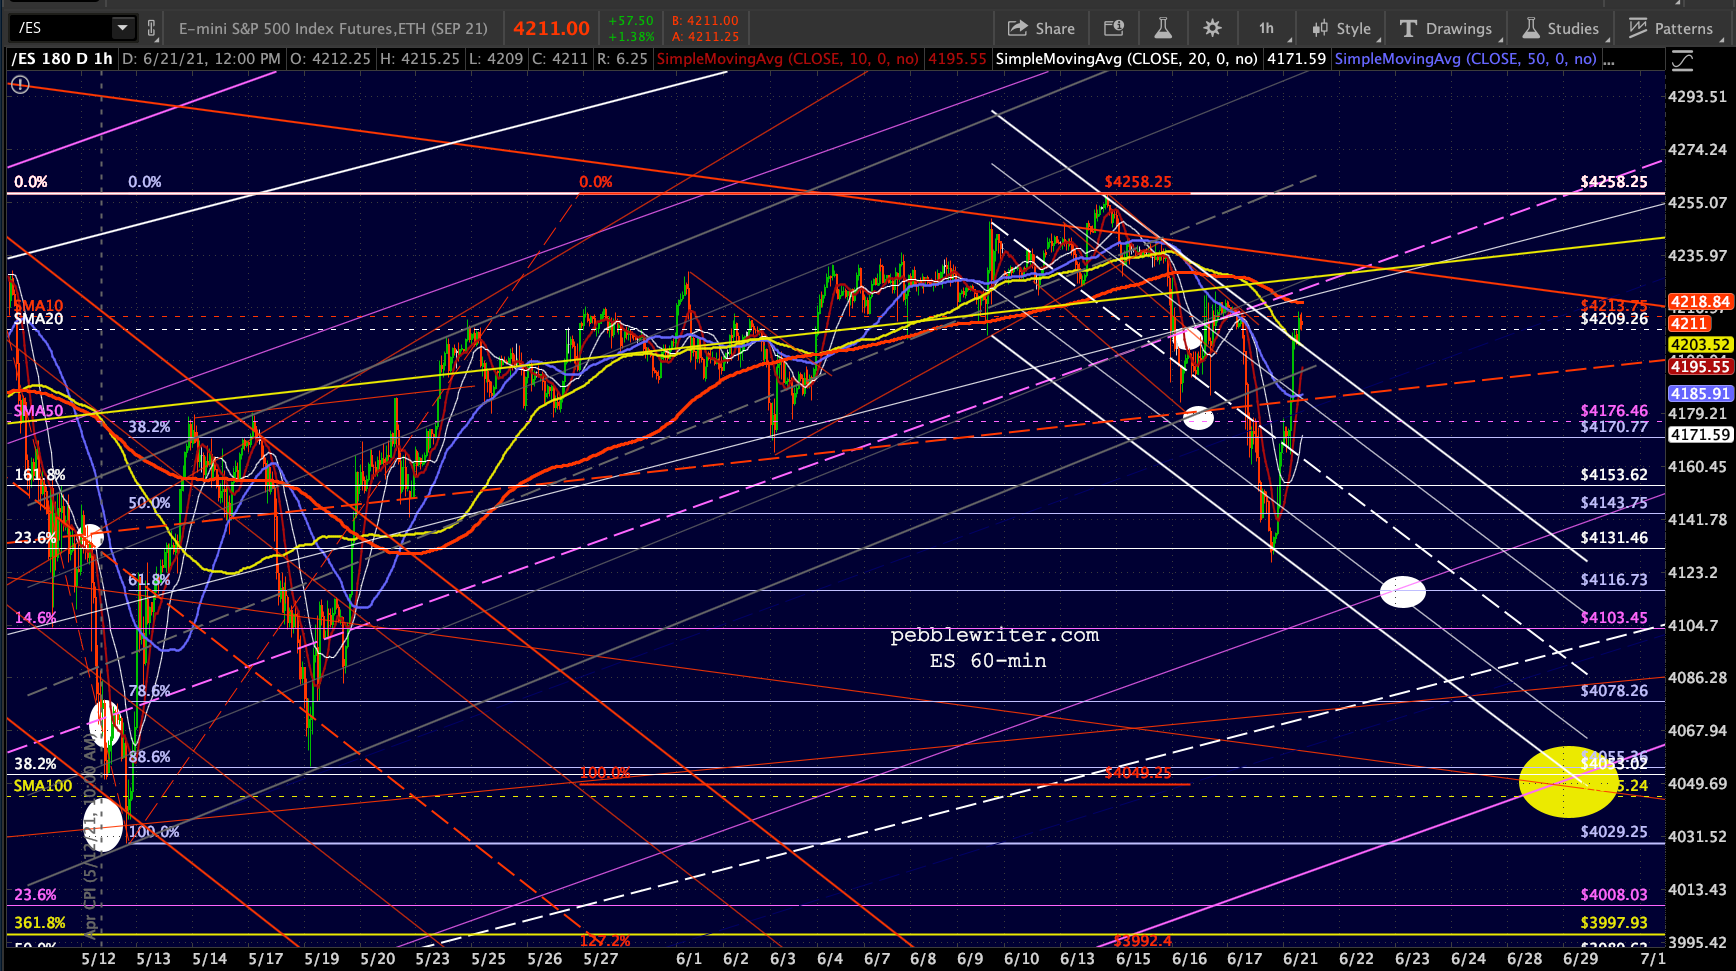
ES came within 9 points of our next downside target before getting a nice bounce motivated primarily by USDJPY, which was working flat out to save the NKD from a scary, and long overdue dive to its SMA200.
 This bounce will be quite important to the bulls, who are no doubt hoping to avoid a bearish 10/20 cross.
continued for members…The bigger picture indicates that this is another stalling tactic that should allow the next leg down to tag an important channel line.


 Note that NKD’s 4% overnight drop has largely corrected itself, but there’s another leg down to come.
  In another day or two, NKD’s SMA200 should reach its .886 at 27428, allowing the tag to occur at a higher low and normal retracement reversal point.
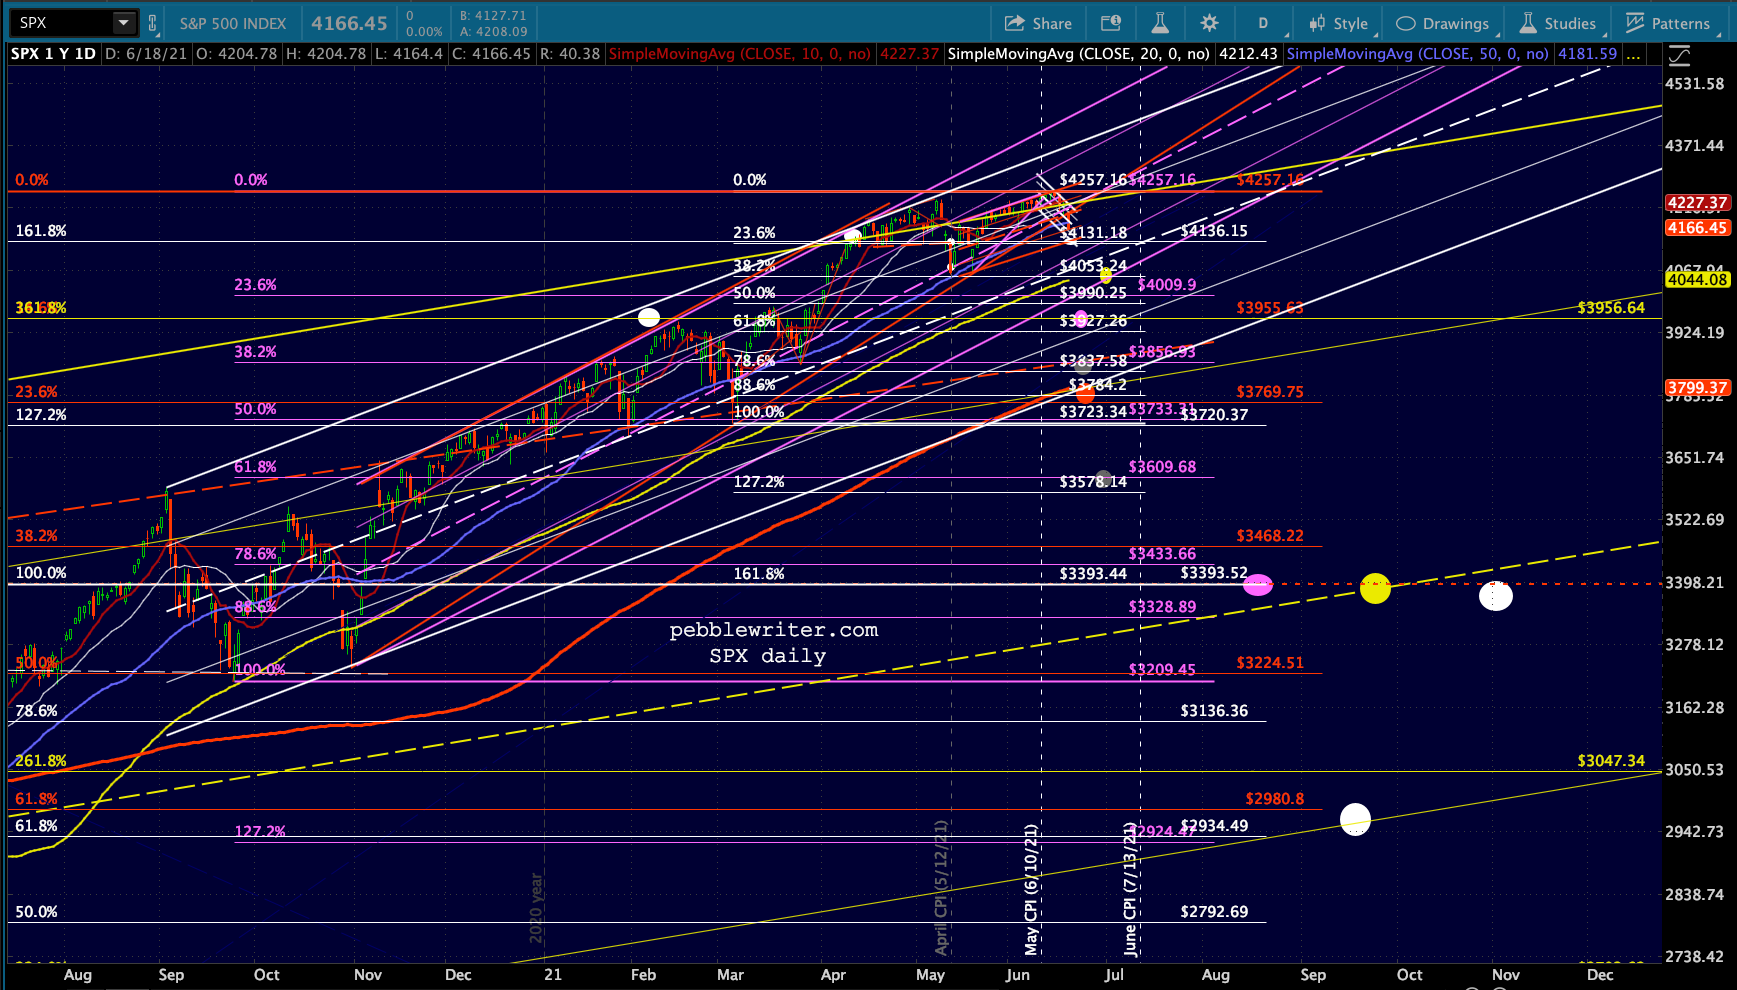
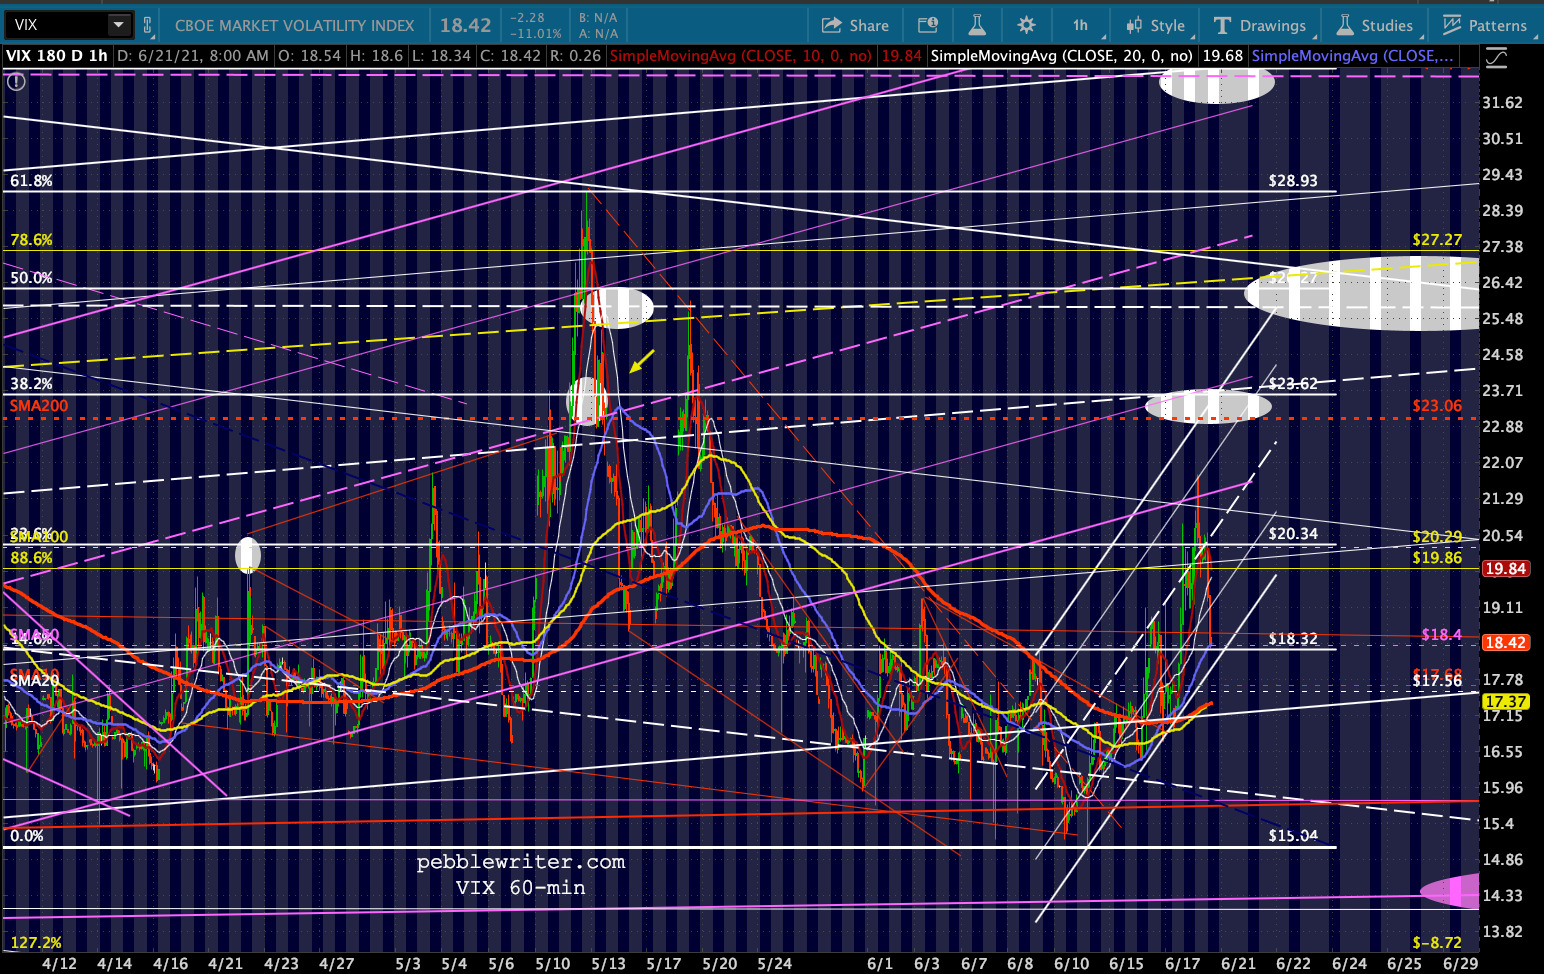
 VIX made a nice pop overnight, but is now under pressure again as a means of staving off any more immediate downside for stocks. It will be important to watch what it does when ES reaches its SMA50 at 4176.50.
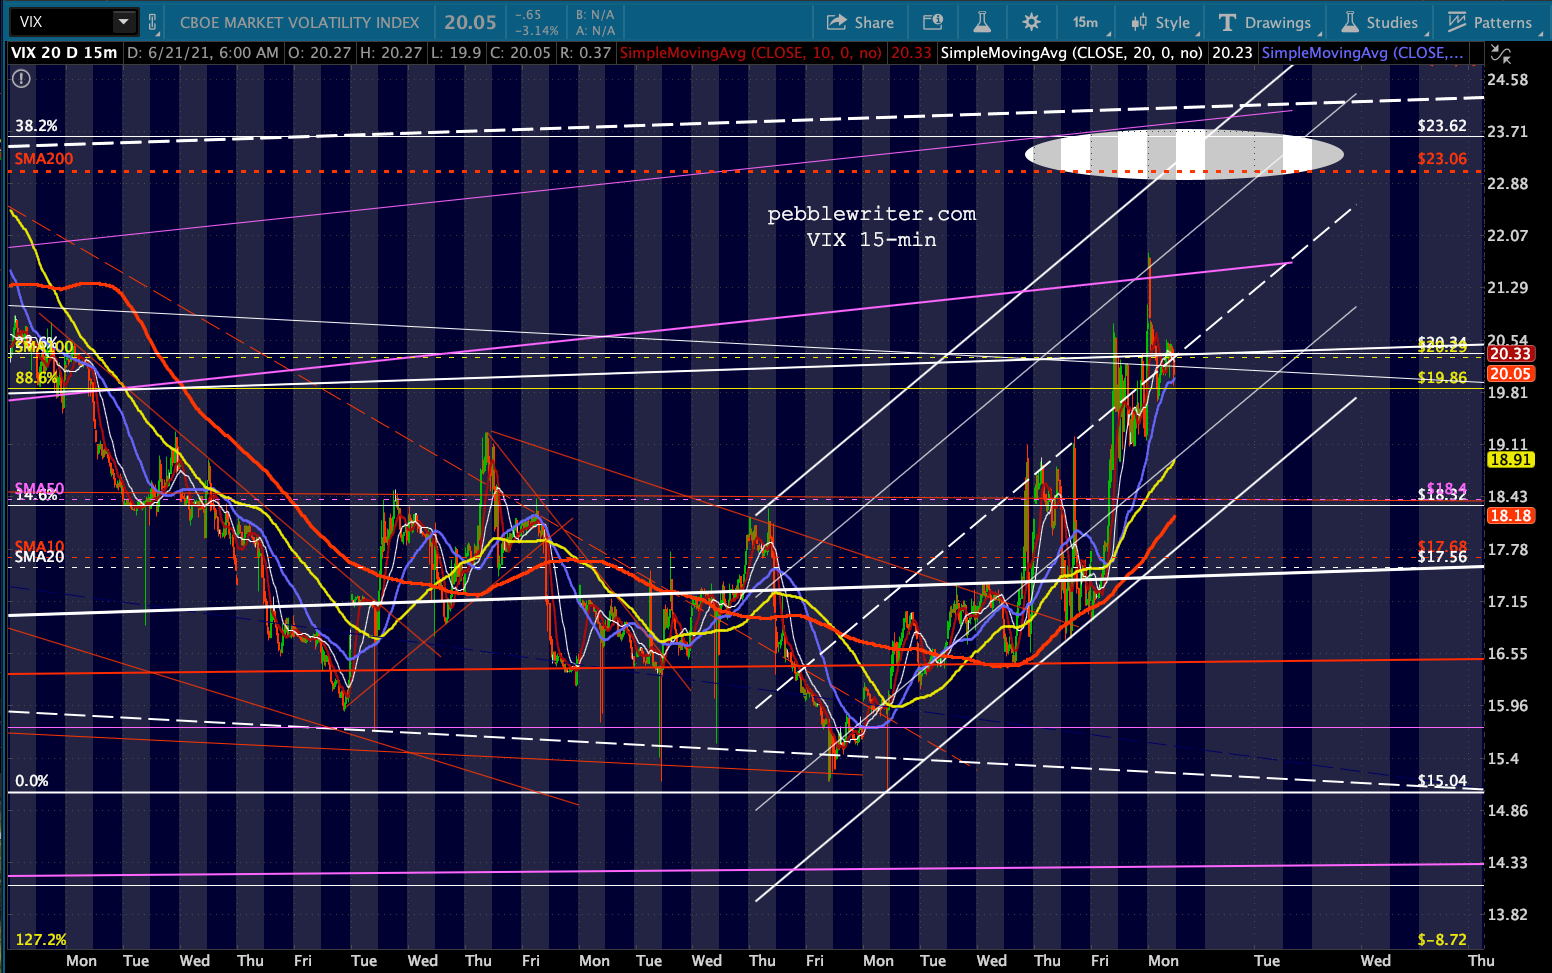
 NKD’s and ES’s bounce came at exactly the same time as USDJPY’s bounce – just before midnight last night.
 EURUSD is getting a slight bounce off its red TL, which is contributing to DXY’s pullback. It remains to be seen whether the USD is done.

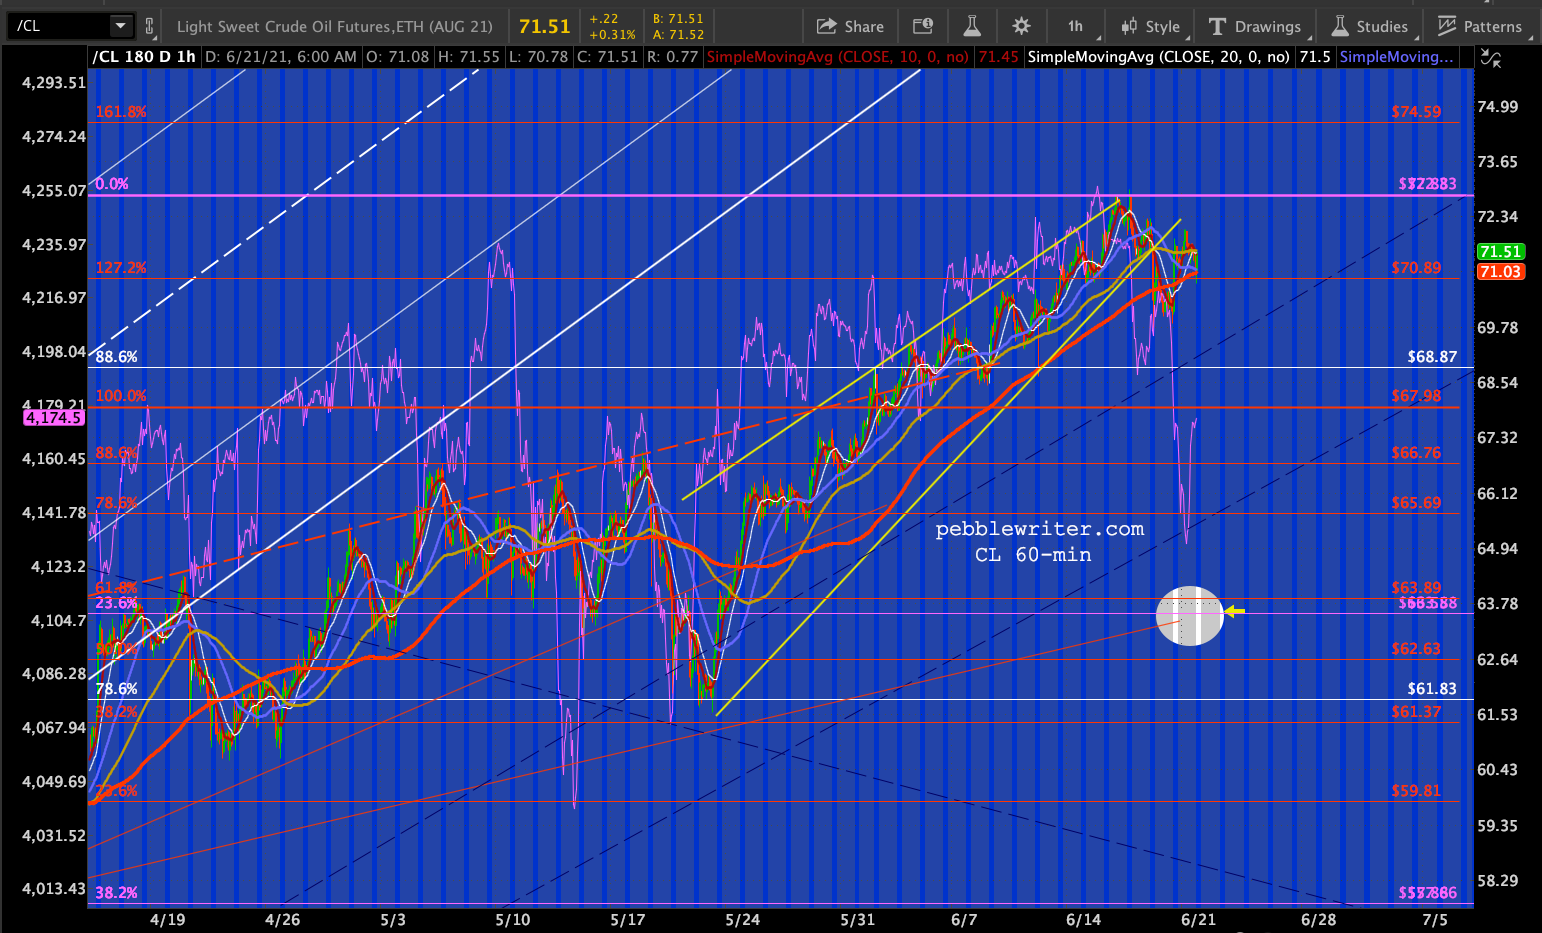
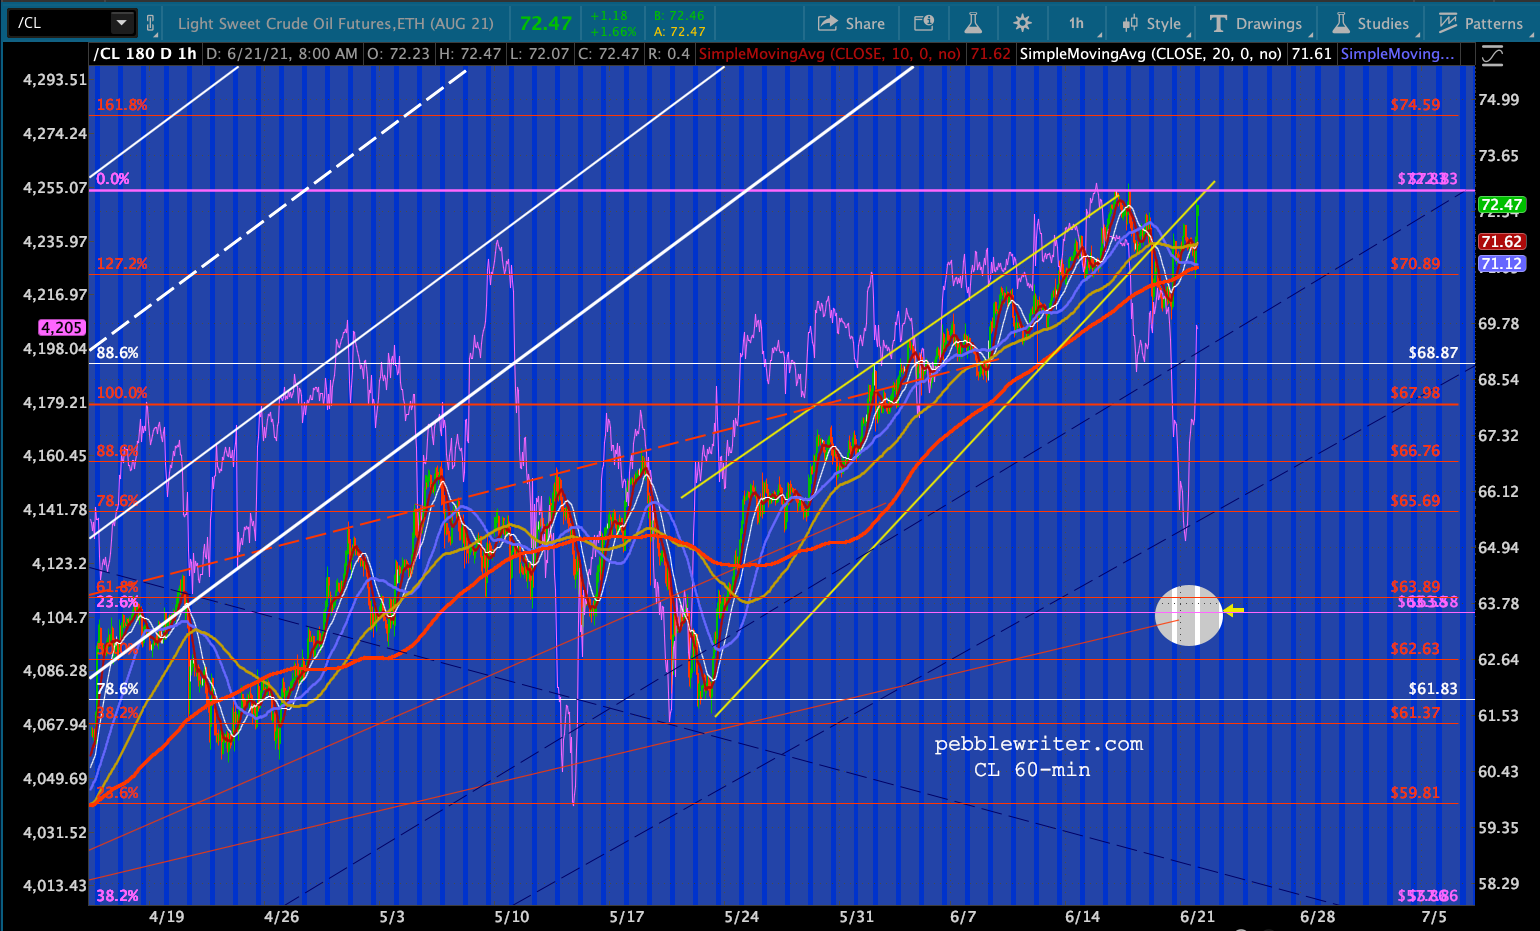
 On the energy front, CL is getting a slight bounce on Iran’s election results. Hardliner Ebrahim Raisi has announced he will not meet with Biden and called for the US to live up to the terms of the JCPOA from which Trump unilaterally withdrew while in office.
CL’s SMA100 has almost risen to the TL off the Apr 5 lows, enabling a pullback that wouldn’t break the uptrend.
 TNX, which was on the brink of breaking down from its flag pattern, got a little boost from the oil news.
 This makes me suspect that the breakdown (and next leg down in stocks) is scheduled for Wednesday, when Durable Goods for May is released. Recall that April saw a negative MoM print that disappointed fundamental analysts but boosted the market due to its supposed reinforcement for continued QE.
 That was then, this is now. Folks are a lot more concerned about inflation and the Fed is clearly thinking about thinking about the ill effects of much more QE.
Speaking of the Fed, QE and inflation… GC is very close to testing its purple channel bottom again.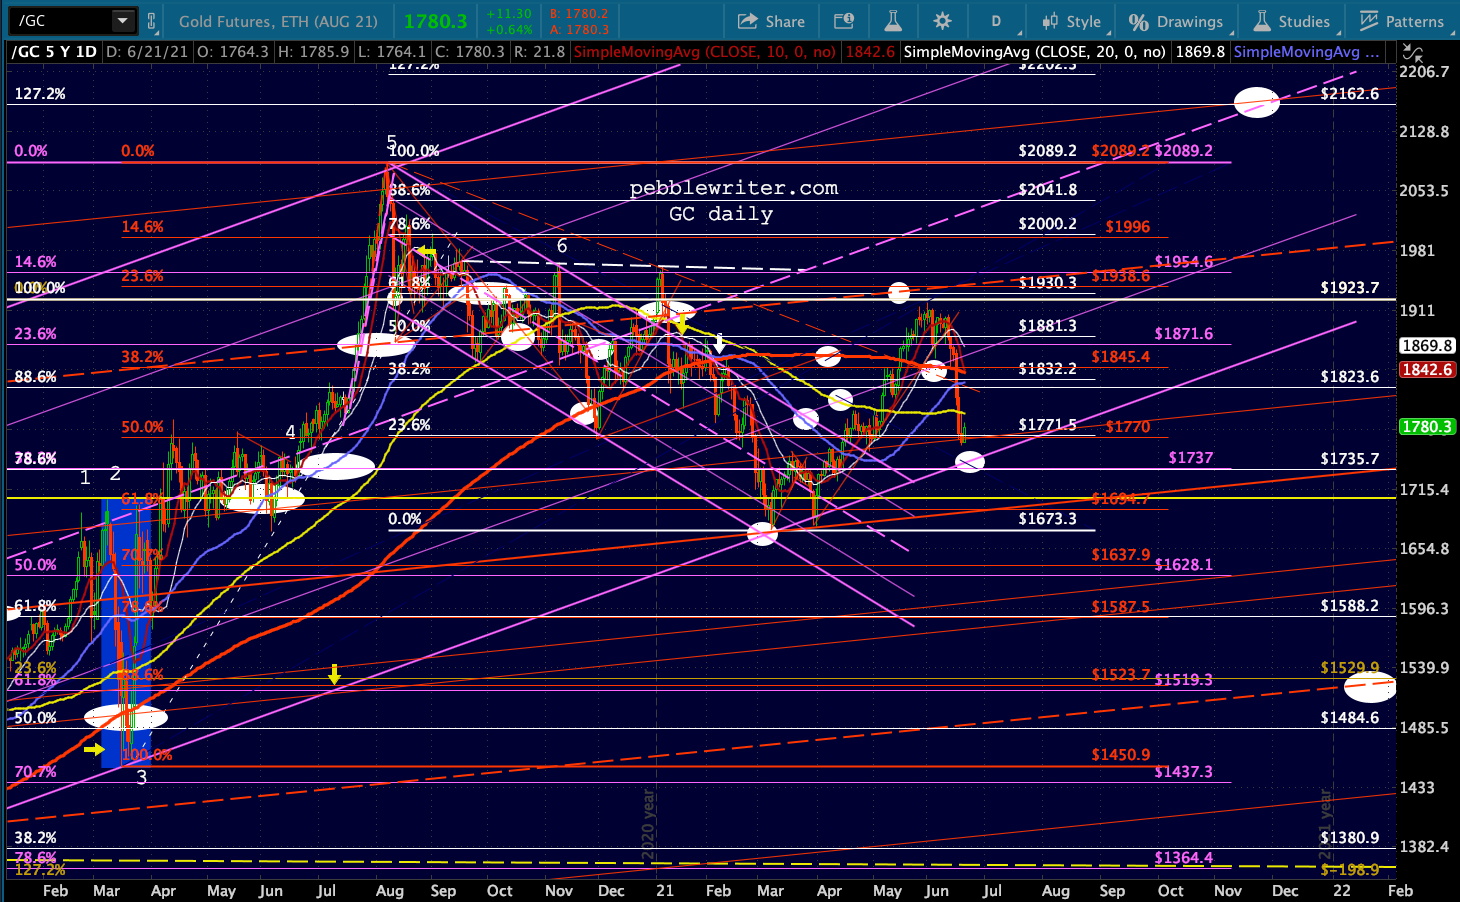 And, SI is clinging to its SMA200.
 BTC continues to slump toward our next downside target – the purple 1.618 at 28972 followed by the 1.272 at 23600. Note that the cloud is still red/negative, we still haven’t seen a bullish 10/20 cross…
  …and RSI has not only failed to break out but has actually broken down below the rising TL from May.
 UPDATE: 11:30 AM
This would be a logical place for the bounce to stop if it’s going to put in another leg down.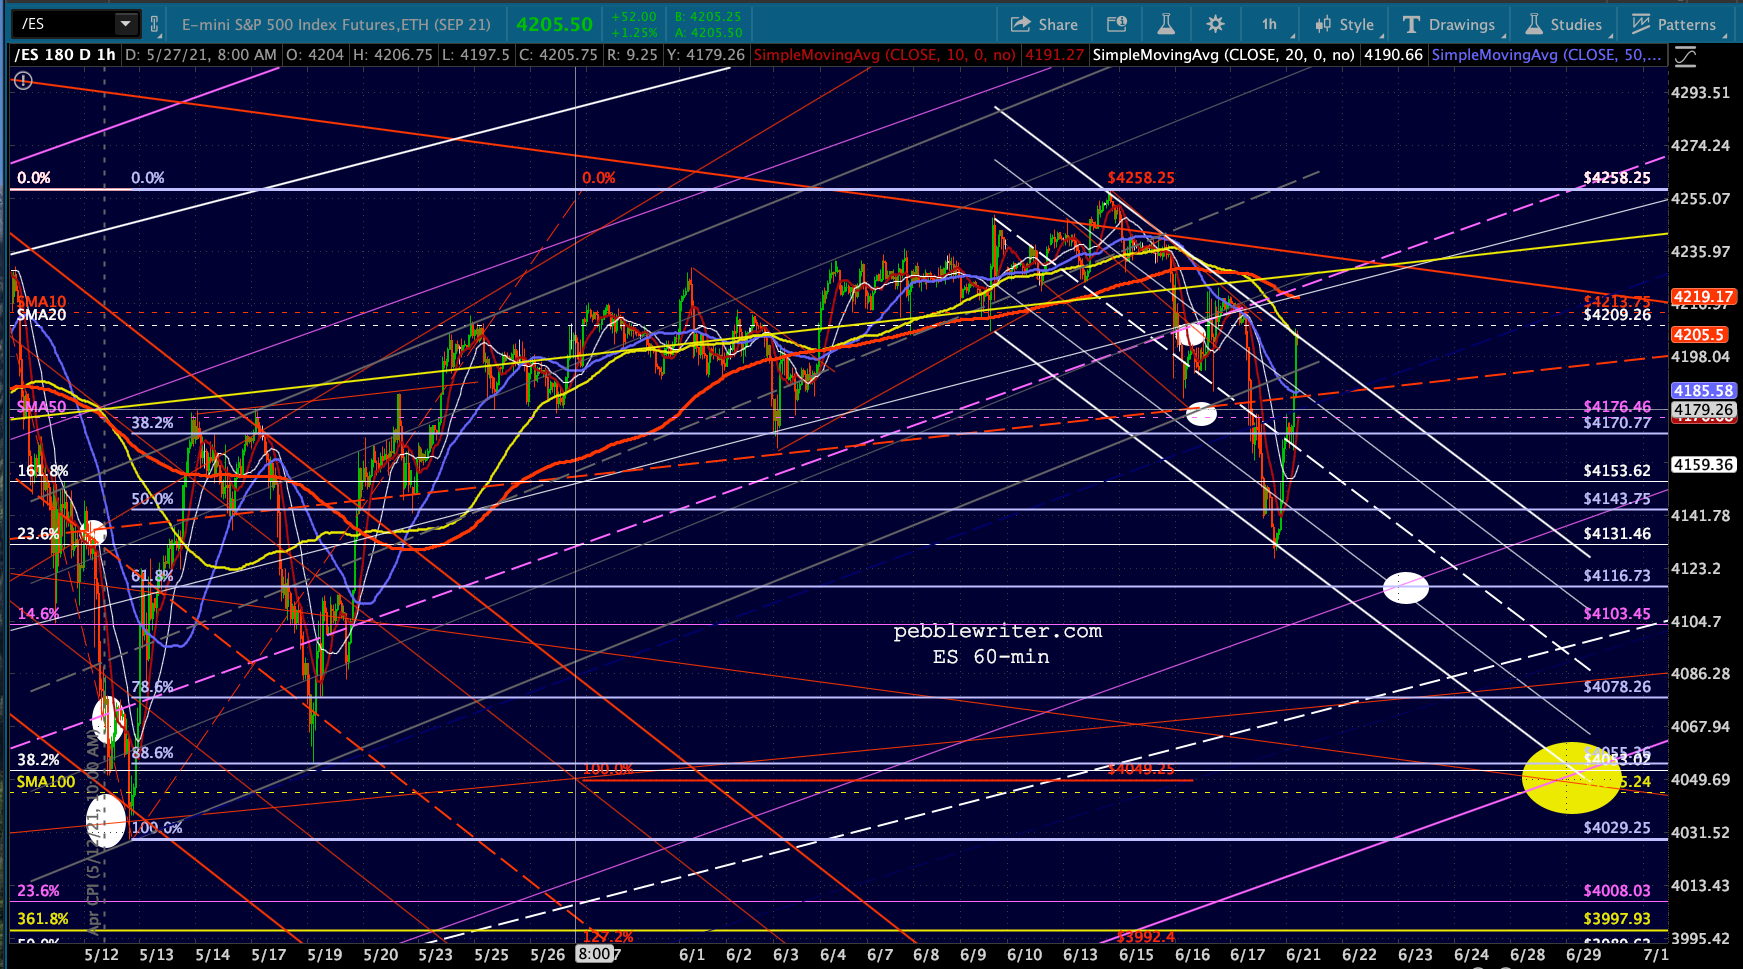

 More later…
UPDATE: 3:50 PM
More of the usual ramping: USDJPY, VIX and CL this time. ES’ SMA10 was at 4213.75 this morning, but is now back up at 4215 – avoiding the 10/20 cross for now.
 Like ES, SPX is showing signs of breaking out.
  And VIX is threatening to break down.
 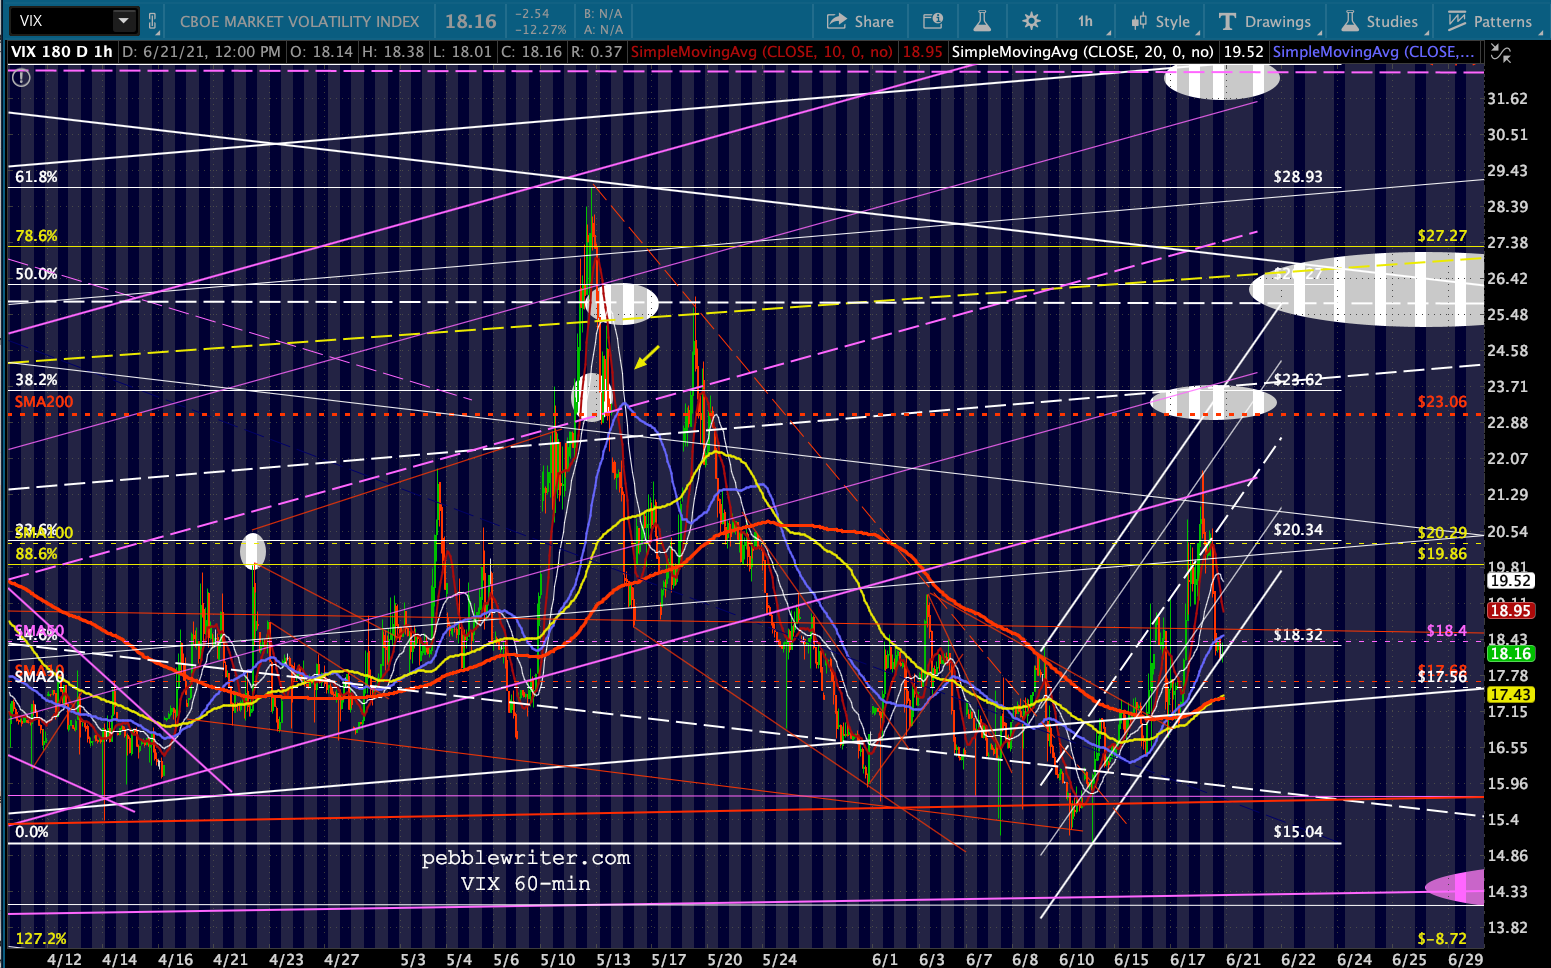 CL has pushed up to new highs.
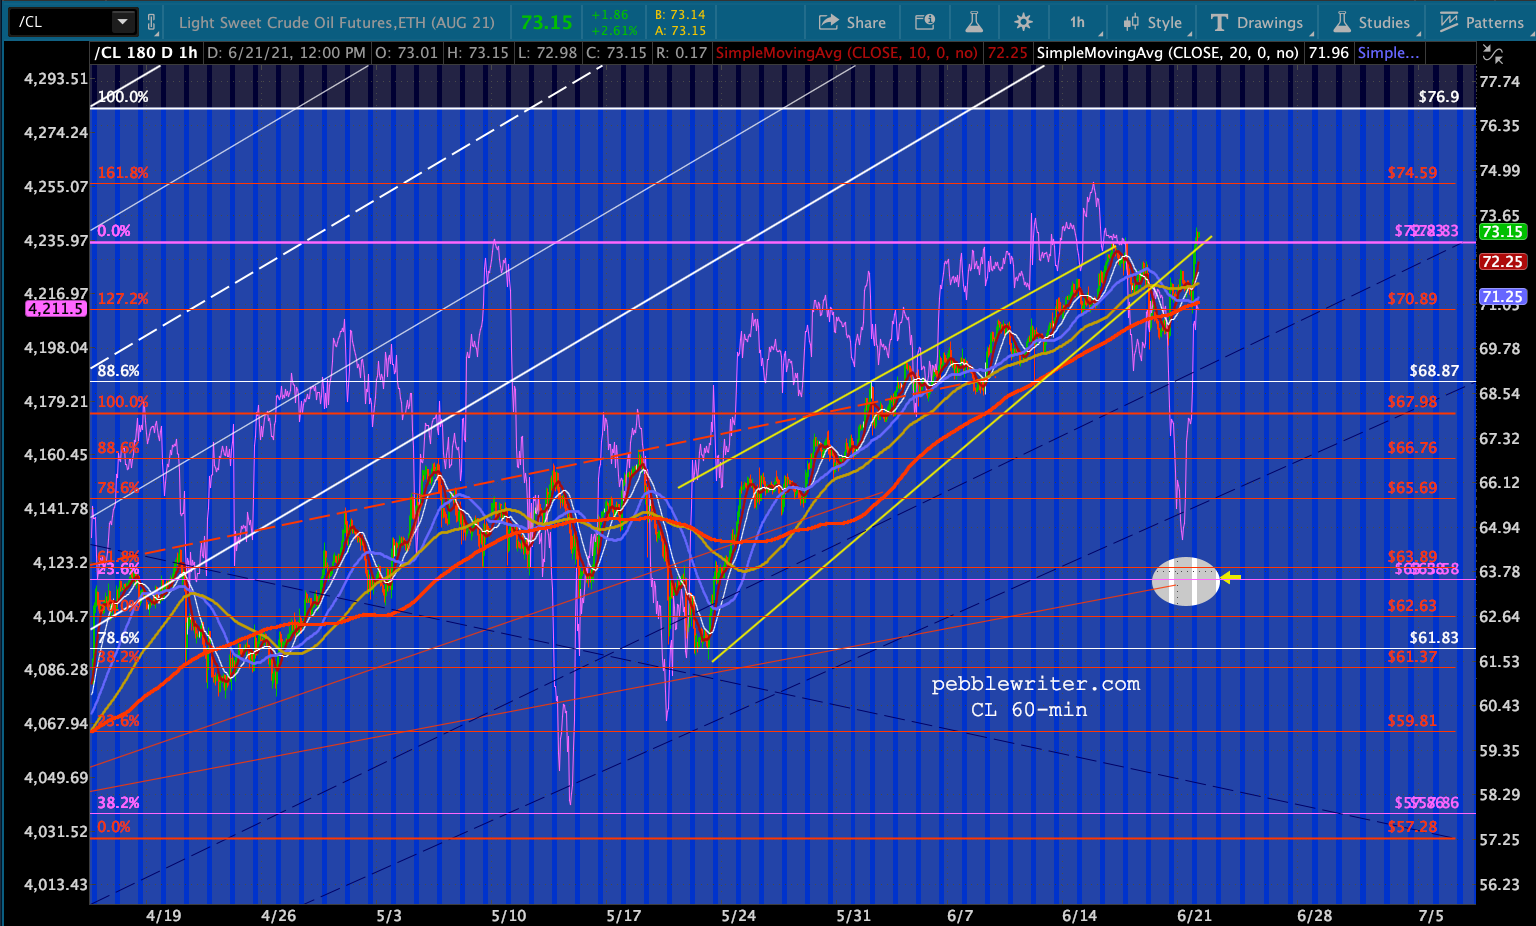 And, USDJPY is on the brink of a breakout and new highs.