
A lot has happened for RUT in the past week. It was only 11 days ago that we updated its chart, suggesting RUT would reach 2282 by the end of the year.
RUT’s reversal at its .618 in April set up either a Gartley or Bat pattern, meaning a move to its .786 at 2282.27 or its .886 at 2364.78. If we extend the dashed red trend line to the right, we get an intersection with the .786 at the end of the year – a very common scenario. While the .786 in December is a logical next target, an equally compelling case can be made for the .886 in September or October.

Don’t look now, but RUT pushed past the red TL we discussed, allowing RUT to tag 2282 (well, 2278) late last week.
 continued for members…
This means the odds of a tag of the .886 at 2304.78 in late September just went much higher. That dashed red TL is now support. 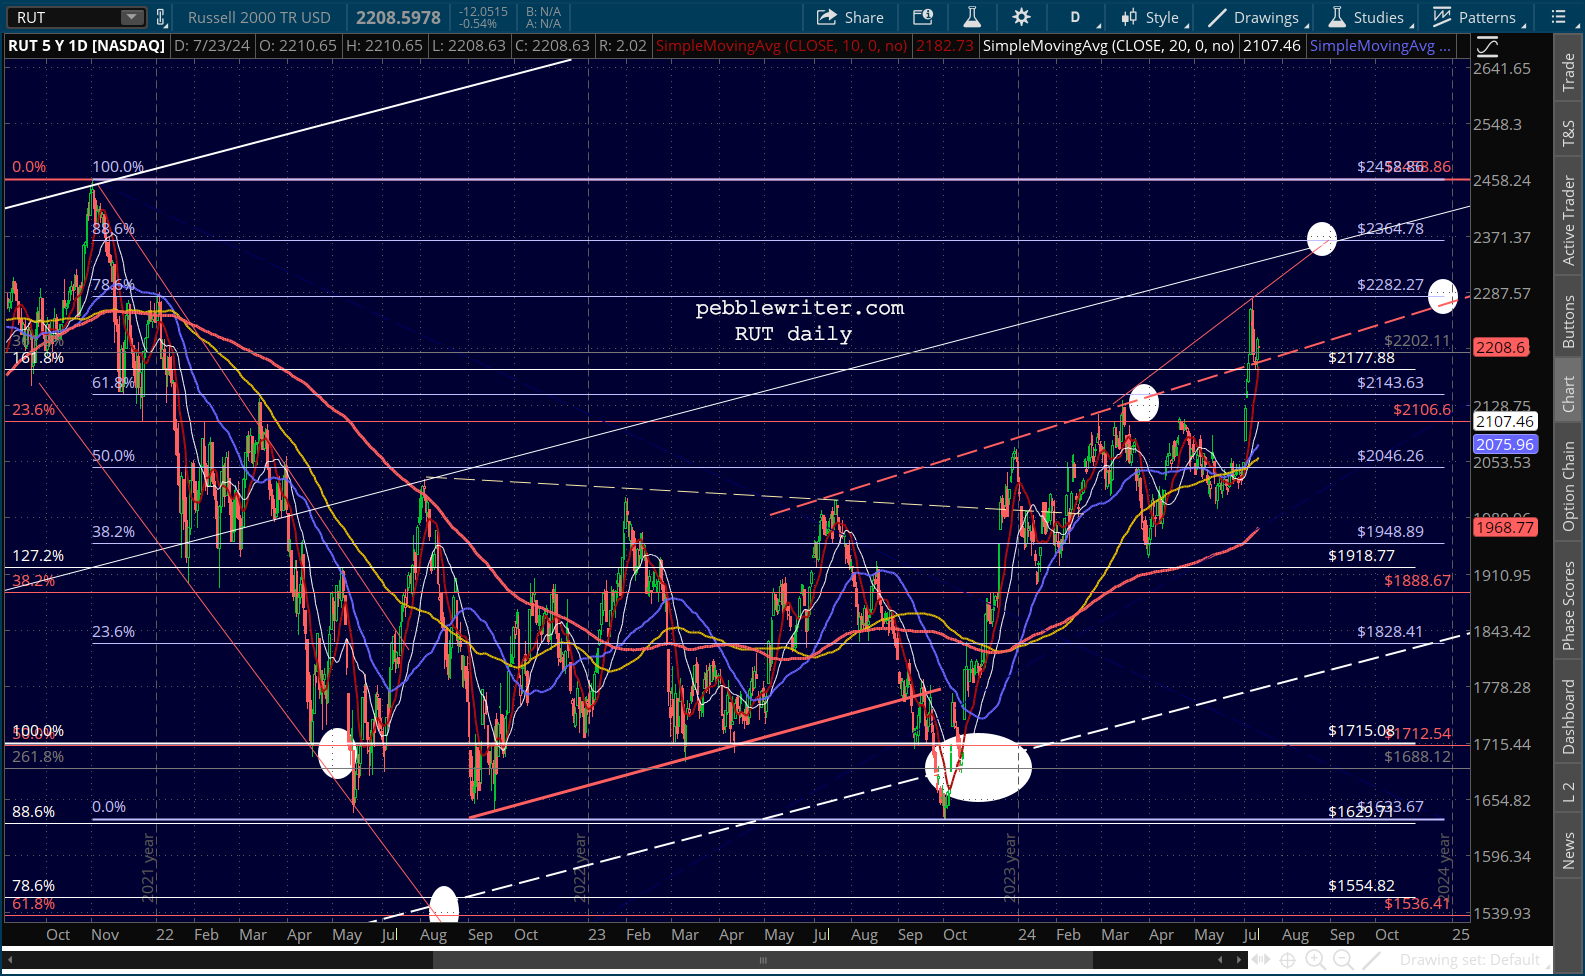 Meanwhile, ES recovered nicely from its dip to the white .236 line…
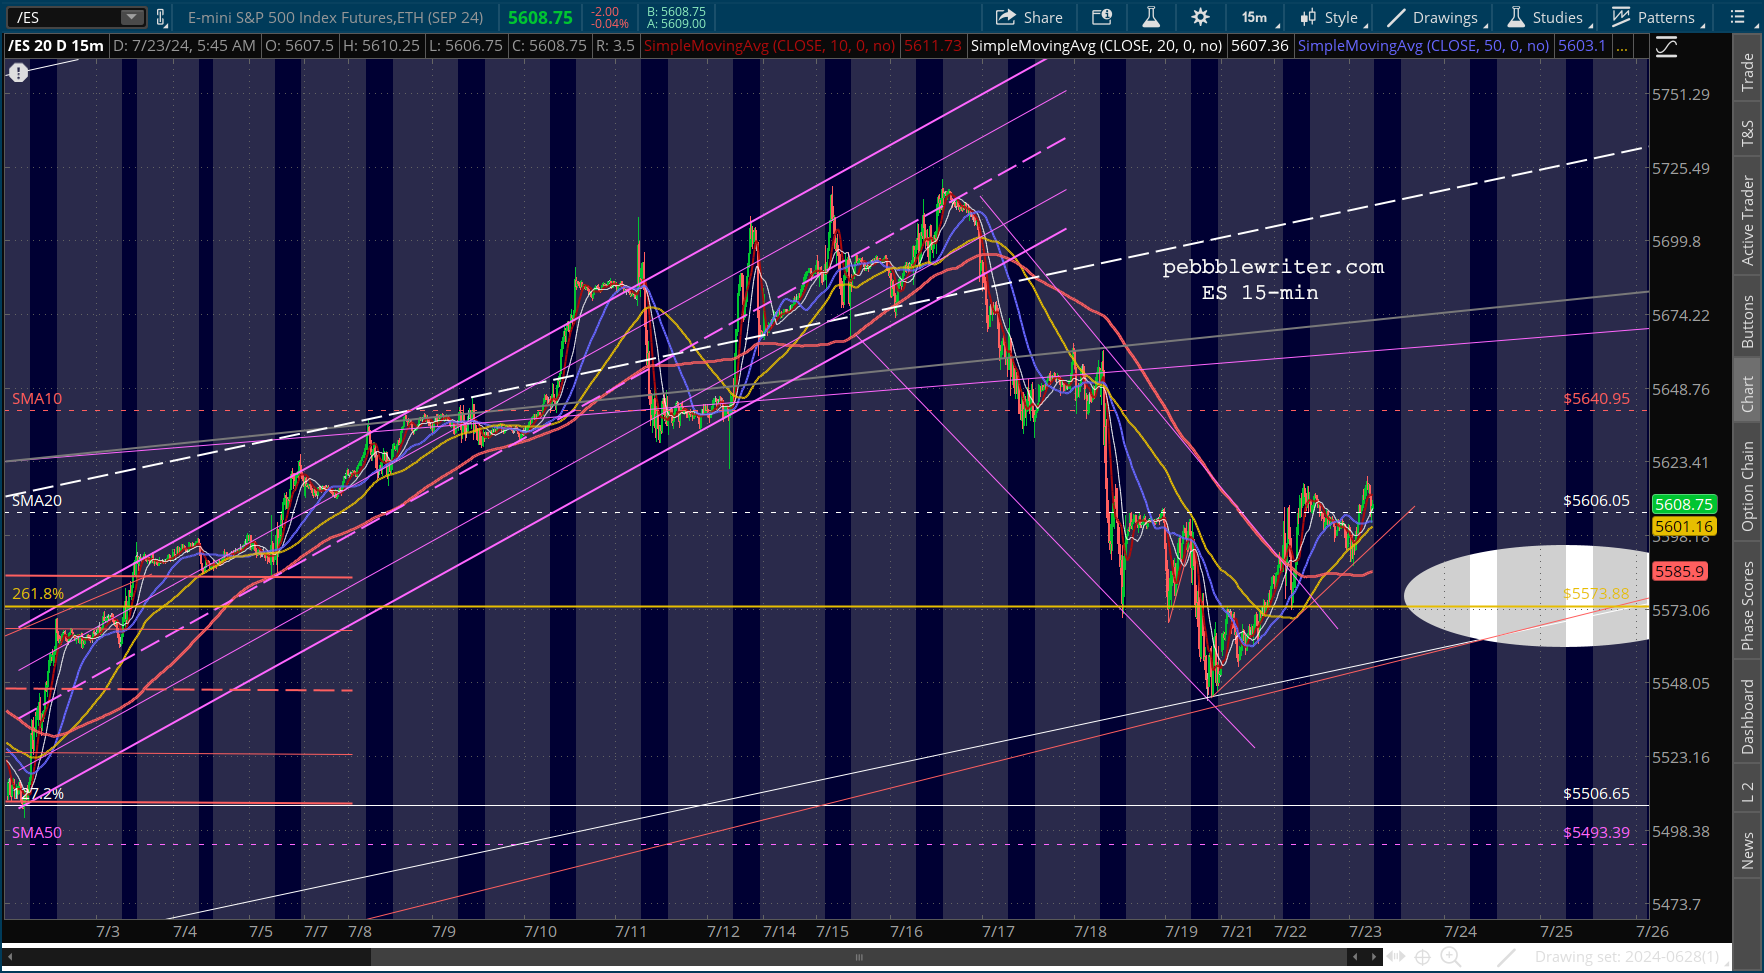
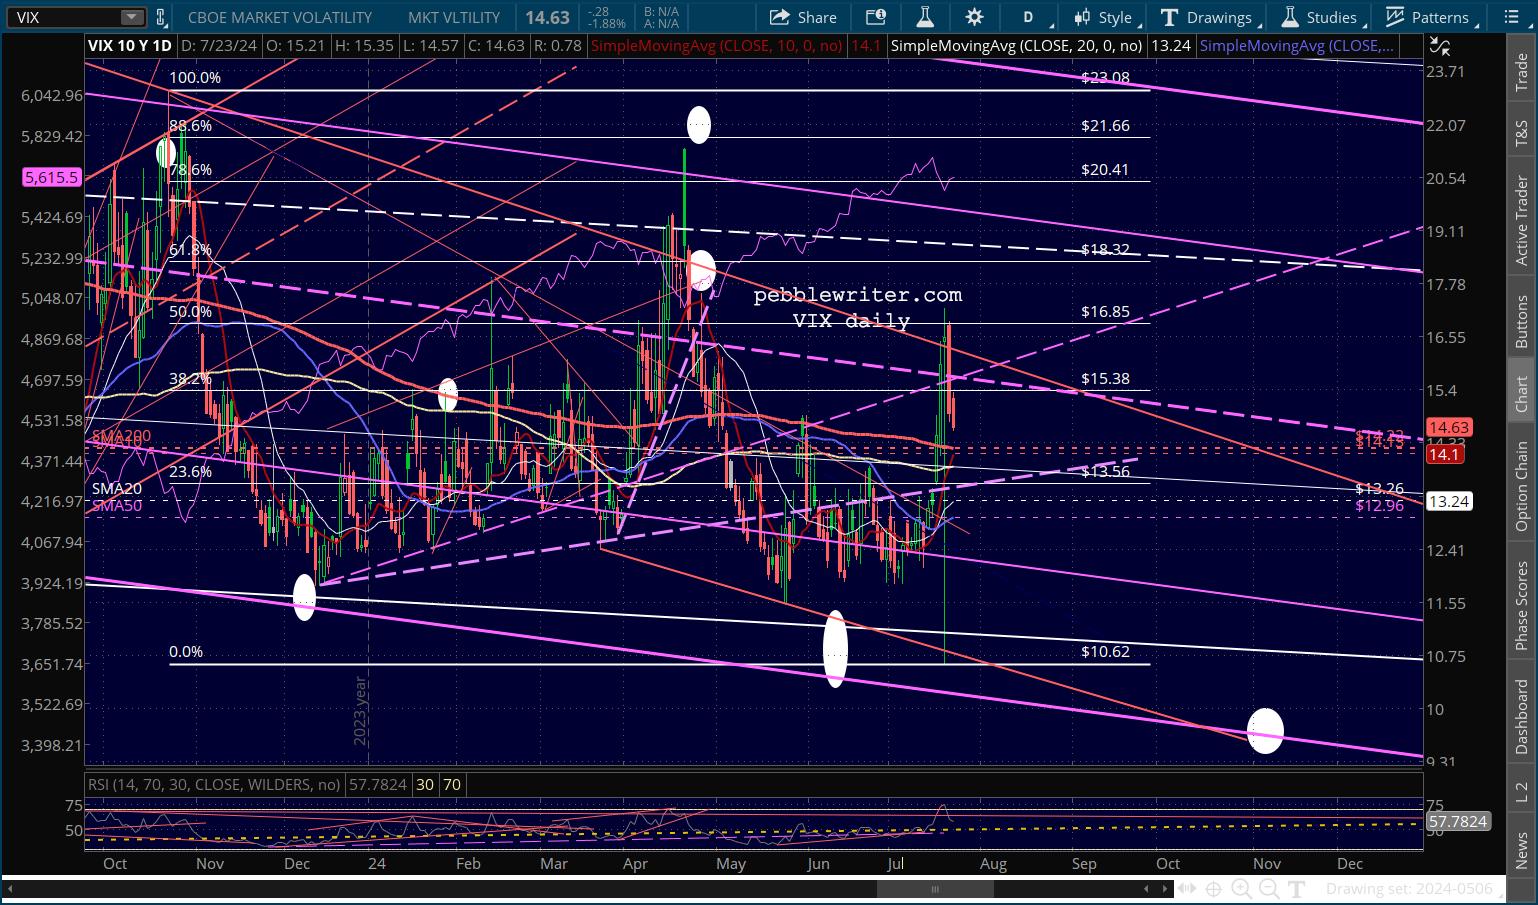
 …largely on VIX’s 10% tumble.
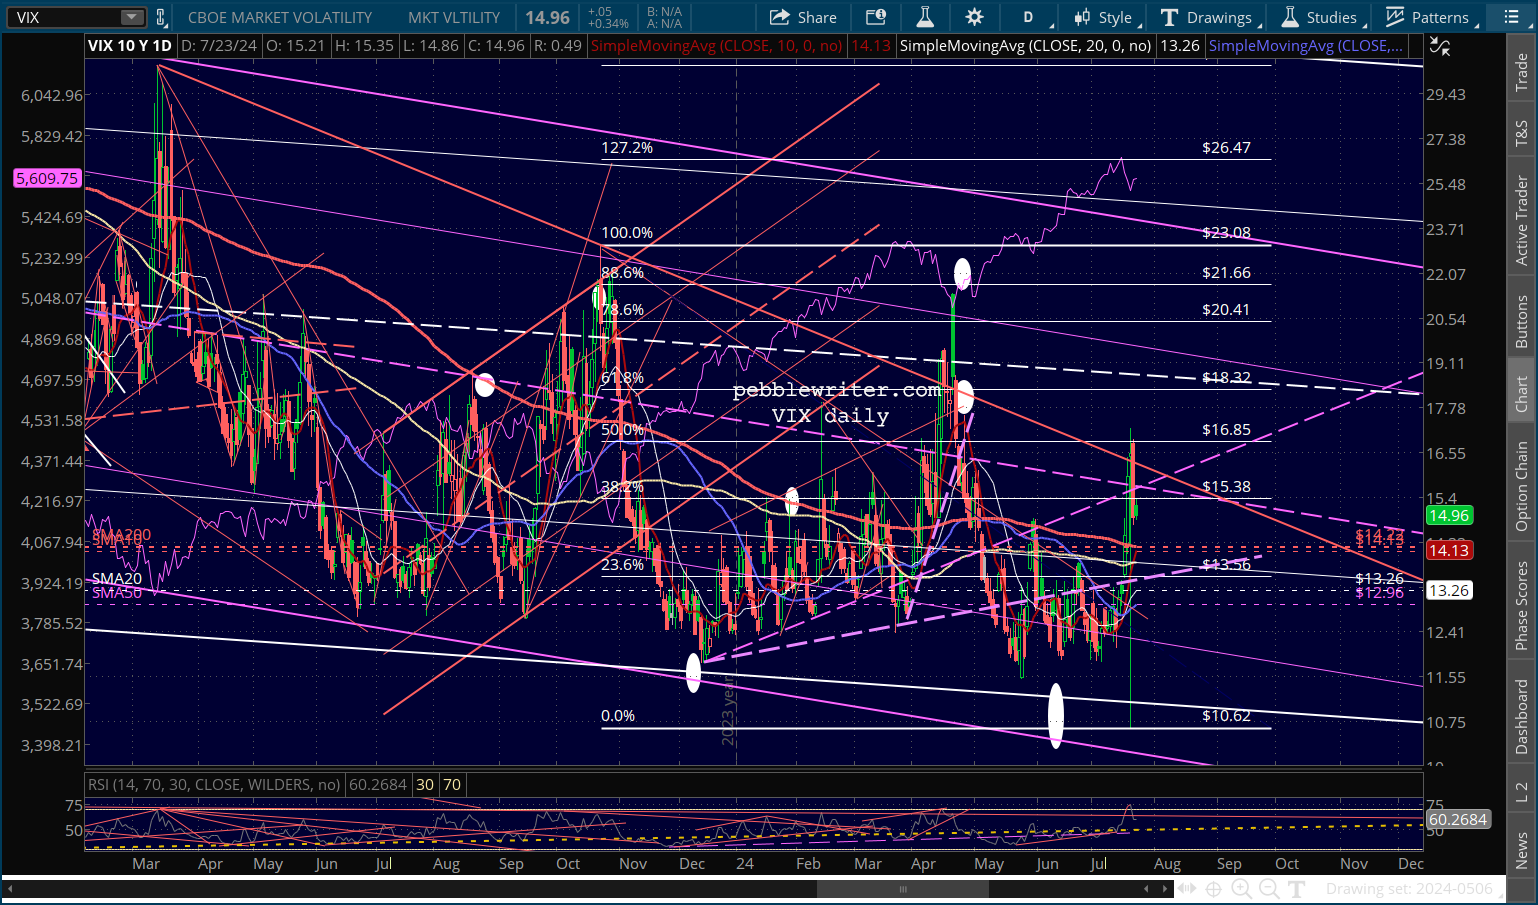
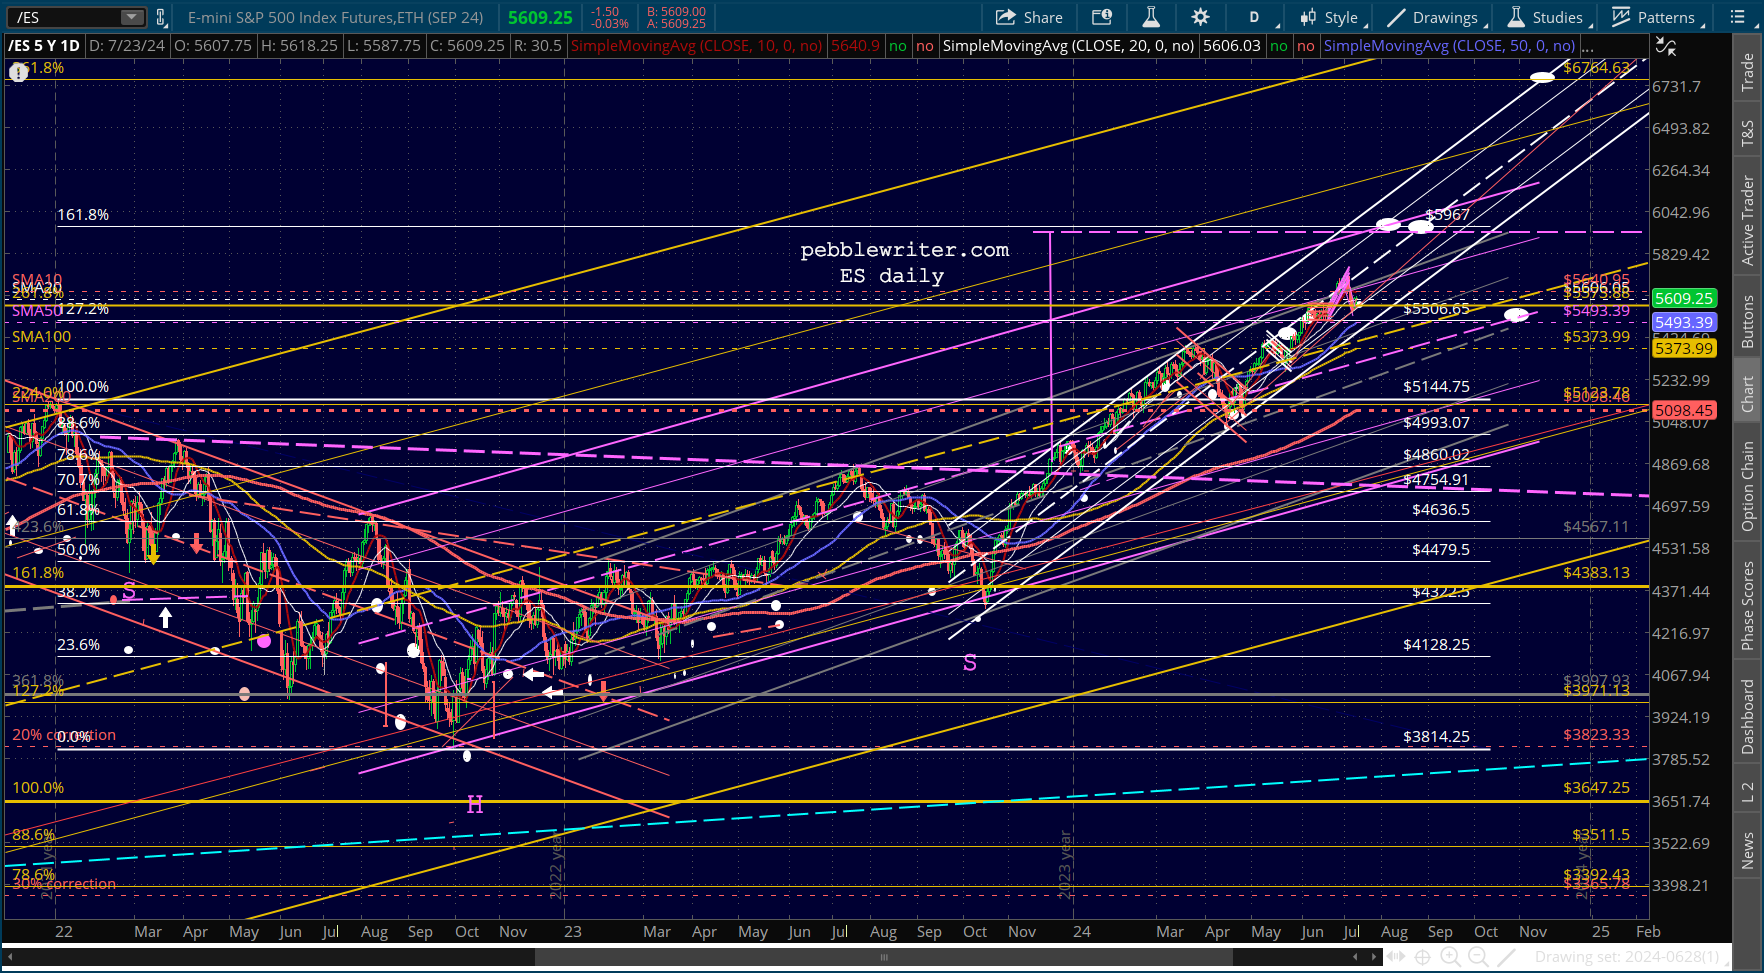
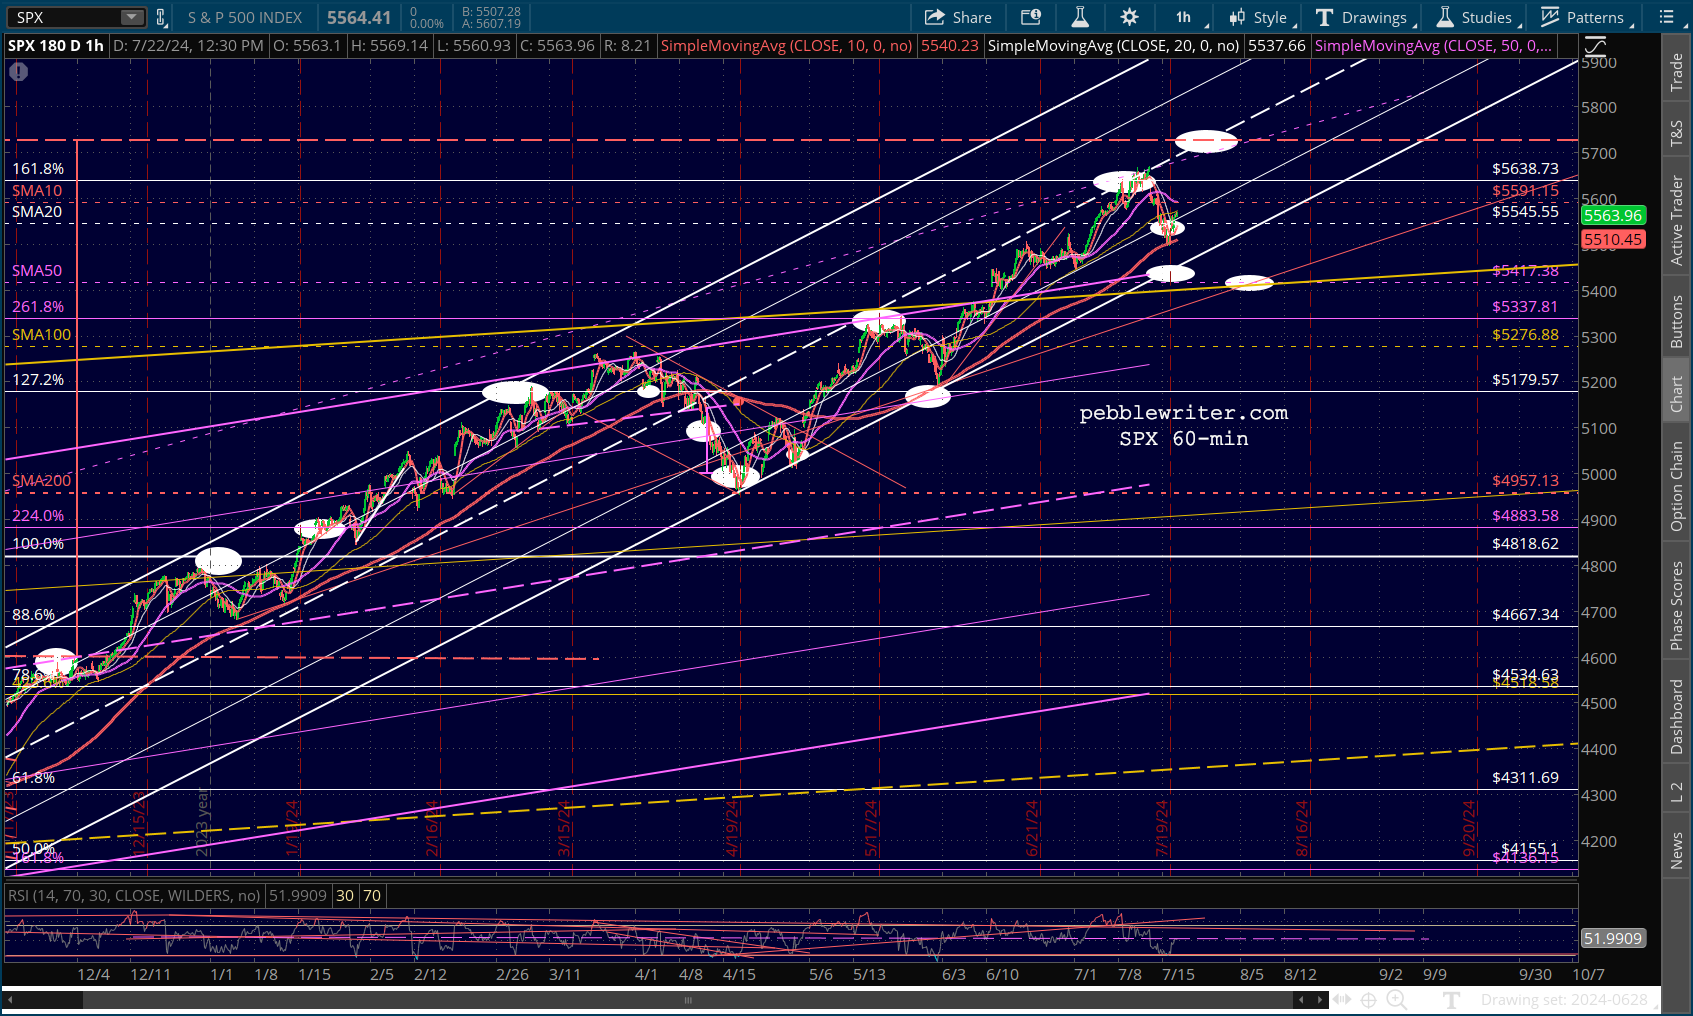
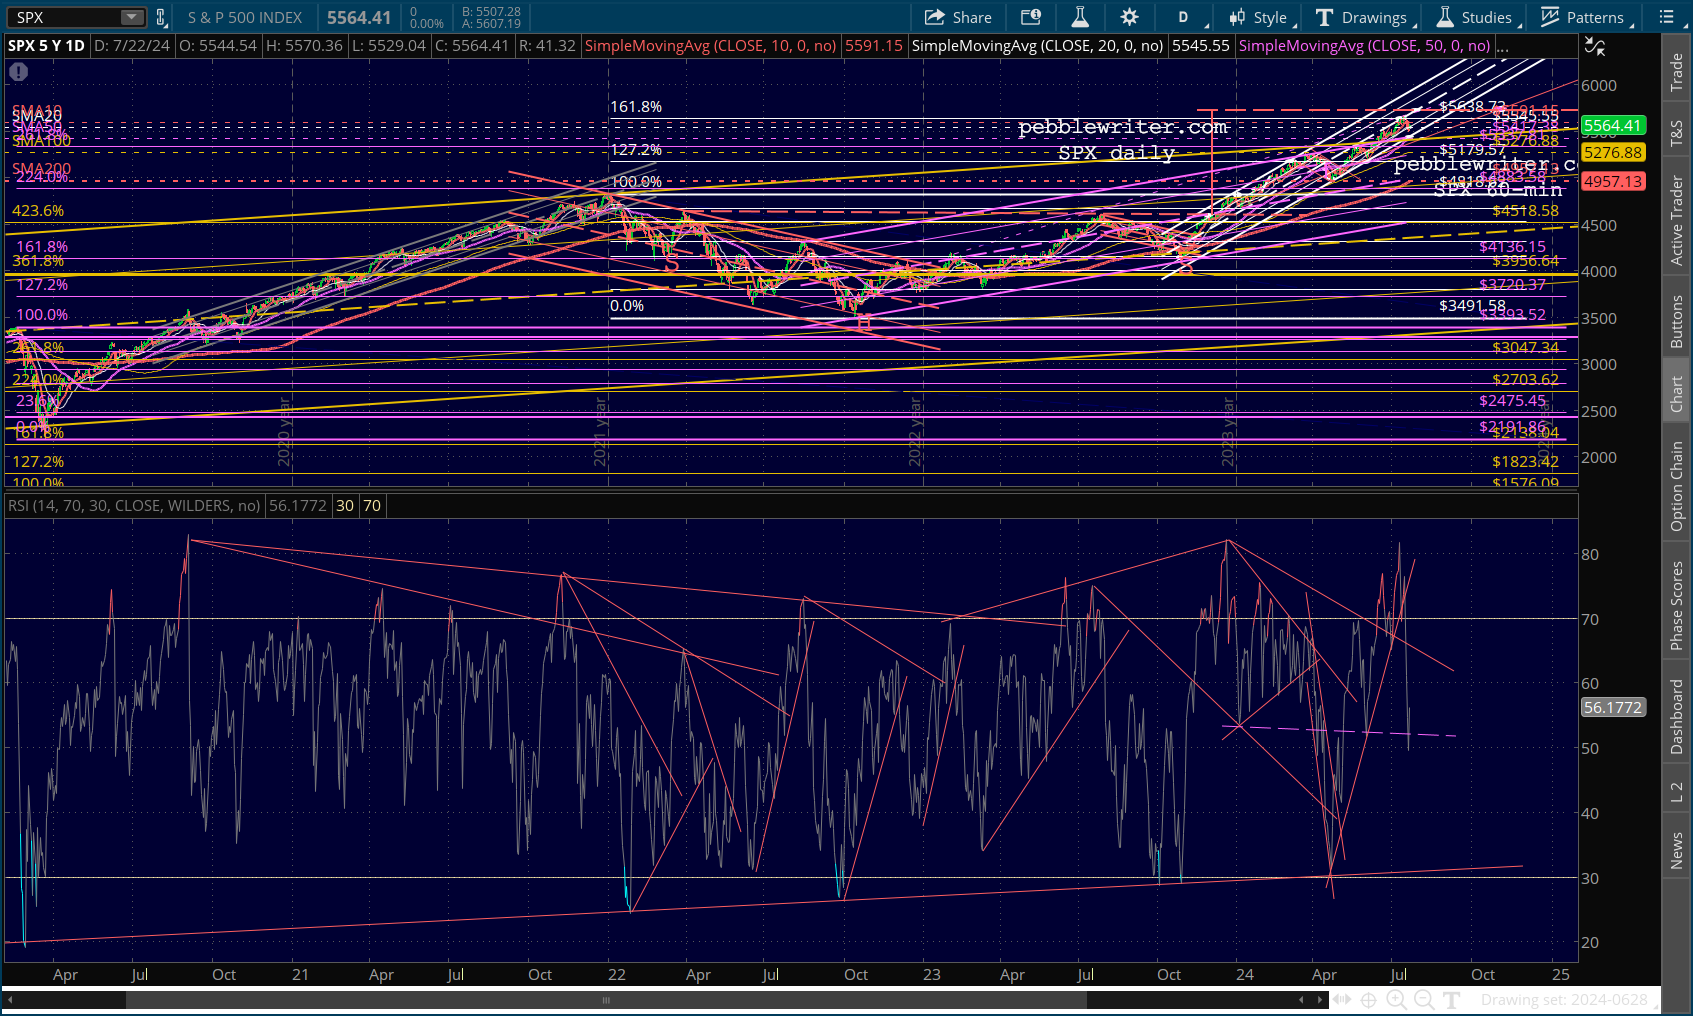
 Note that ES’s 1.618 at 5967 equates to 5885 in SPX.This would mean a push up past SPX’s 1.618 – a conflict that will need to be resolved.
 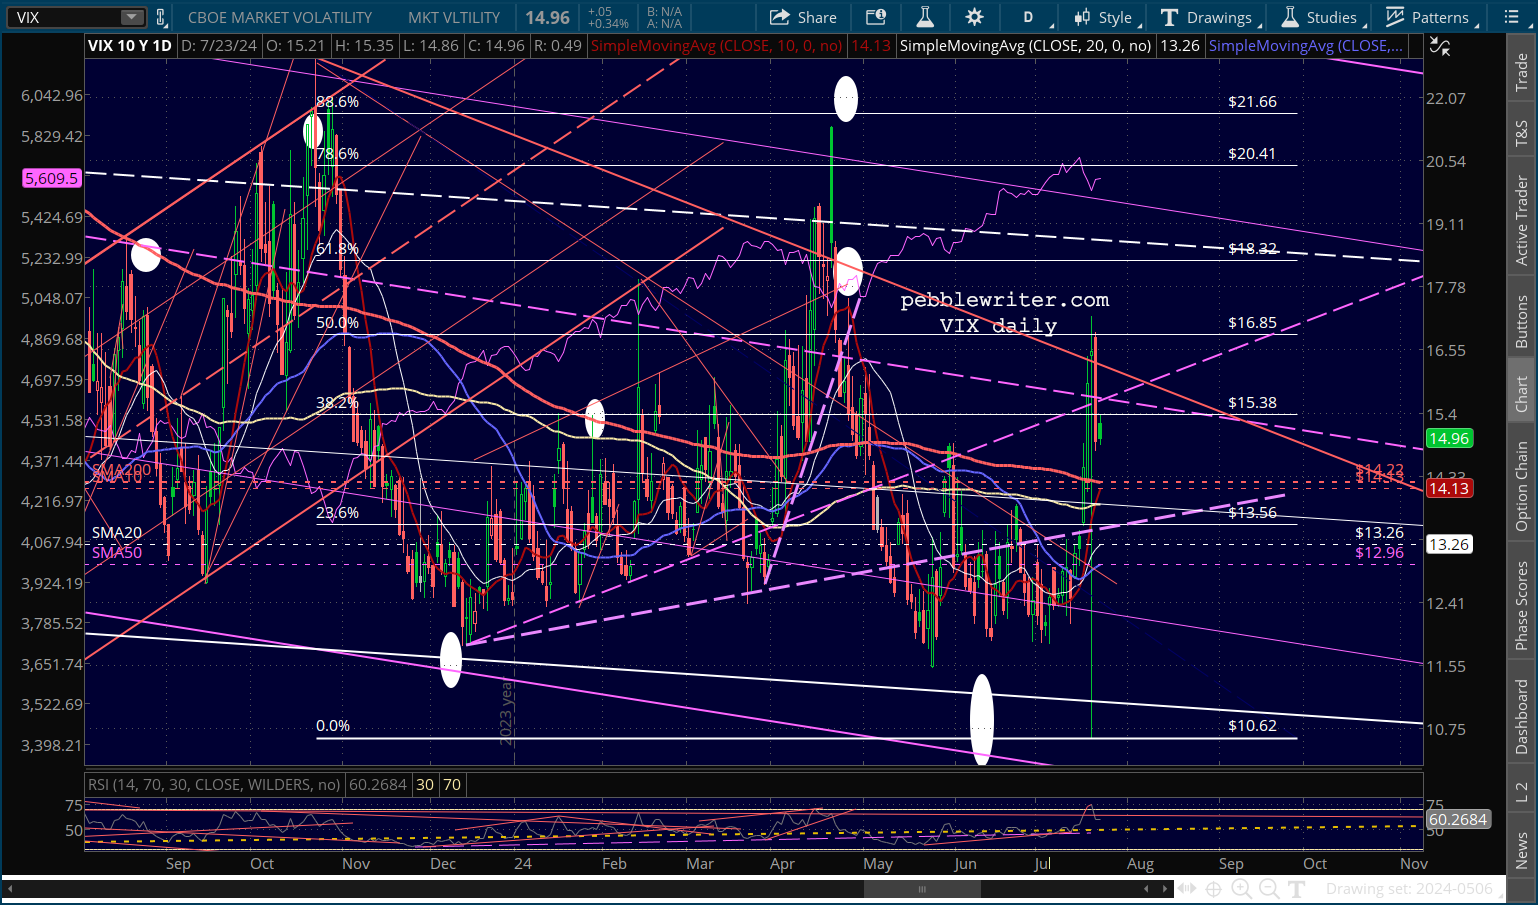 DXY has managed to slip up past its SMA200, setting up a backtest with the last red fan line and SMA50.
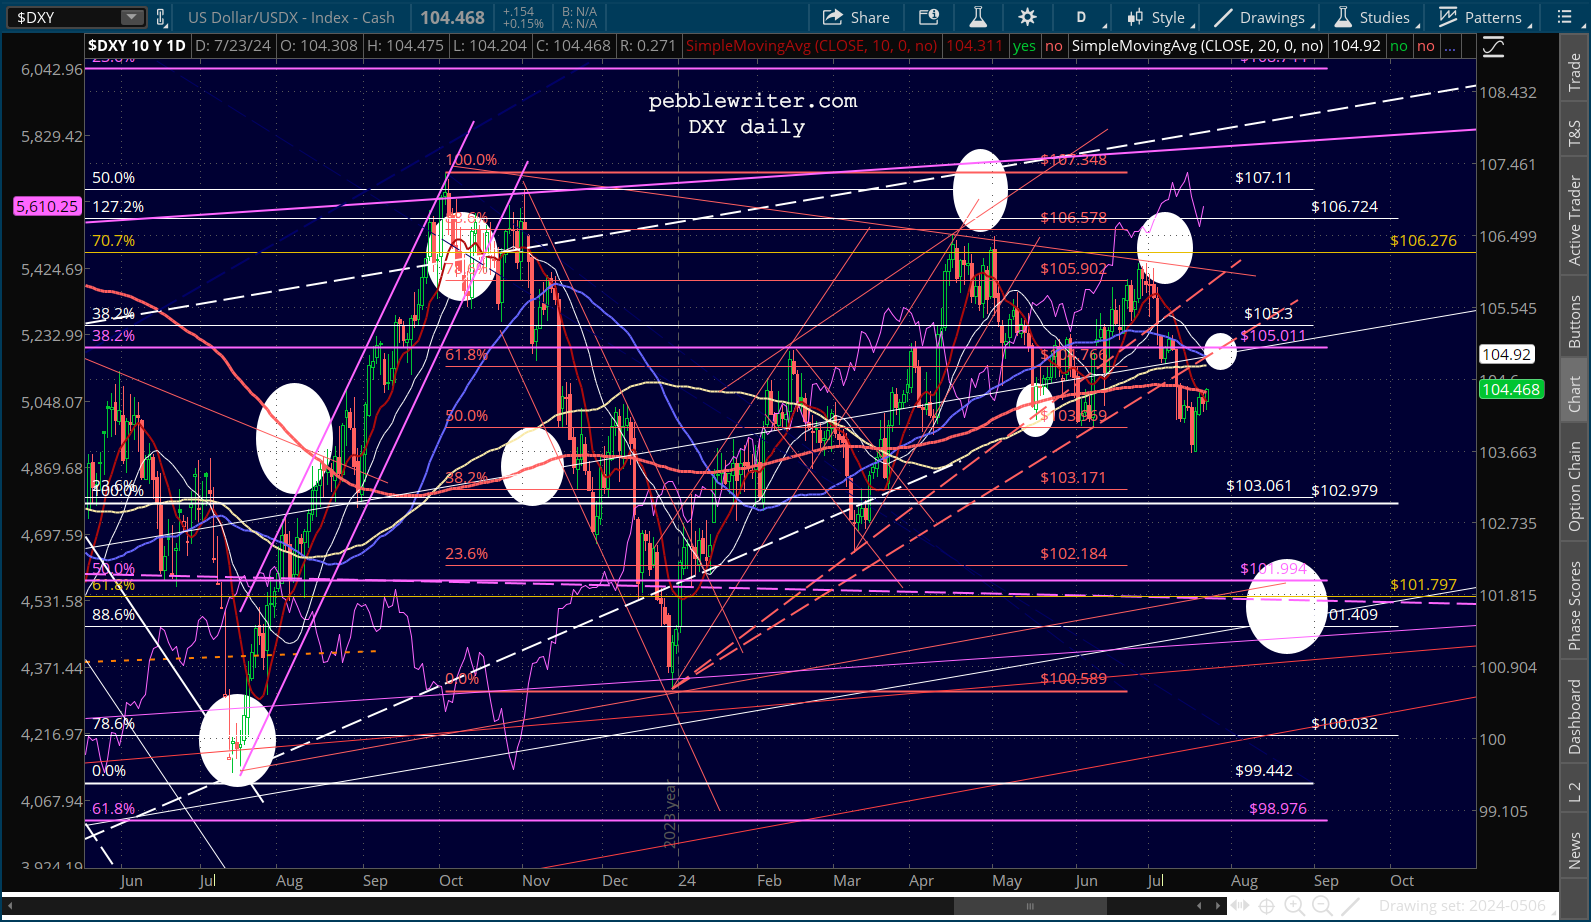
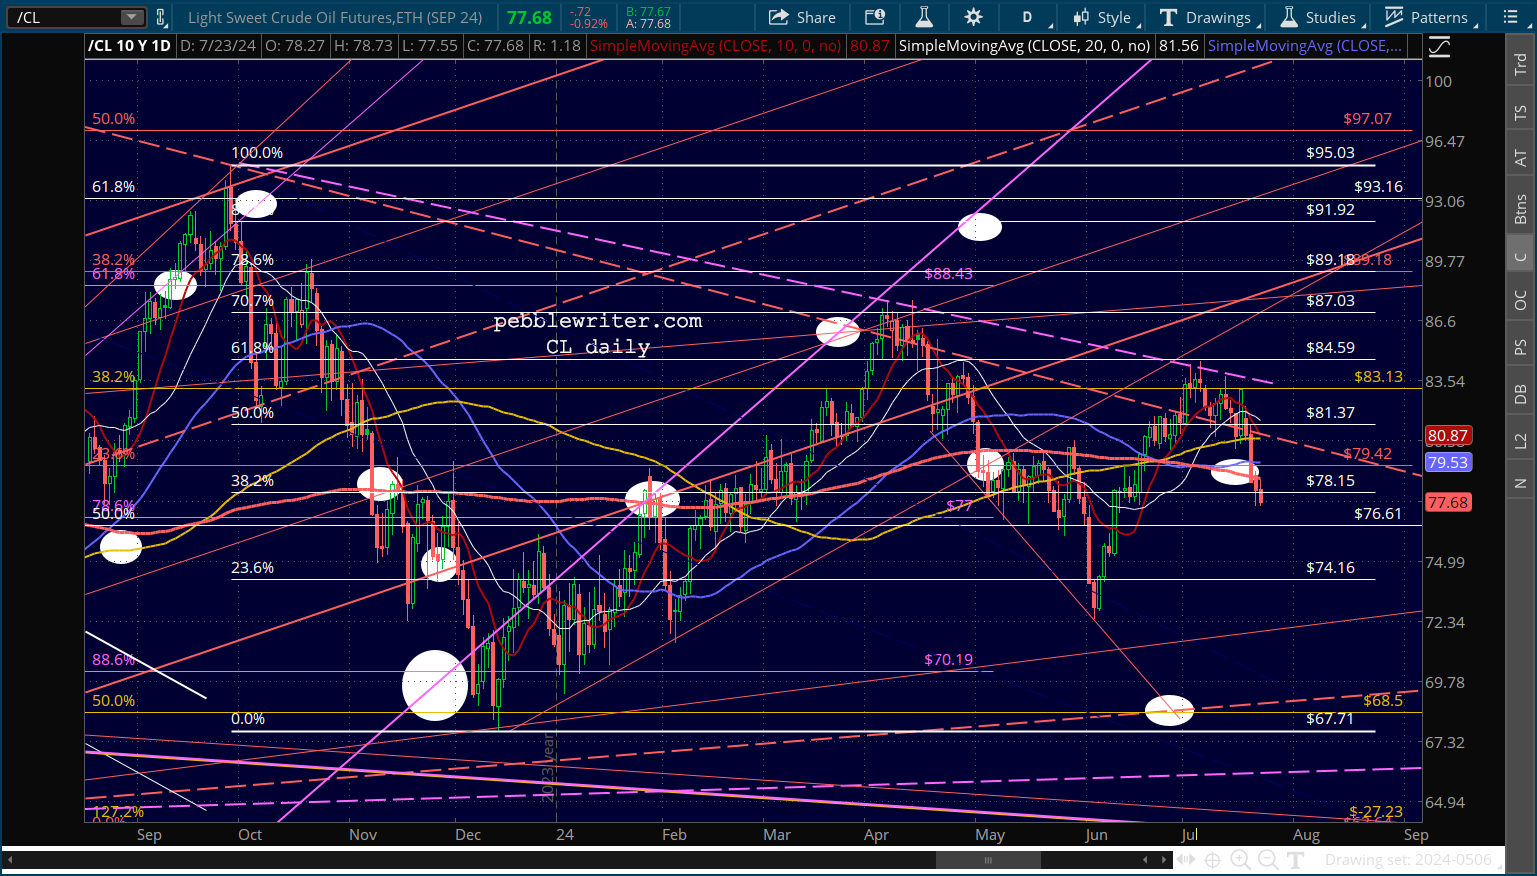
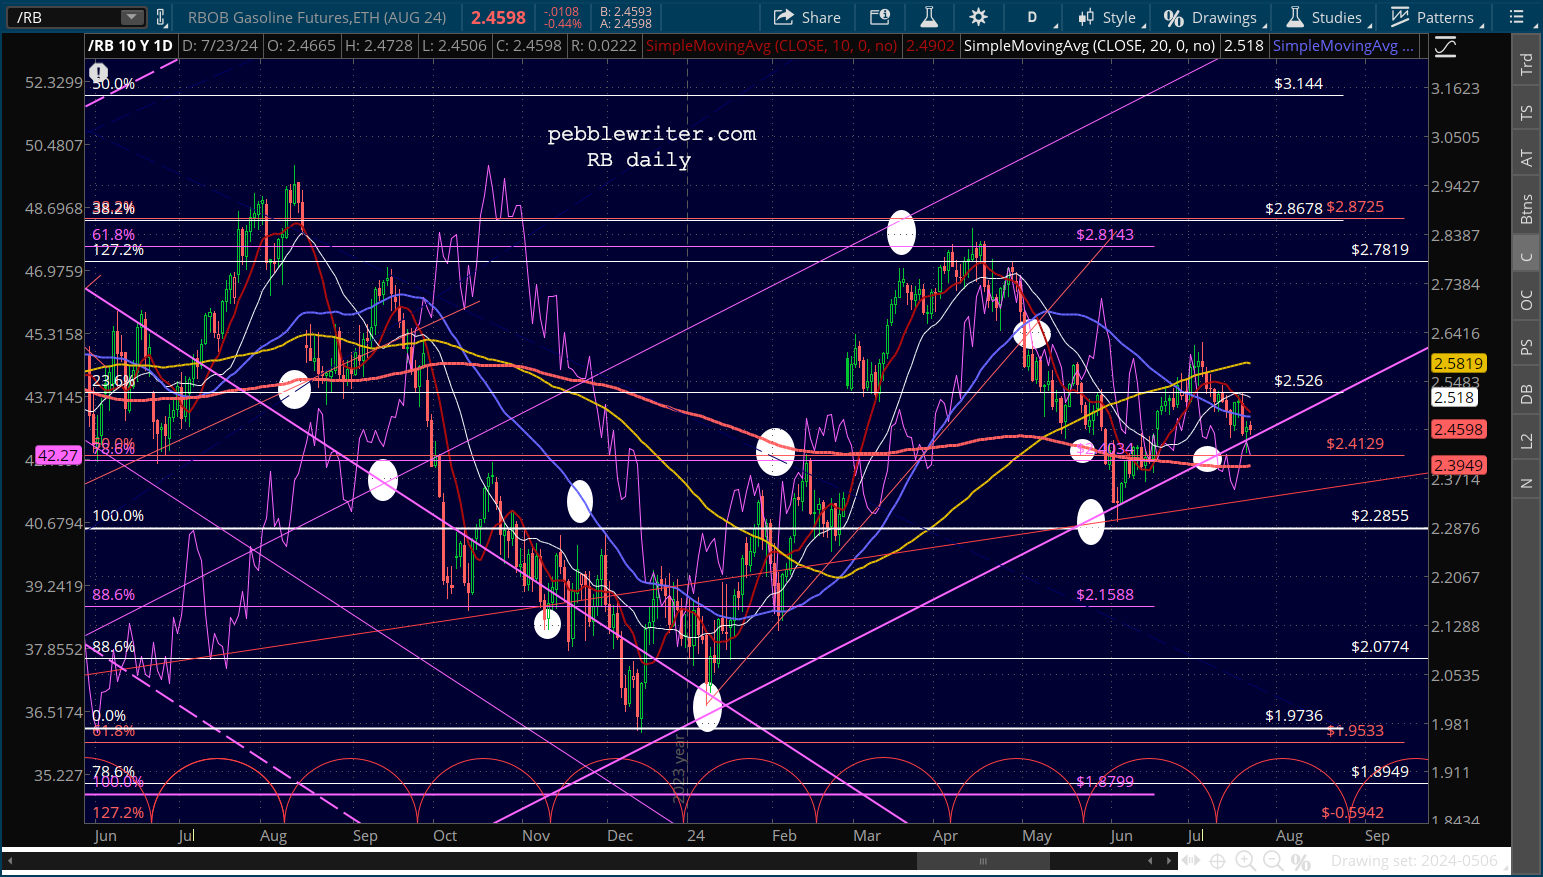
 Note that CL and RB are both making lower lows, again taking pressure off the 10Y.
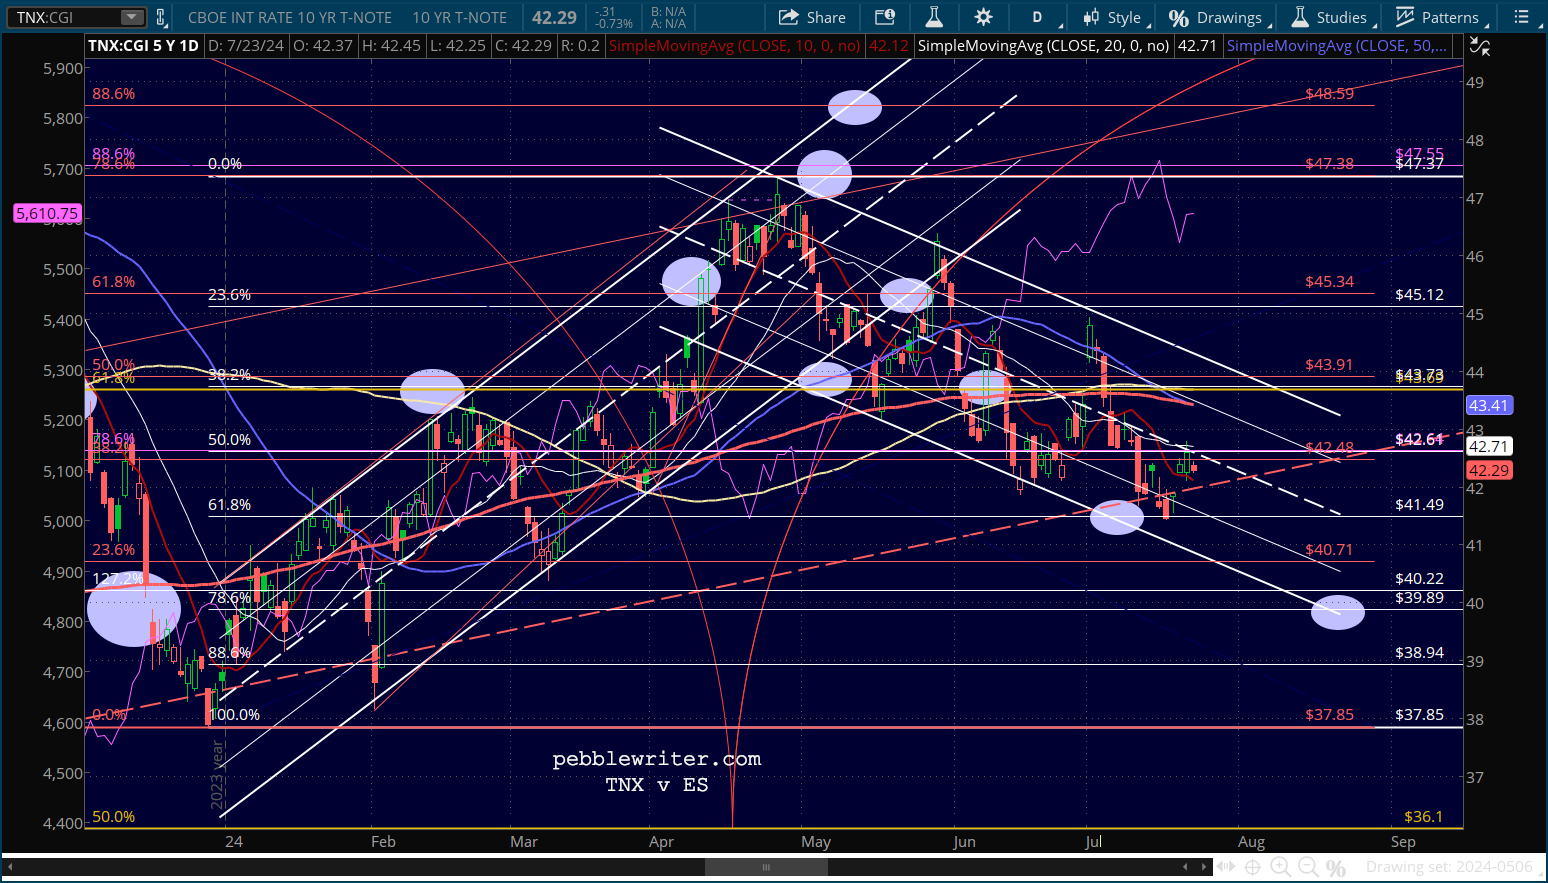 As we’ve discussed many times this past week or two, the 2s10s is in danger of steepening and reverting to a positive slope. Even a move above -13 bps would be damaging to stocks.
 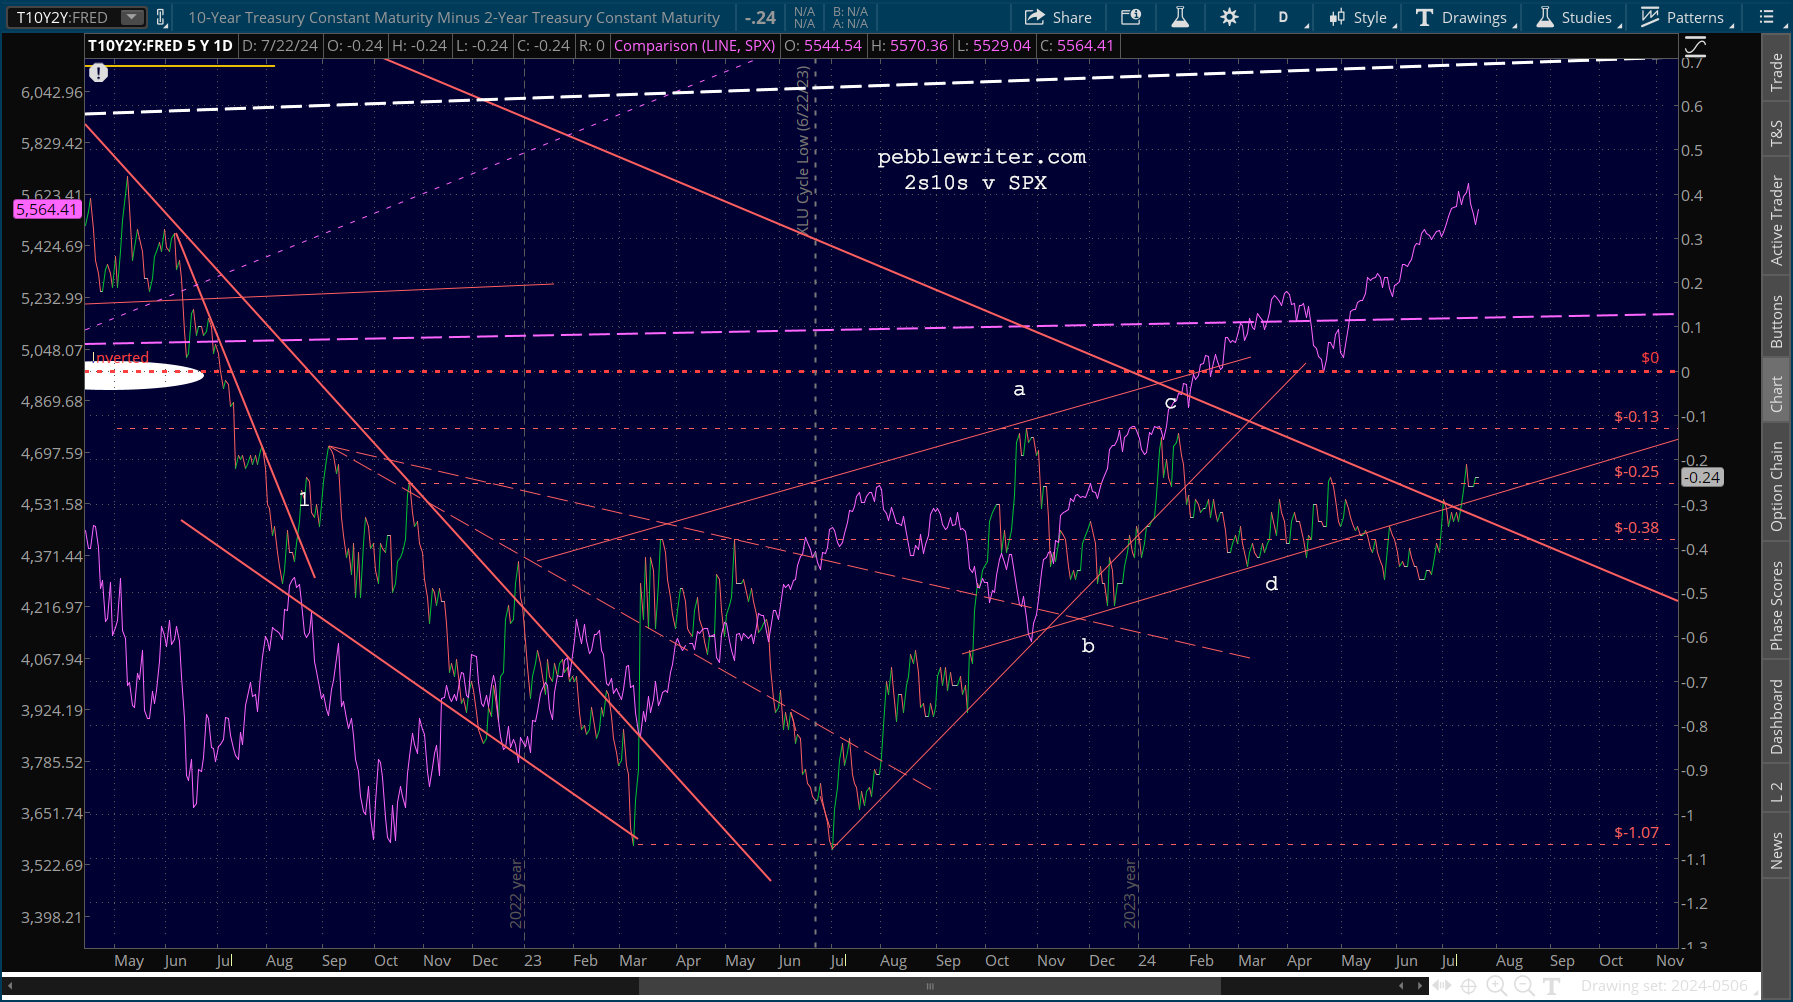 So, it’s perhaps significant that the 10Y has broken down while the 2Y has bounced – at least so far.
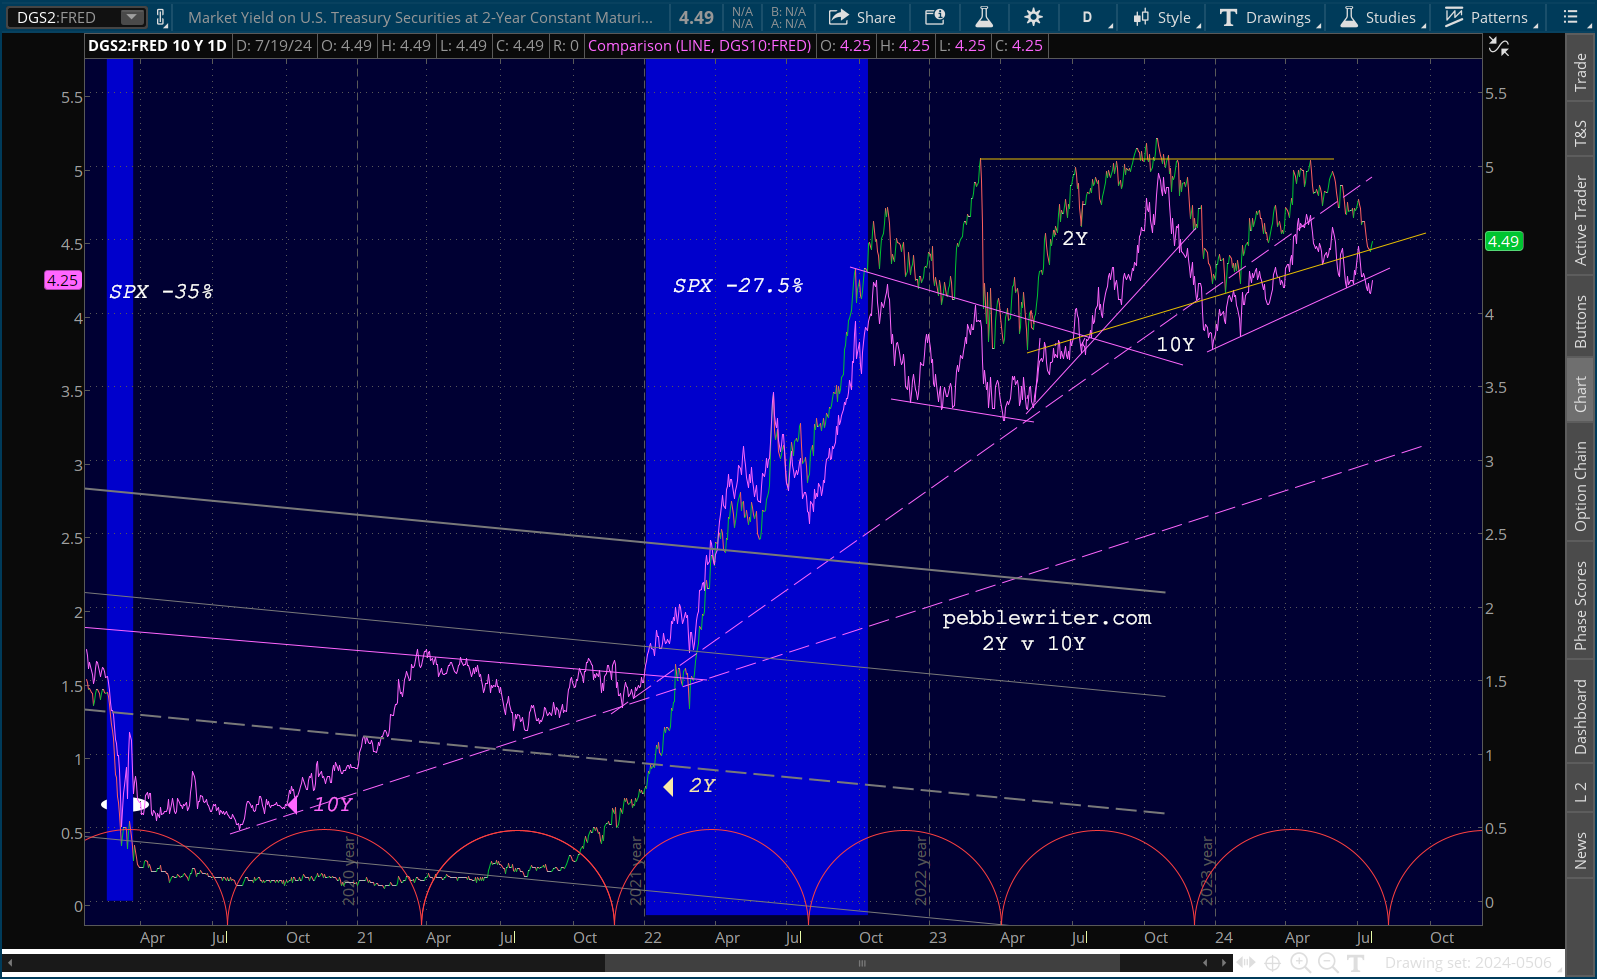
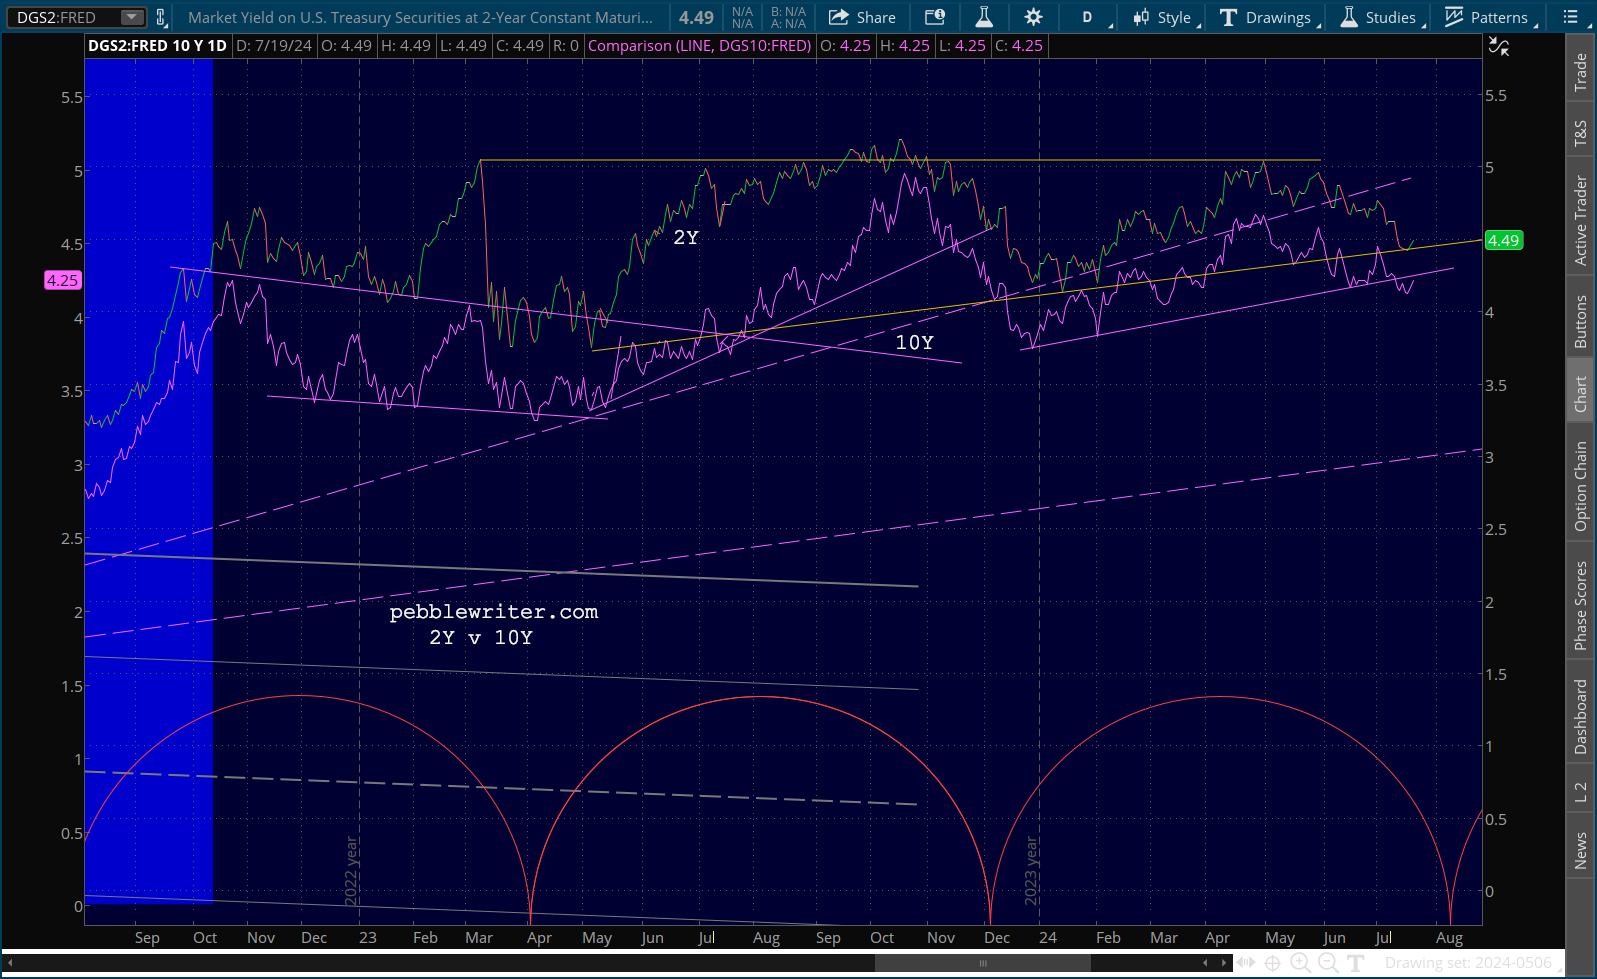 If the 10Y can hold at a backtest of the purple TL and the 2Y continues to bounce at the red TL, then the 2s10s can remain at or below -20 bps.
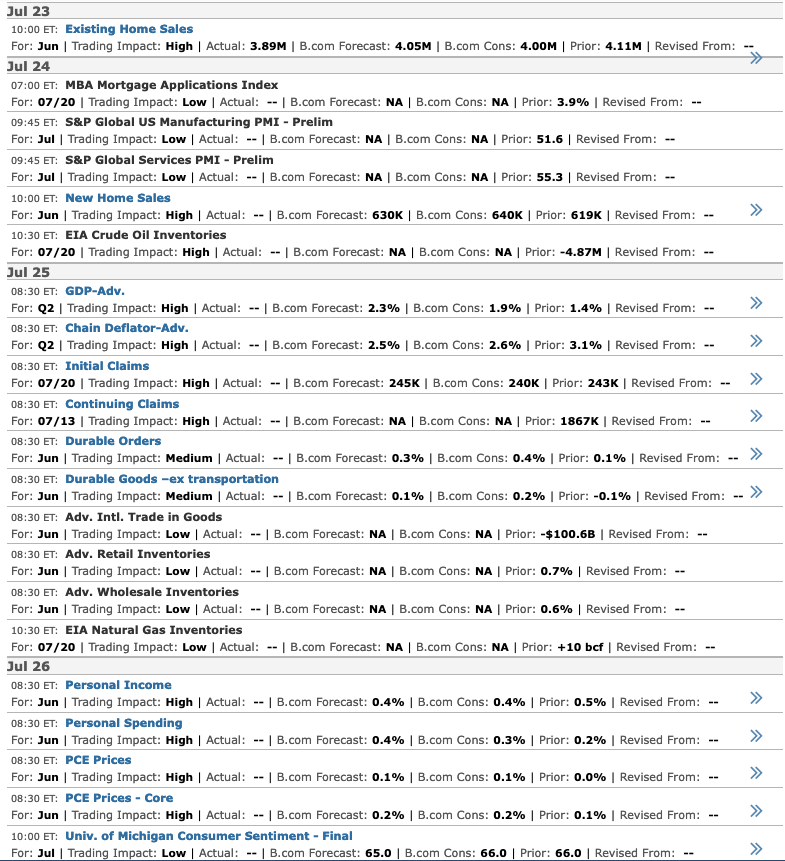
With so much important data coming out this week, there is a real risk of a mishap that reshapes the 2s10s and dings stocks.Though it’s important to consider other scenarios.
The optimal outcome for bulls would be a softening in data such as housing which helps depress 10Y yields more than it does 2Y yields. The big print, of course, is June PCE on Friday.
YoY PCE has been stuck at 2.8% since February, while MoM dipped in May to 0.1% from the previous 0.3%. A drop to, say, 2.5%/0.0% or lower would permit the Fed to consider a rate cut in July and solidify the September odds, currently at 95%. Remember, June core CPI was -0.1% and has been dropping like a rock since Mar when it was 0.4%.
The negative implications of a yield curve steepening could very well be offset by a July rate cut, either mitigating them outright or at least postponing the fallout until after the election. We’ll continue to keep a close eye on the 2s10s.
 Stay tuned…