My apologies for today’s post being so late. Our webhosting company just now fixed the “network connectivity problem in one of [their] clusters.” I’d be very upset about it except for the fact that this is the very first time in over two years that they’ve ever let me down. This post will be a retrospective instead of a look ahead at today’s session.
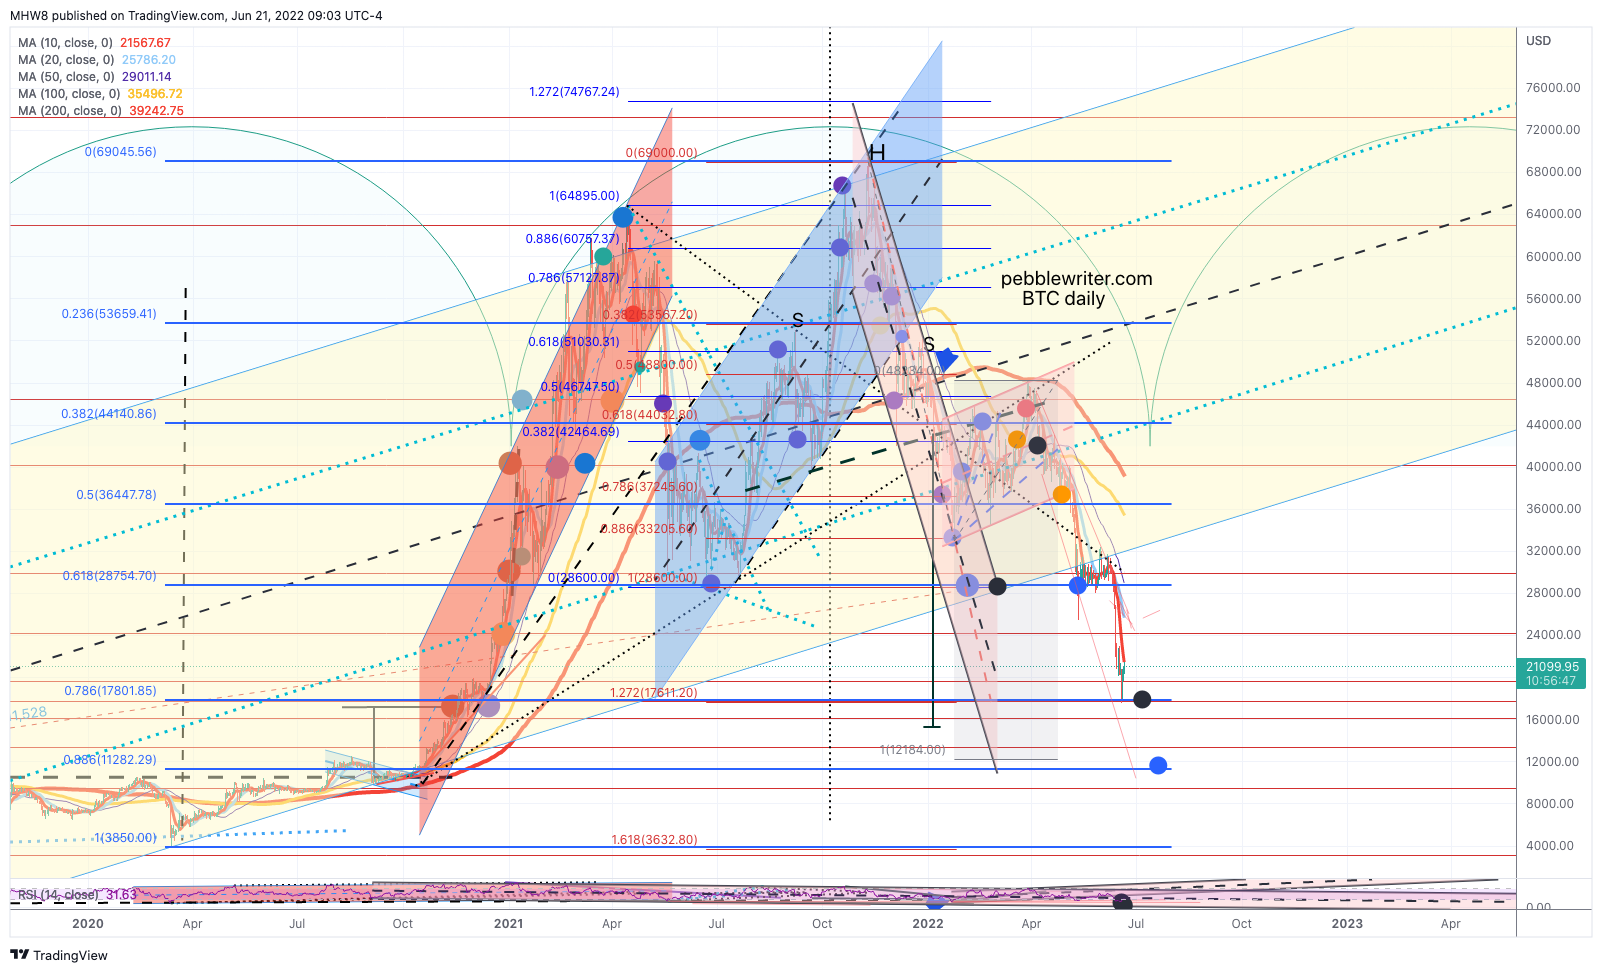
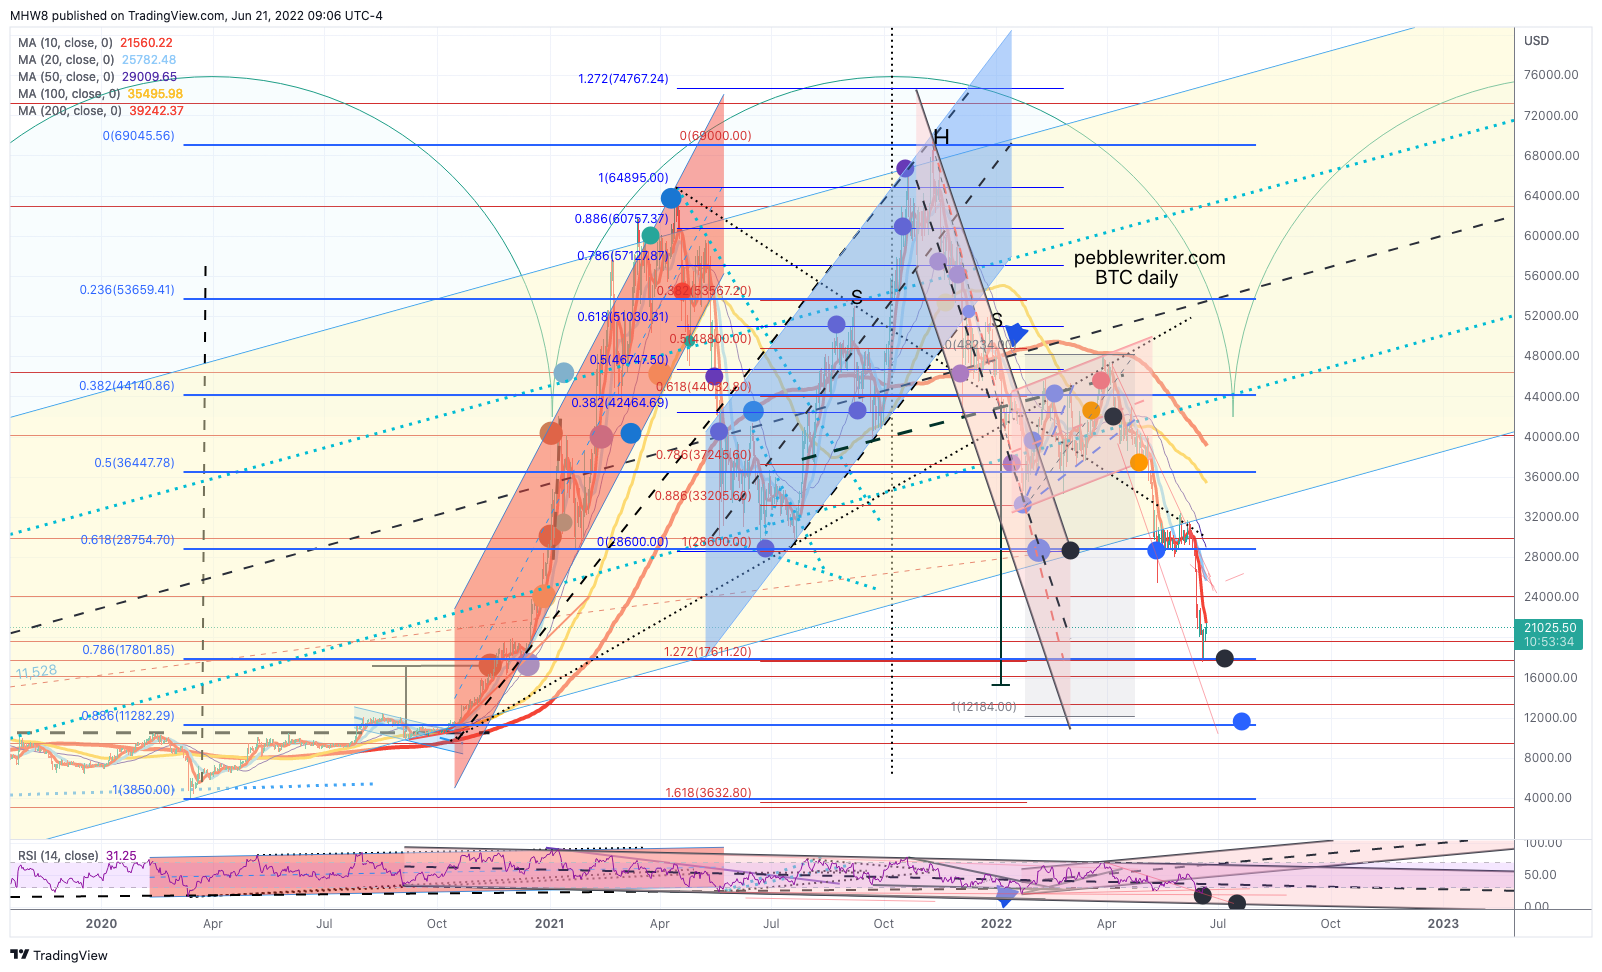
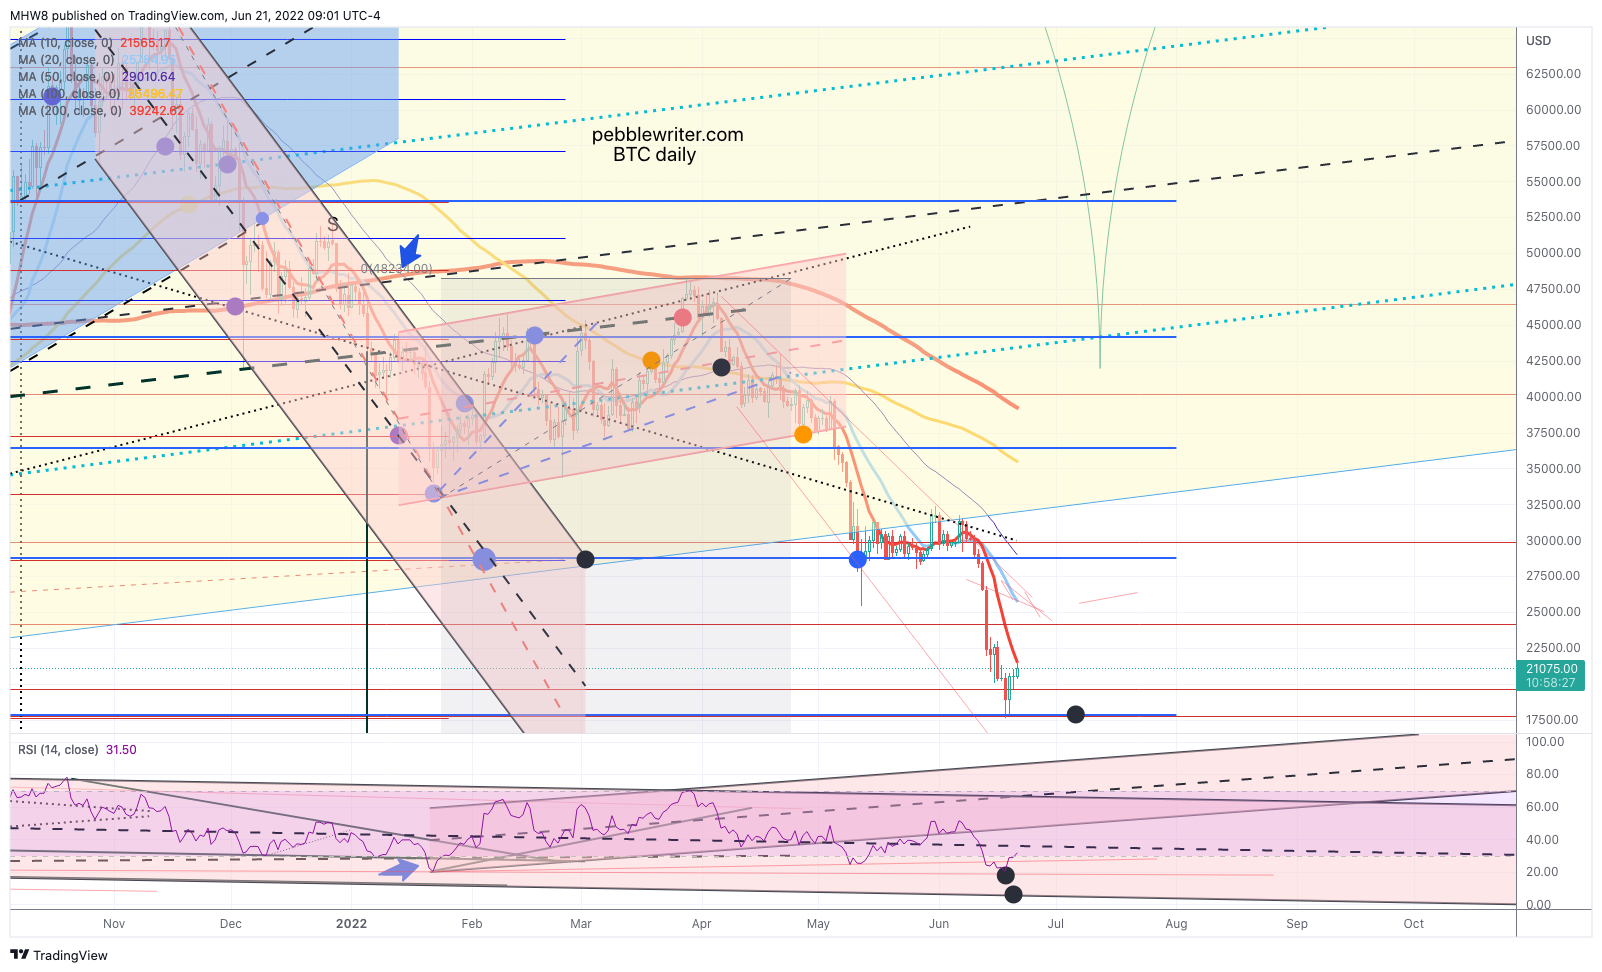
Bitcoin reached our next downside target over the weekend: the dual Fibonacci targets of 17,611/17,692. Like everything else over the holiday weekend, it bounced pretty strongly. And, just like everything else, it won’t last. As we detailed in our last BTC update [see: Bitcoin’s Meltdown] there is substantially more downside ahead.
 continued for members…
This is where things stood this morning in the moments before the site went down…
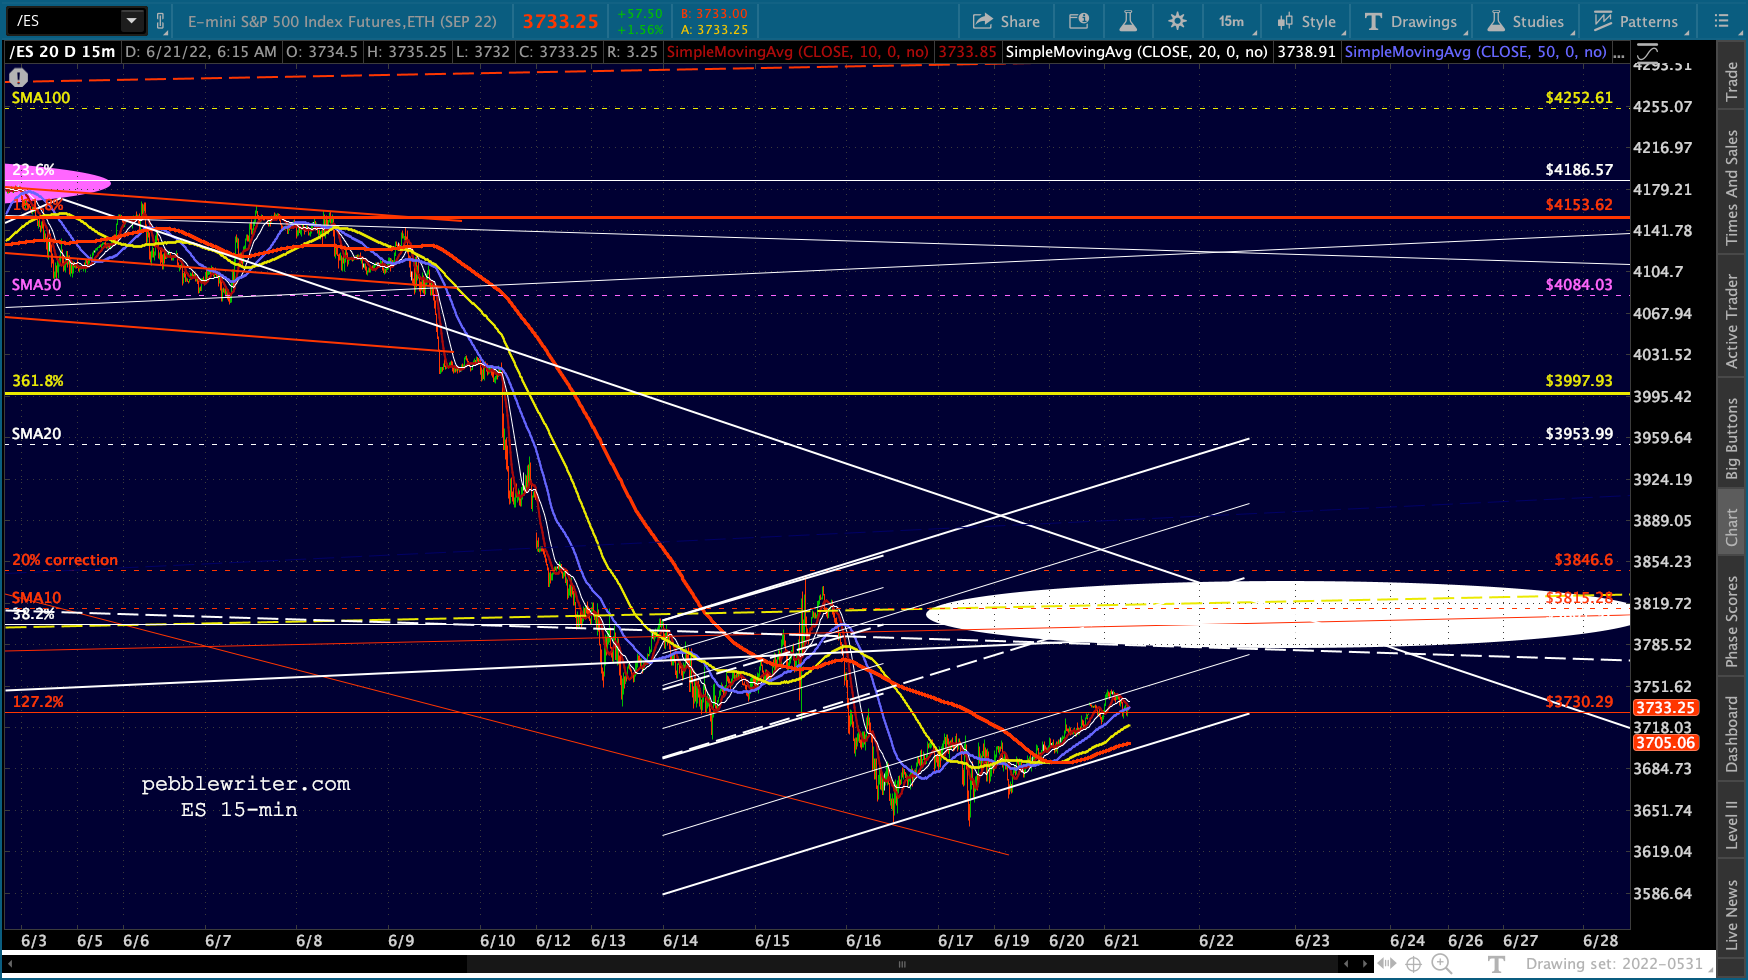
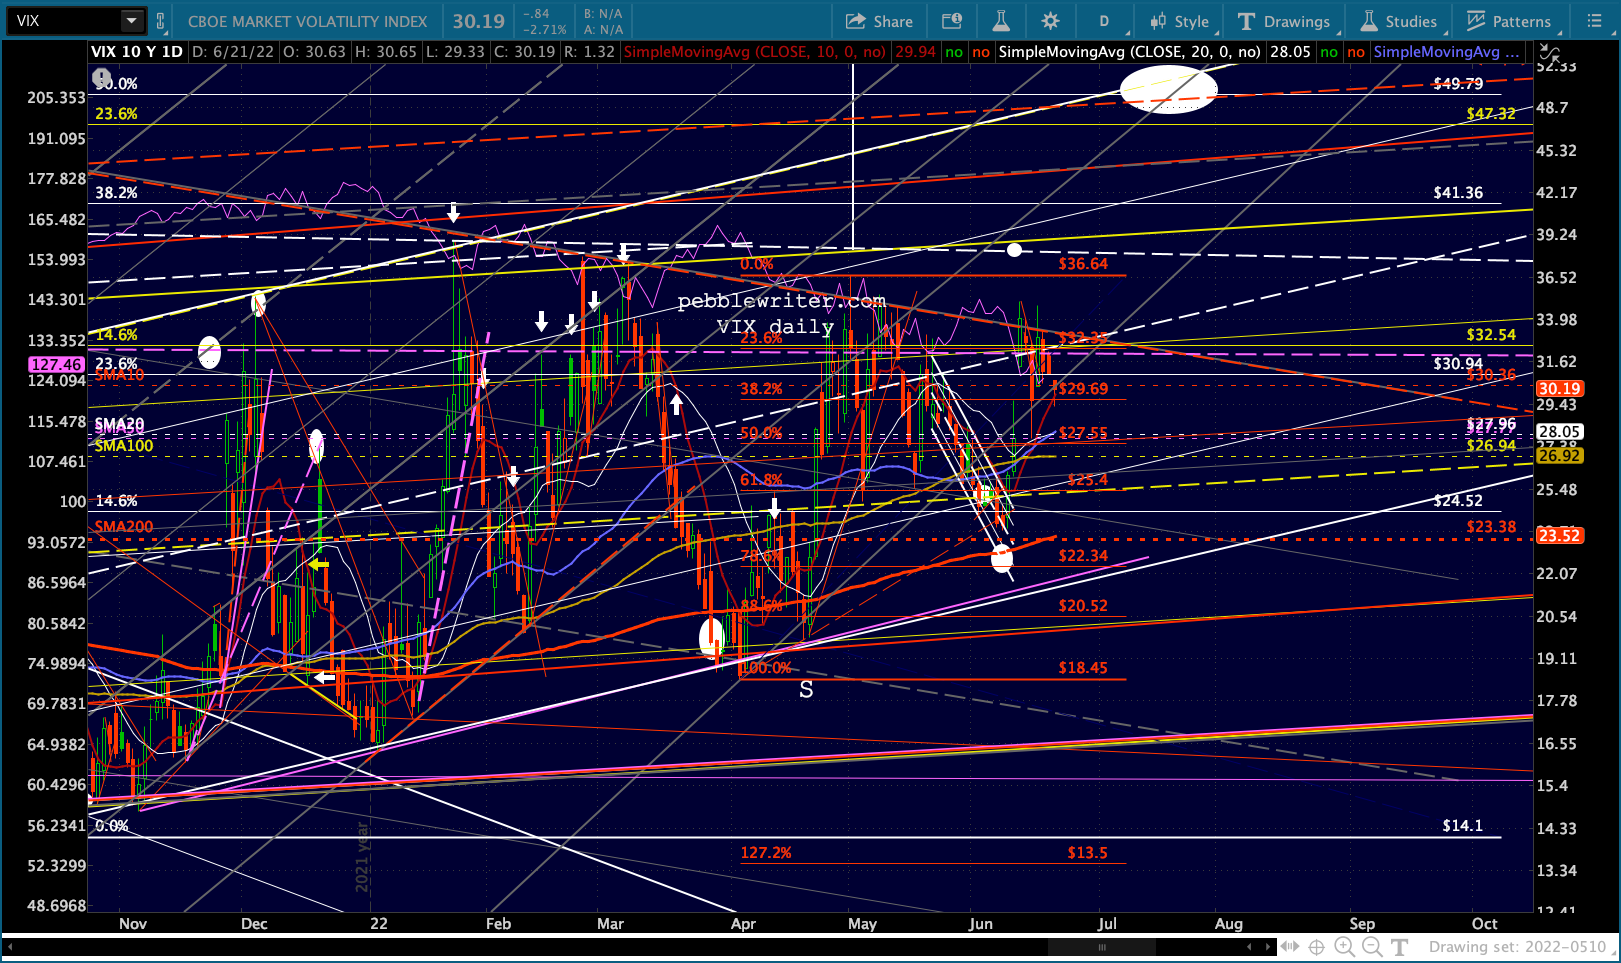
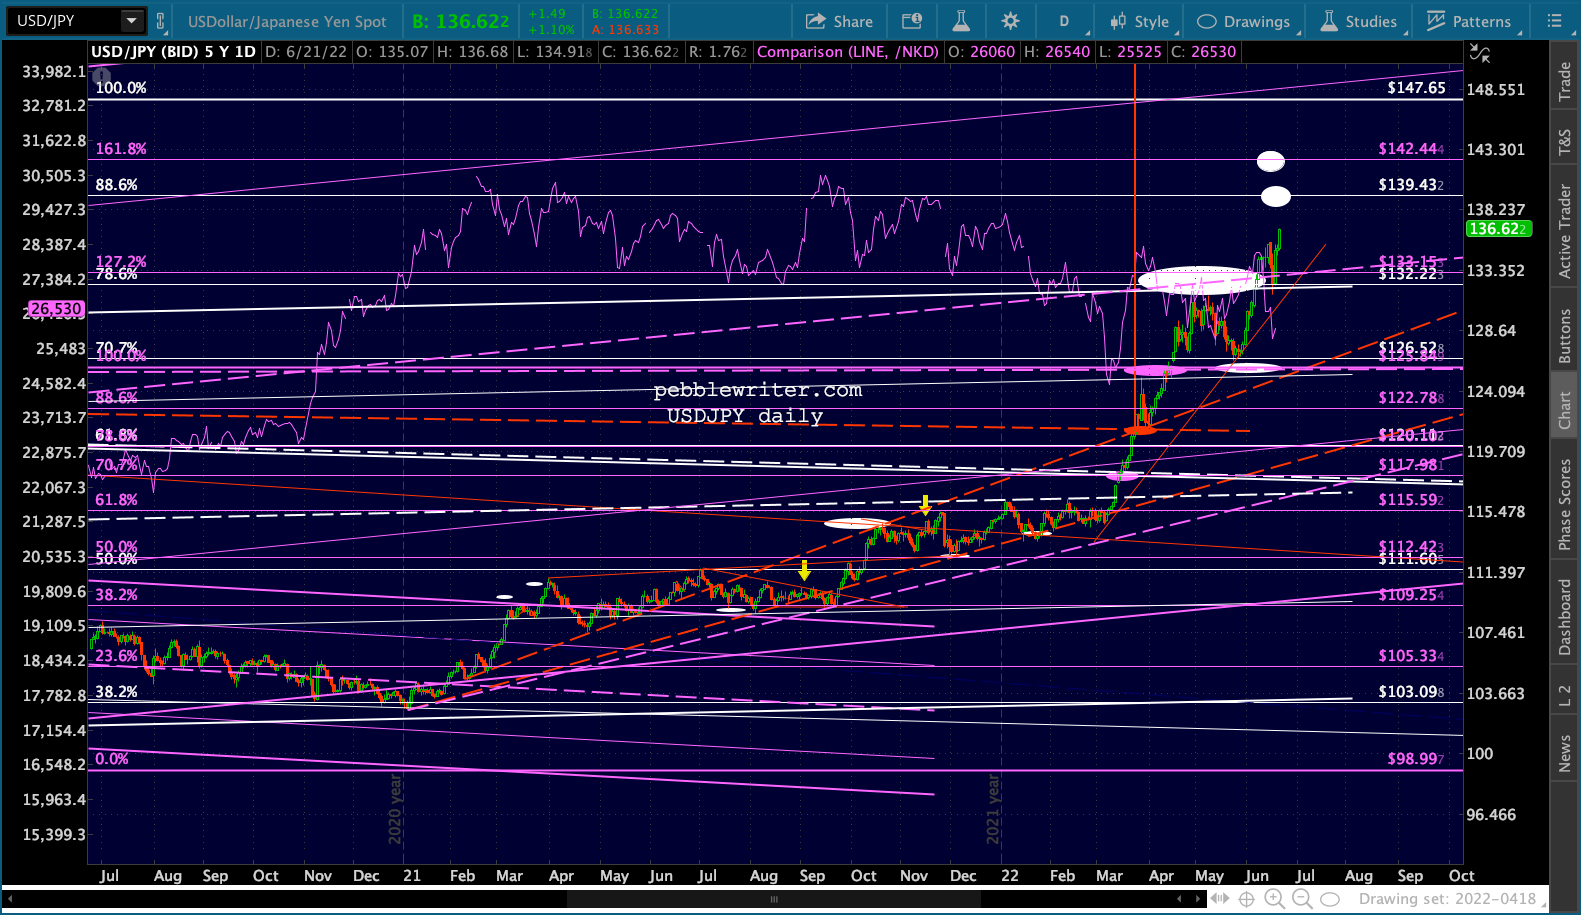
 Although VIX was off earlier, it was USDJPY that was really ramping stocks higher.
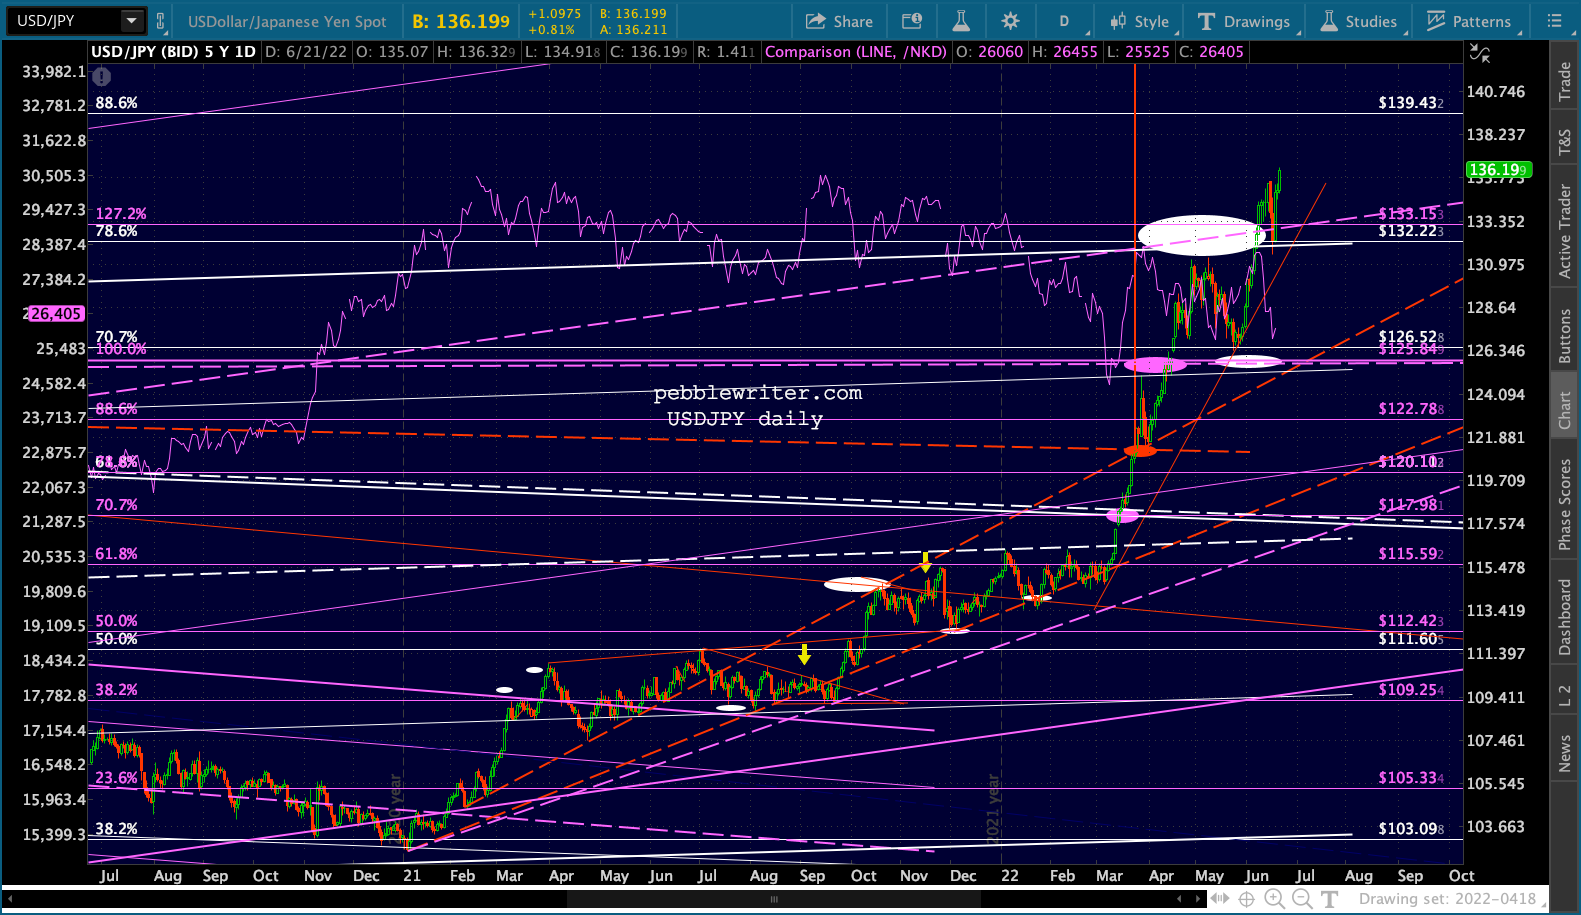
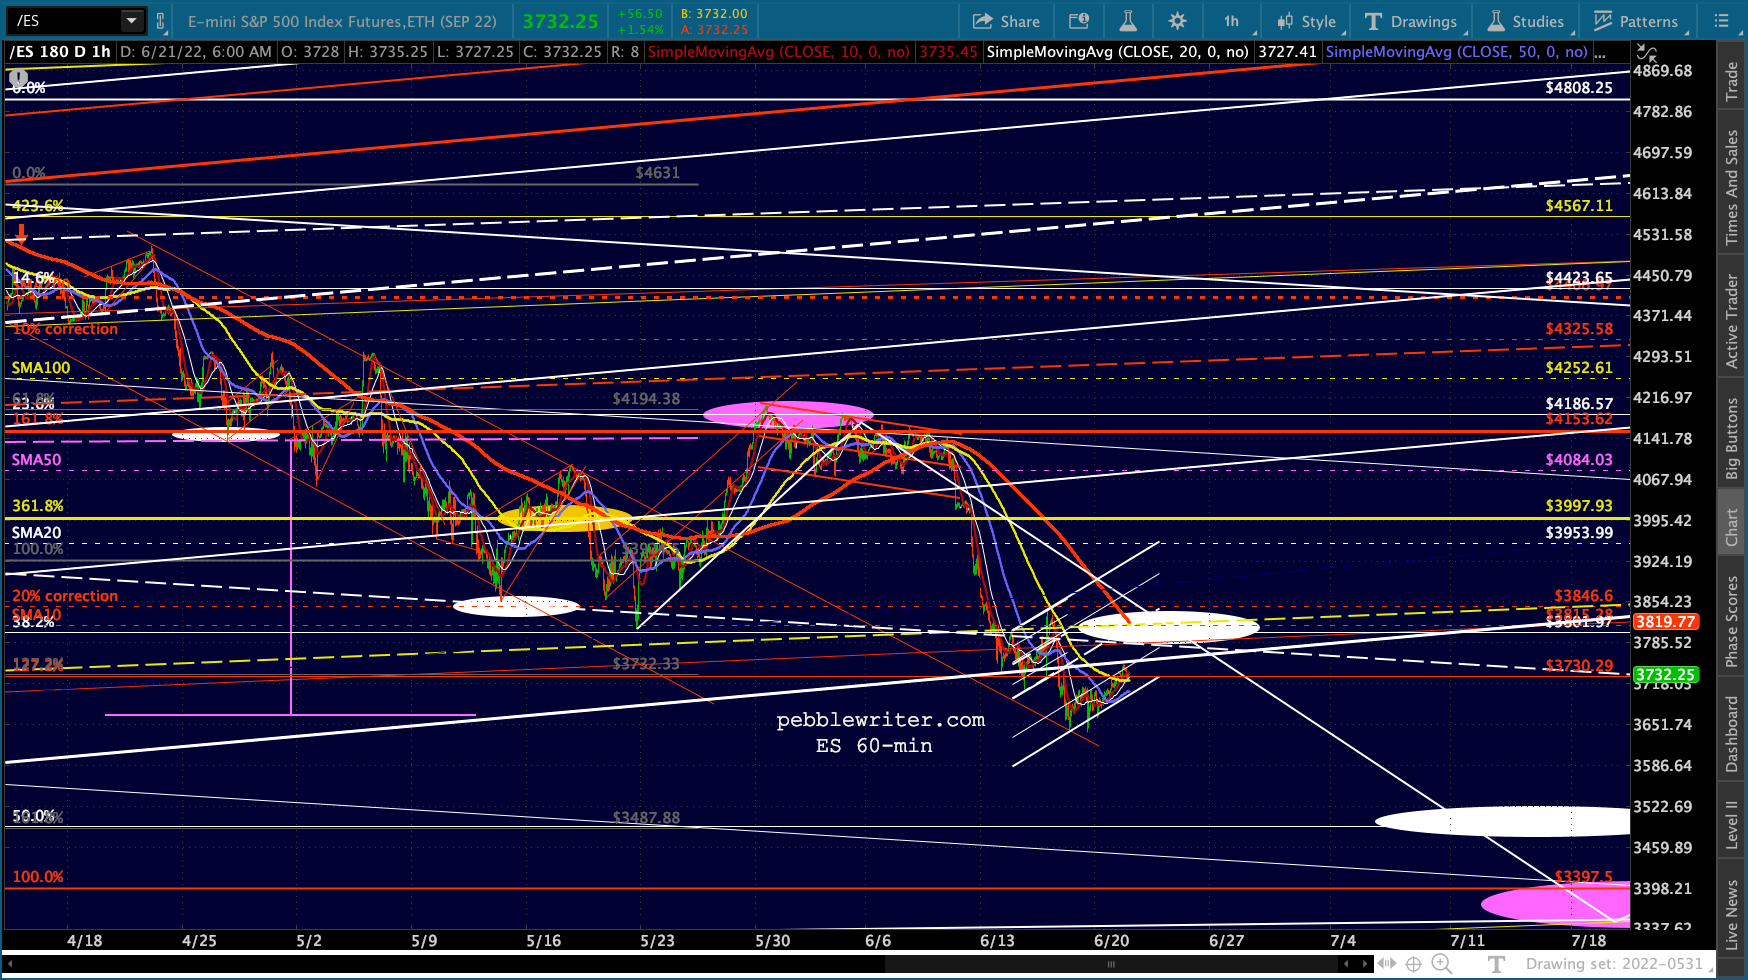
 And, this is where we ended up.
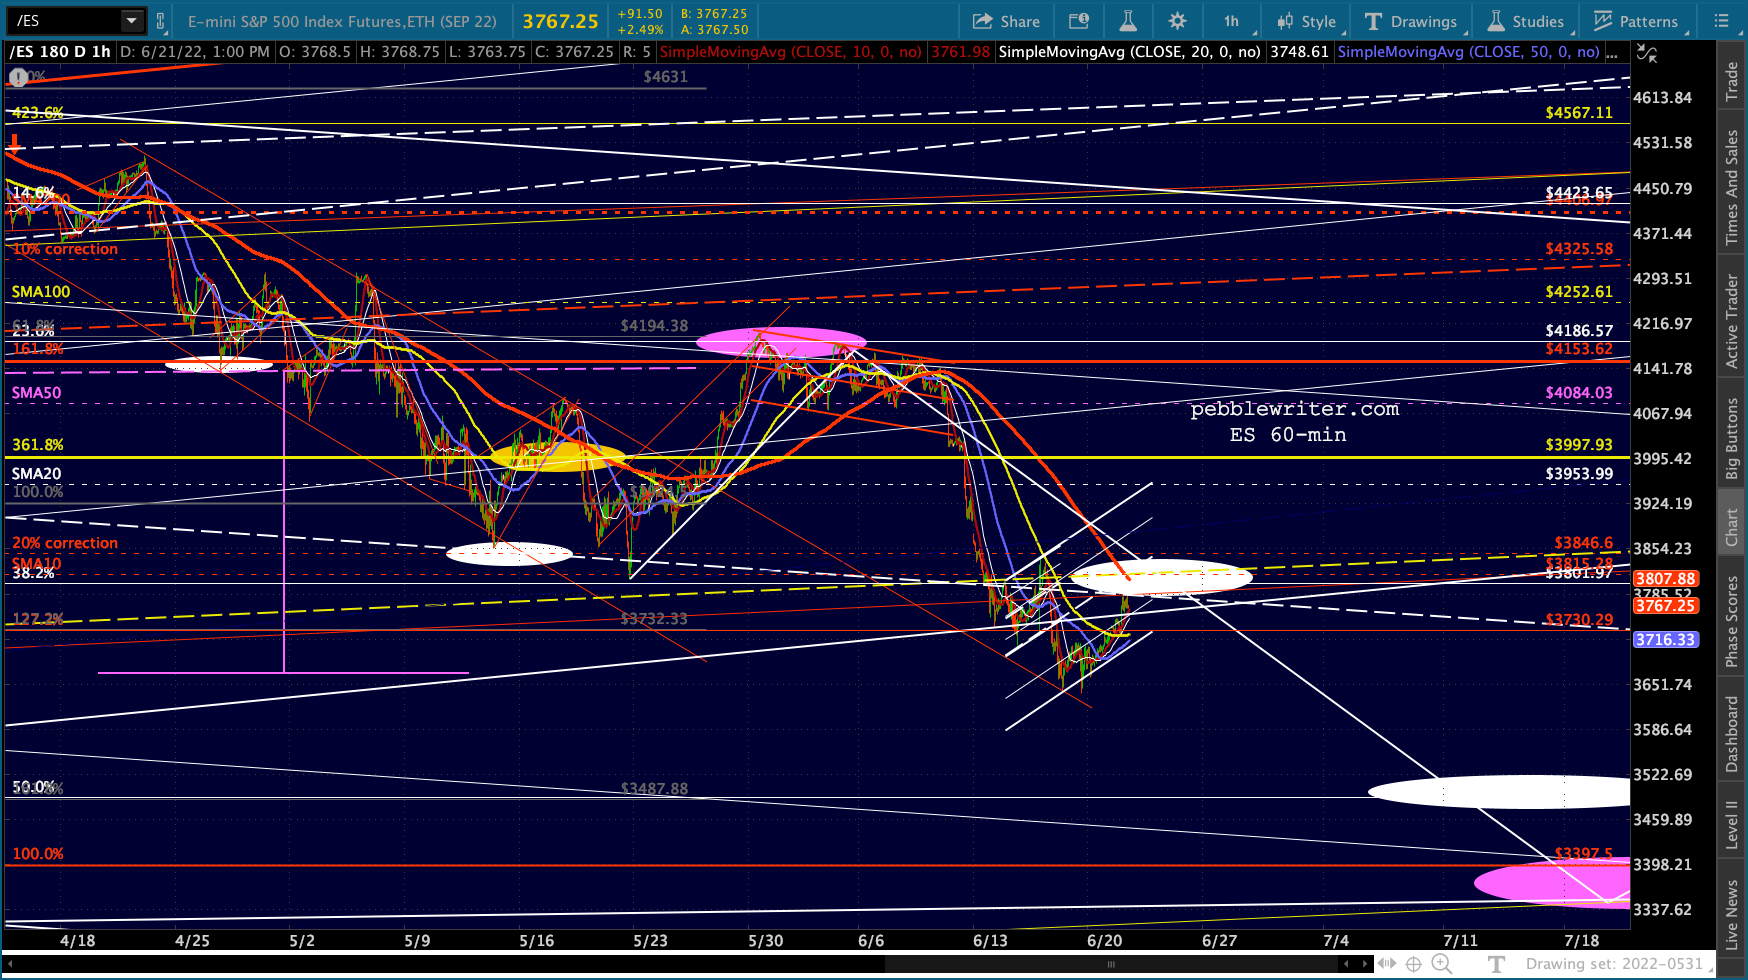 ES and SPX are both backtesting channel midlines and, more importantly, are returning to the vicinity of the solid white lines that connect the last target and the next.
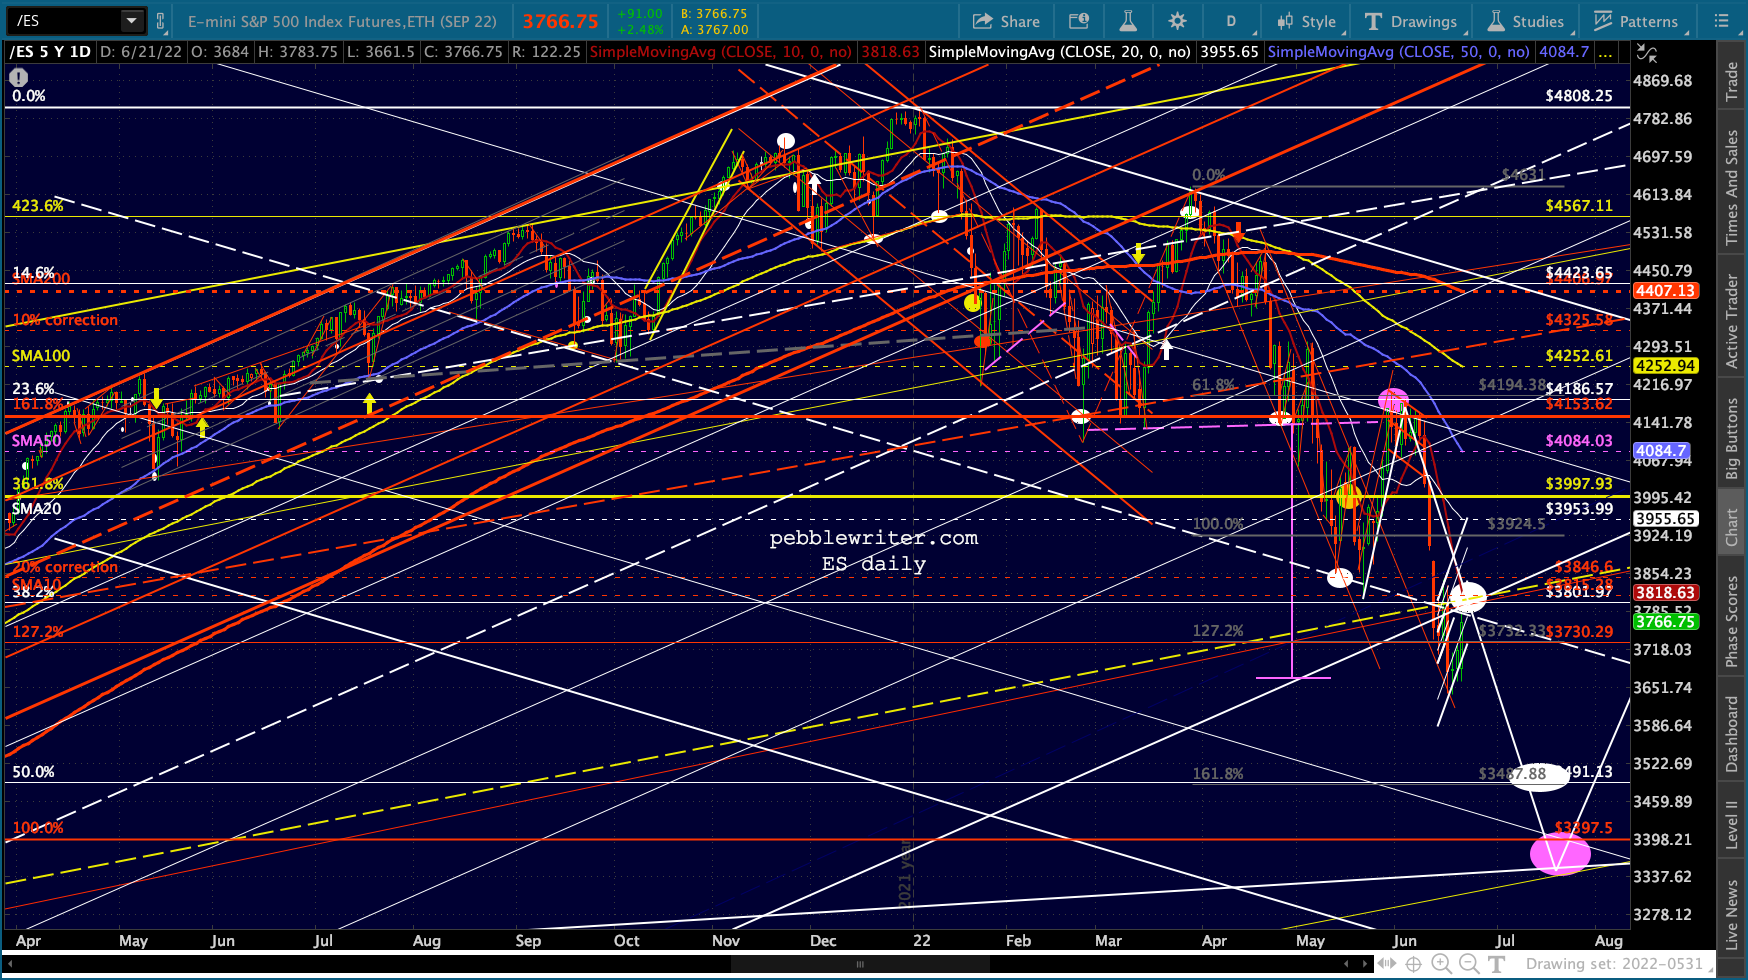
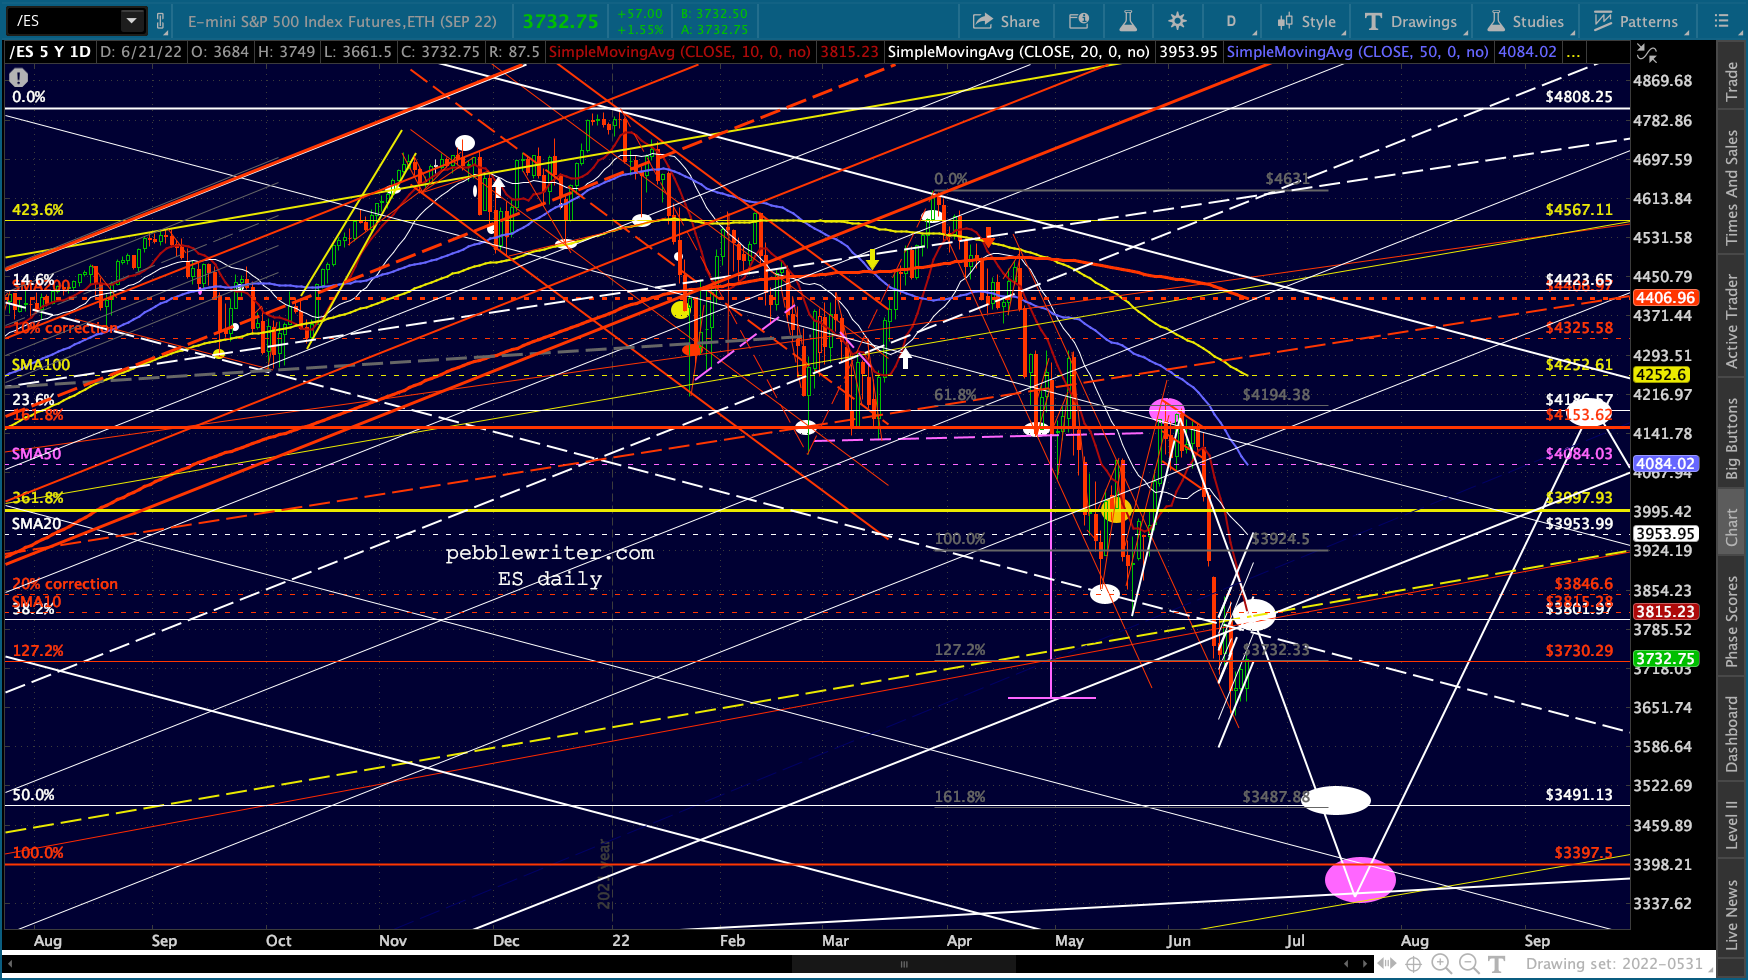
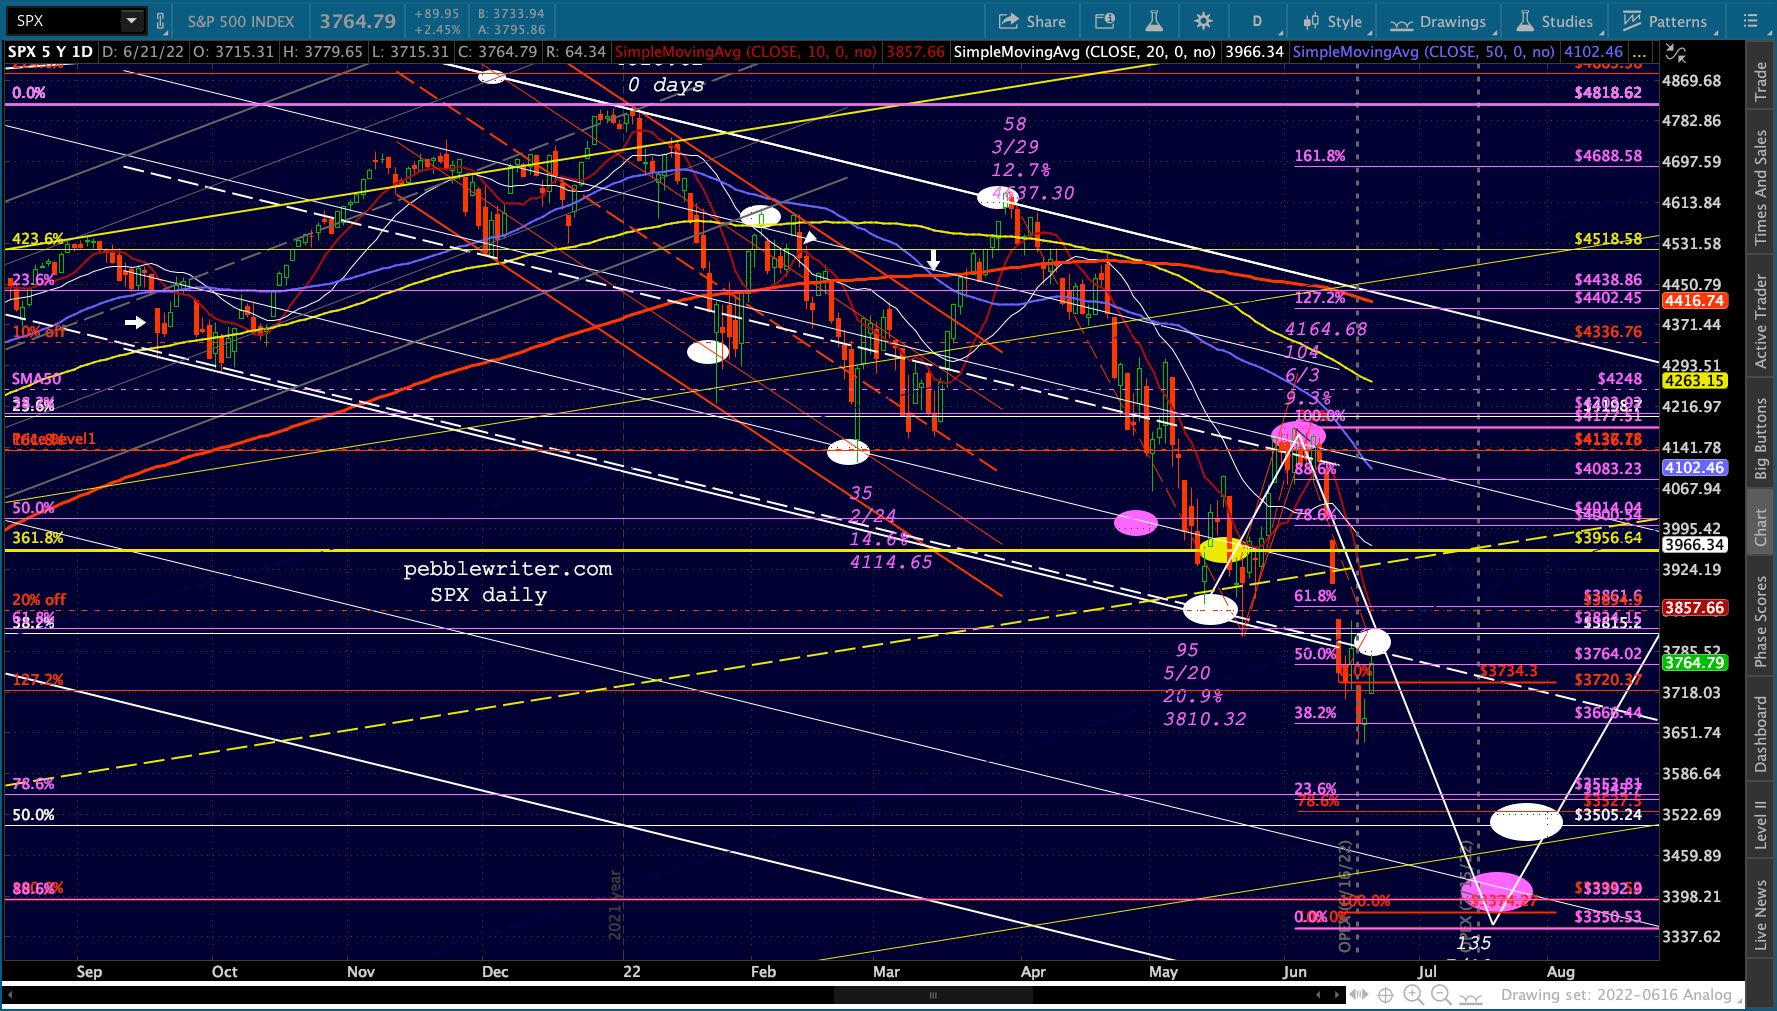 This is much more in keeping with the timing that the analog suggests, as the path SPX was on last week was way ahead of schedule for a July 19 target.
 USDJPY kept going, thanks to the BoJ very reliably putting stock prices ahead of inflation fighting.
 Bottom line, SPX could still bounce higher – perhaps as high as the yellow midline at 3960 at about the same time the SMA50 might arrive. Analogs are pretty precise, and there’s plenty of time to get down to 3350-3500 by July 19.
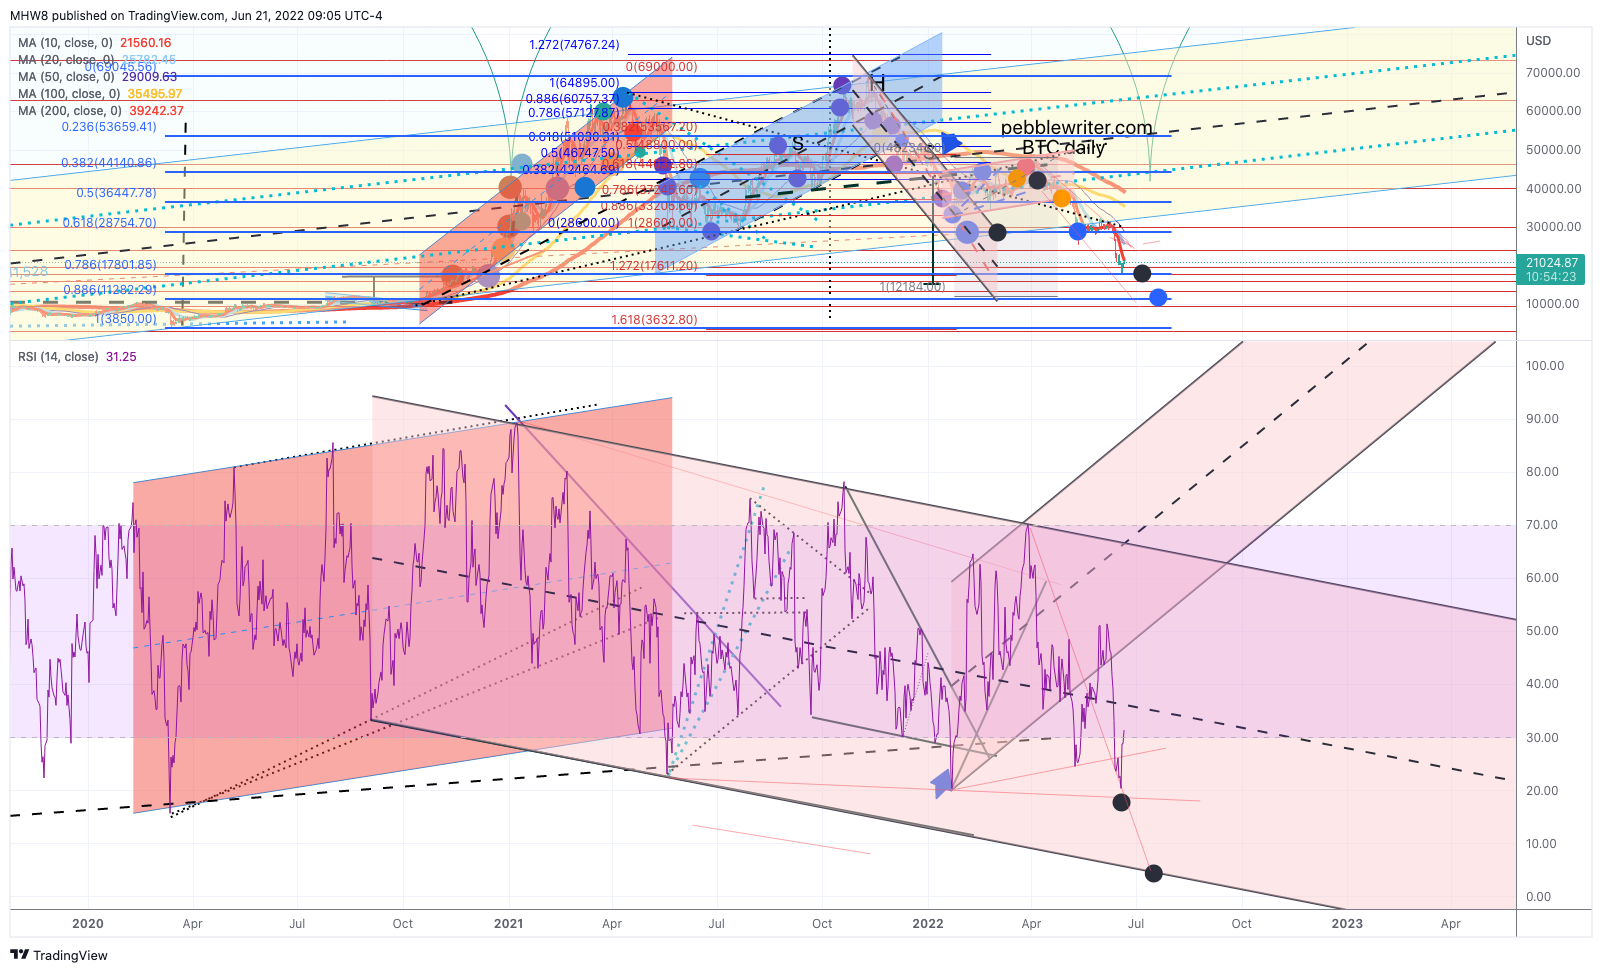
The rest of the charts for BTC show more downside at the .886 at 11,277 – not far from the H&S target at 15,277. The RSI should easily accommodate either.