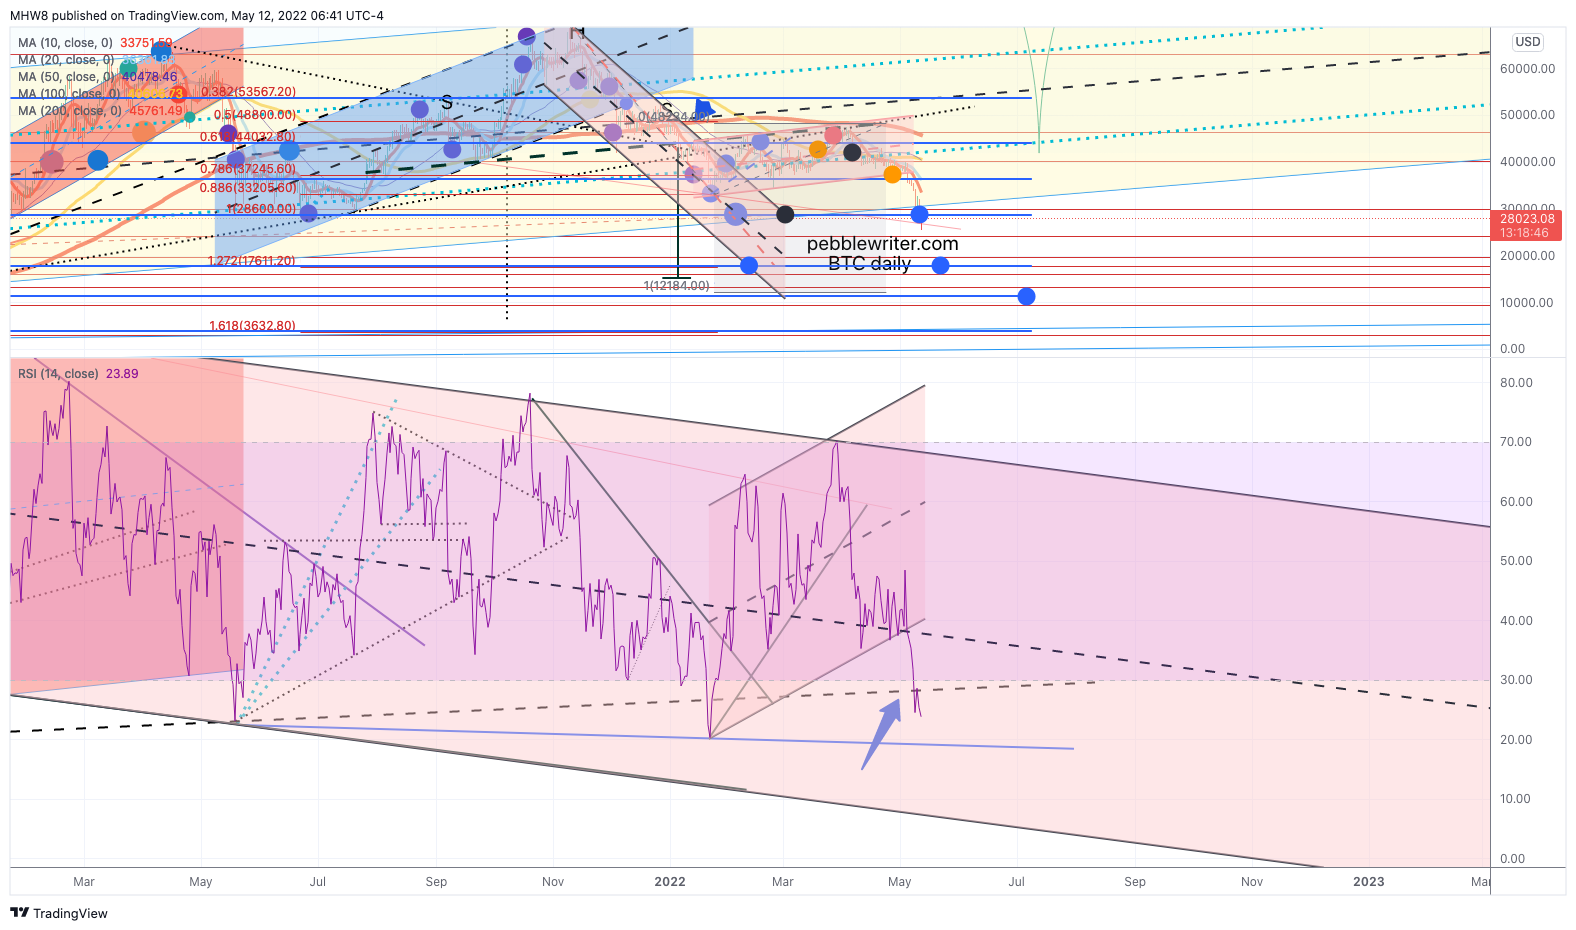
BTC reached our next downside target at 28,600 last night, then dropped as low as 25,401 before bouncing back to current levels.
 It’s not unusual for BTC to overshoot important support. And, this .618 Fib level is theoretically important support. But, it’s also important to remember that a bounce is sometimes just a backtest of newly formed resistance before another leg down.
We’ve been bearish on BTC since 66,432 in October 2021. We were a little early, but maintained our posture ever since with with the exception of the Dec 2021 and Jan 2022 bounces – a stance which has produced exceptional gains.
We’ll take a fresh look at BTC and whether it’s worth trying to catch this falling knife.
continued for members…Note that a prior mislabeling of the blue Fib Pattern top identified 28,600 as the .618. It is actually 28,737.30. The drop through the yellow channel bottom may be new and, therefore subject to placement error.
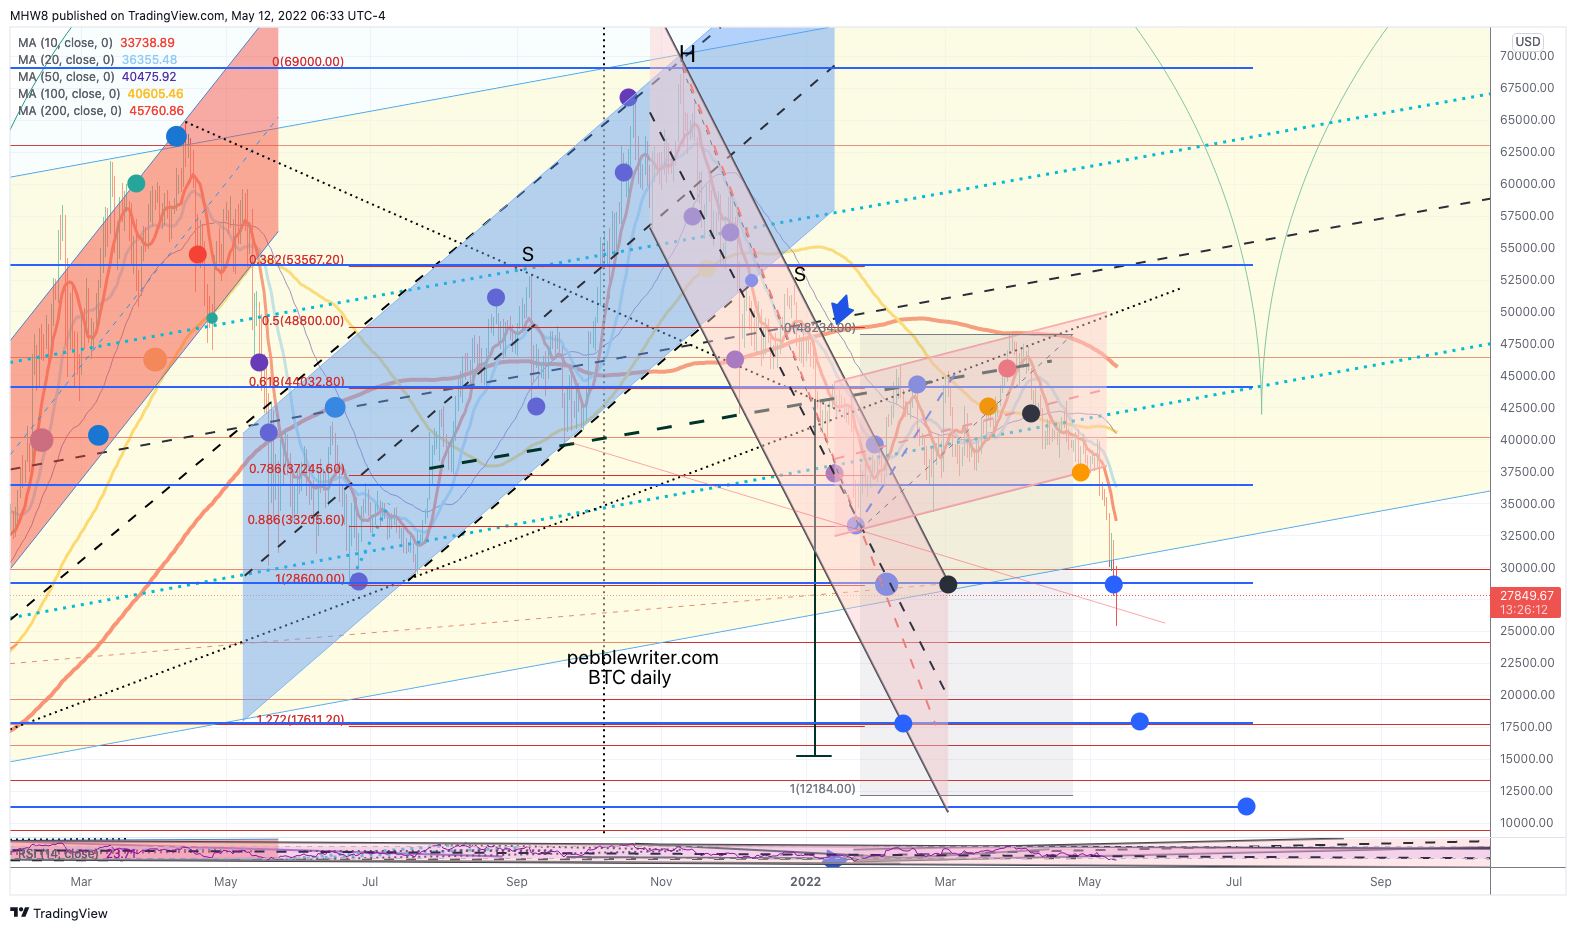 But, it shouldn’t be ignored. Neither should the drop through the May 2021 low. In the absence of a sharp reversal at or slightly above the .618, this is no longer a potential Gartley Pattern, but a potential Bat Pattern instead.
The upshot is that the .886 is more likely to come to fruition. While we might get a rebound at 17,792 (the “bad “case,” 11,277 is our new “ugly case” target. Note that we’re getting perilously close to the 2017 highs at 19,666.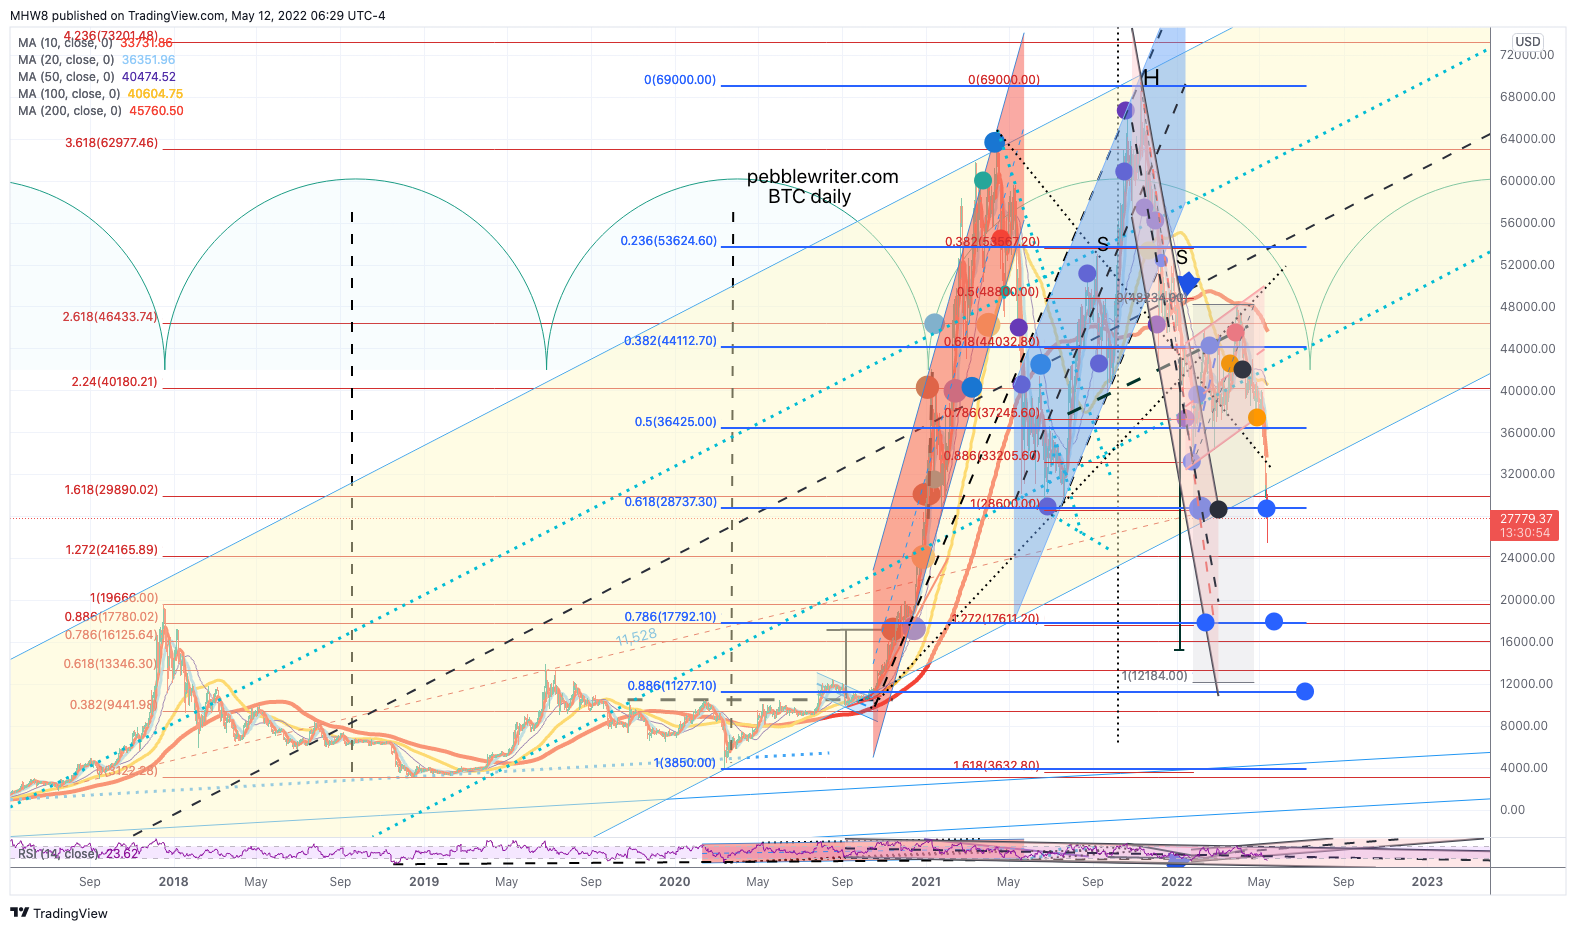 Could be a head fake, but even the RSI chart concurs. The breakdown below the dashed black line which produced such a hellish downturn several months ago…
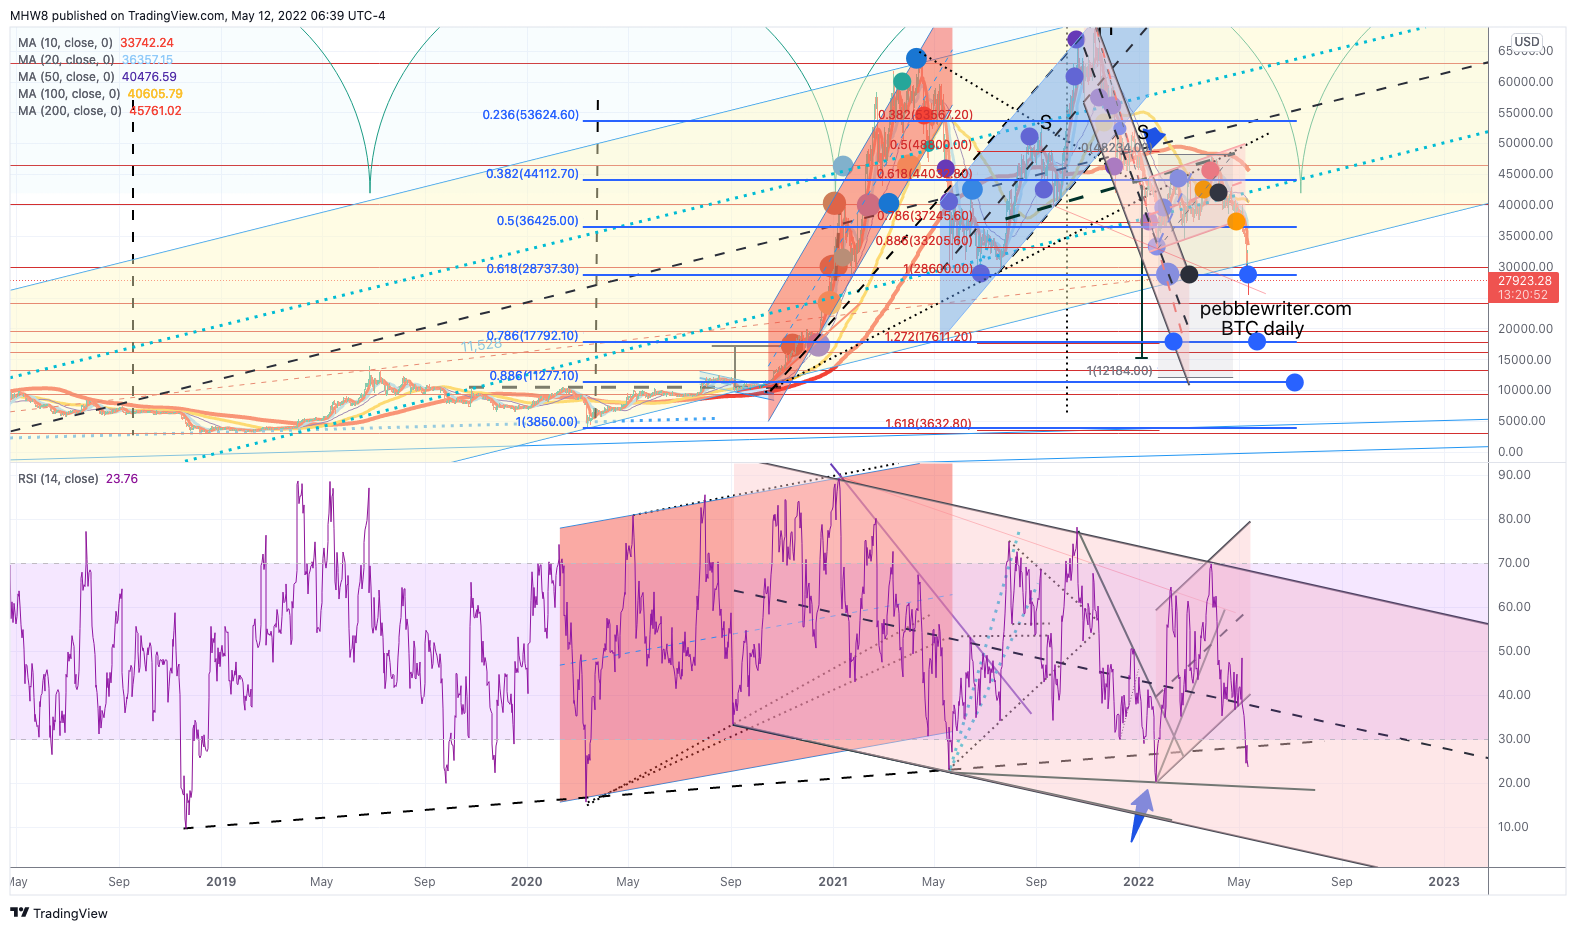 …has occurred again, and even backtested. We’ll look for support at the blue TL, but if it fails then we won’t see support come in until the falling channel bottom – probably at 17,792 or 11,277.