

The market has frustrated both bulls and bears lately, vacillating between sharp downturns and even sharper recoveries. But, a close examination of the charts shows two very obvious patterns that suggest the tide is about to turn – not in a good way.
 continued for members…
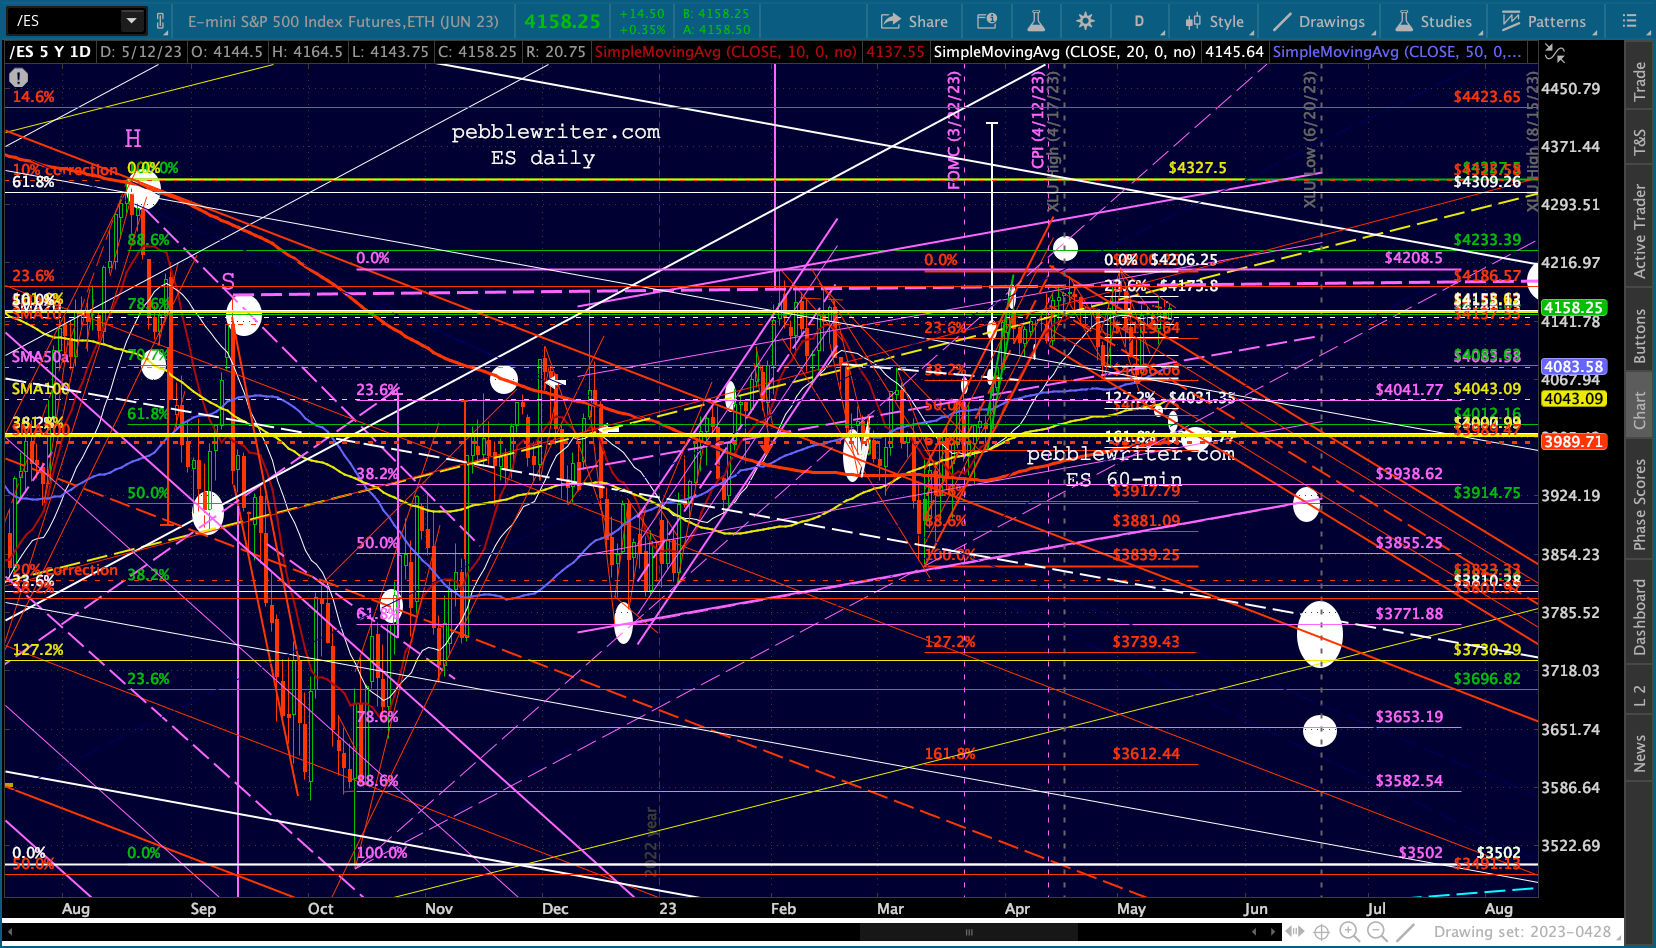
Note that we have a very well-formed triangle pattern with an apex of 5/16ish and last night’s highs at the .786 (time) Fib level. Monday would align with the .886.
 Remember, we have very well-defined overhead resistance at both 4166 and 4188.
 The falling red channel has fizzled on the pushes higher, but we often find that such channel lower bounds are still a good guide to bottoms.
 The SPX shows similar patterns, with the obvious differences being that the falling white channel is still working (bearish) and the SMA10 slipped slightly above the SMA20 yesterday (technically bullish.)


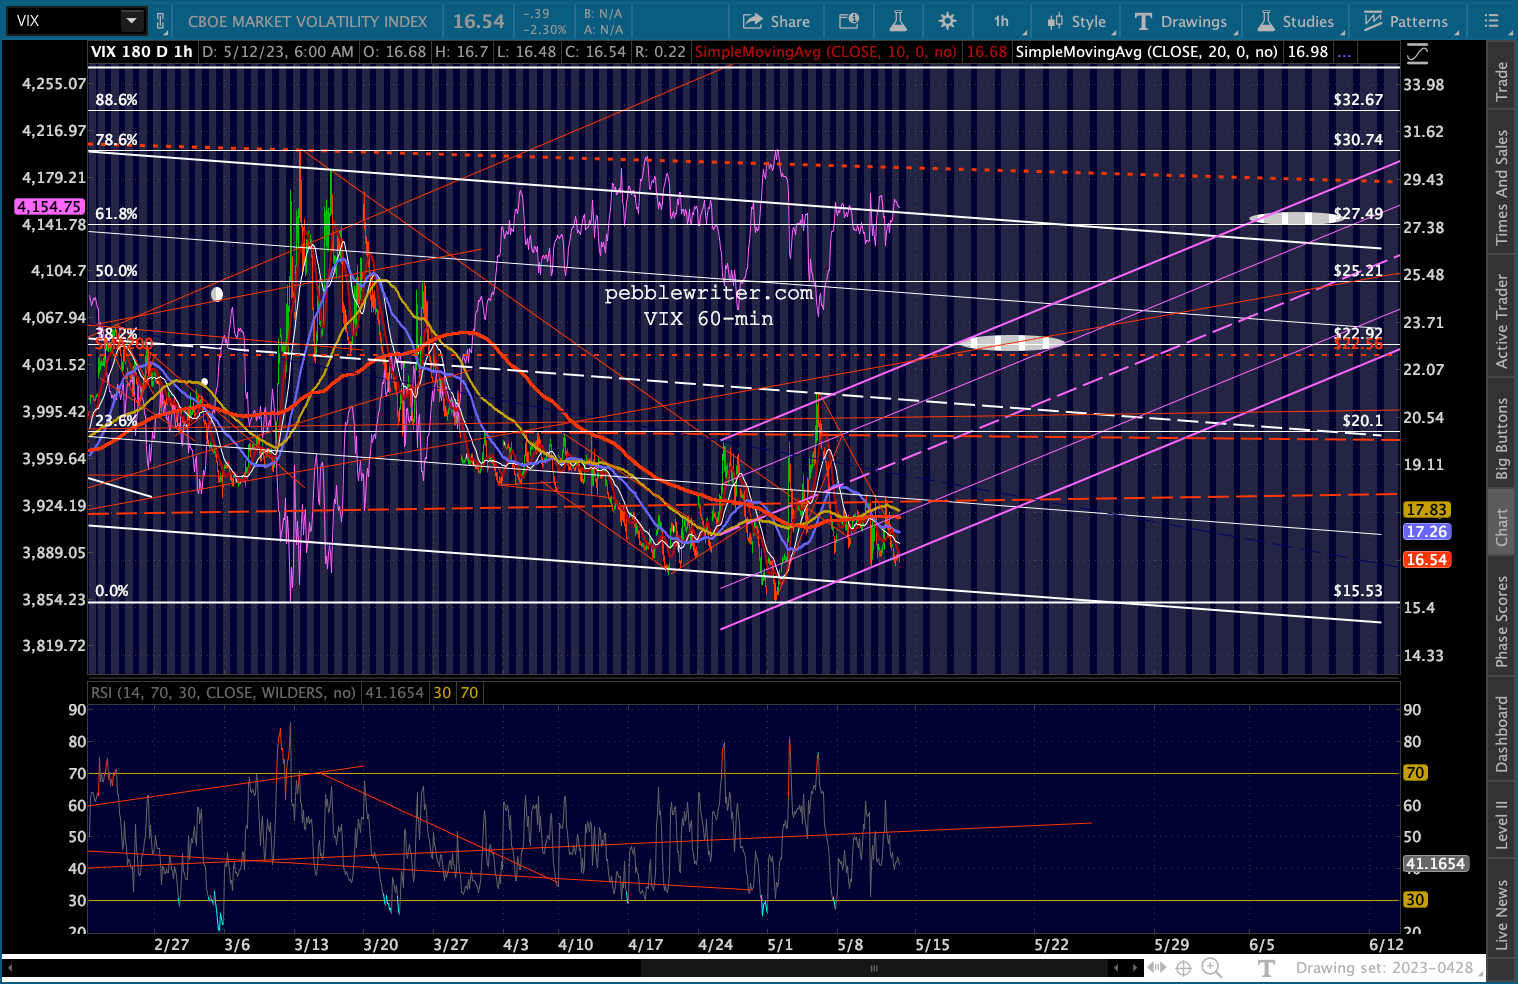
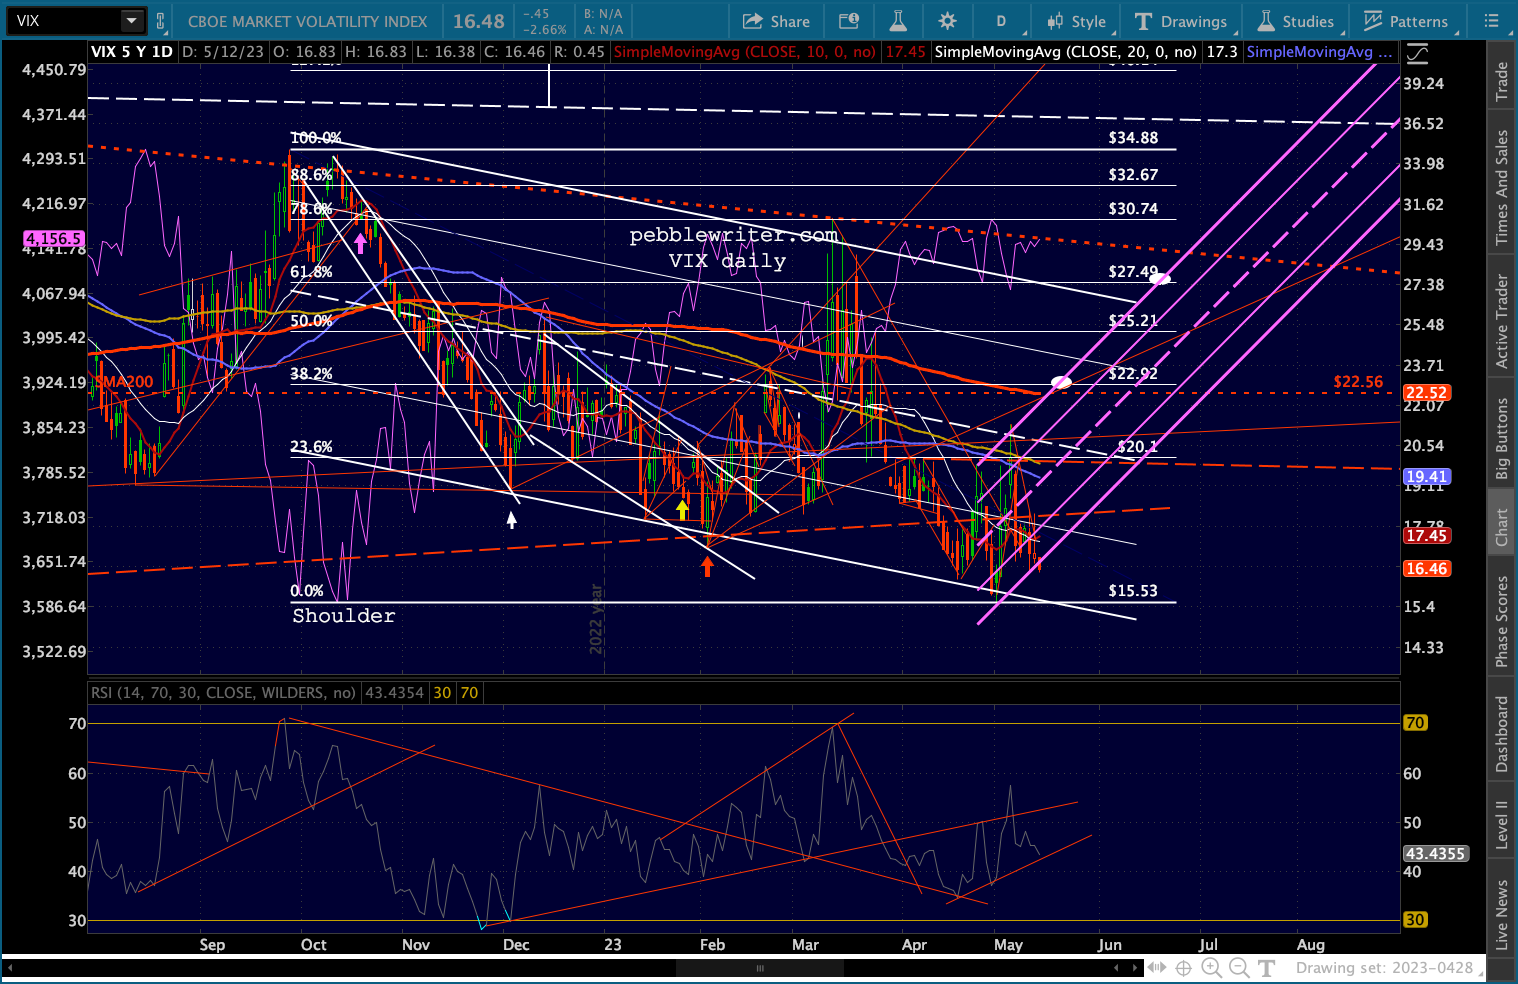
 If our thesis is correct, this should mark another bottom for VIX.
 Currencies are still mostly on the sidelines. EURUSD’s decline (bearish) has been offset by USDJPY’s rise (bullish.) The final arbiter is DXY, which is rallying as expected.

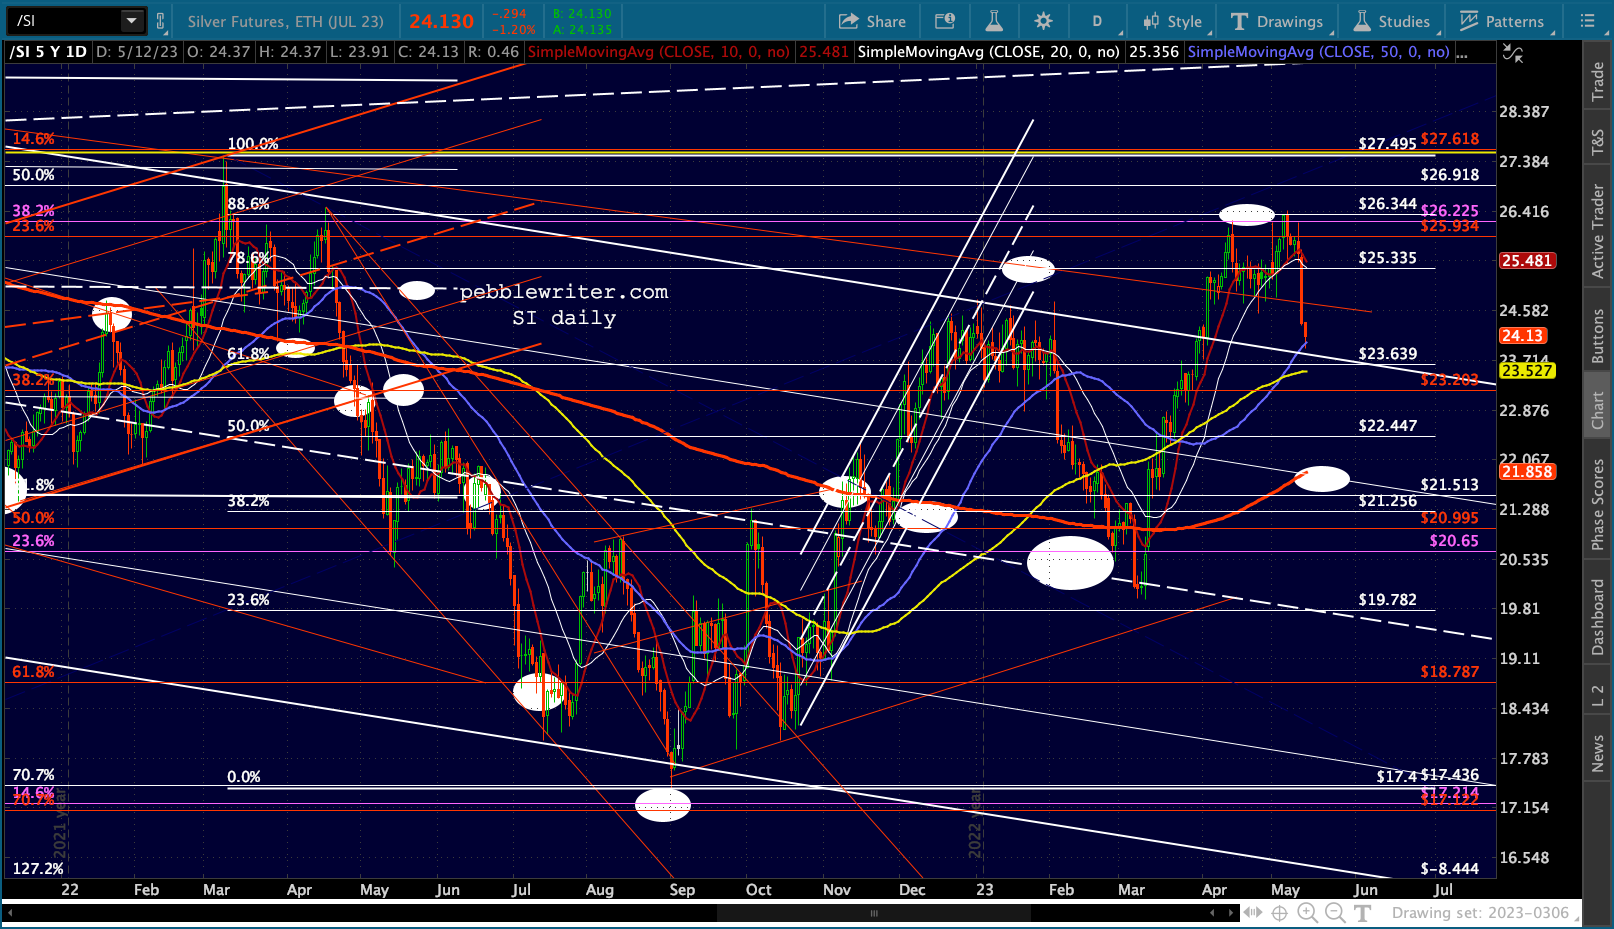
 GC and SI are therefore falling…
 …as is BTC. Note, however, that BTC’s RSI is nearing important support as it
  CL and RB are up marginally, but still face pretty substantial overhead resistance.

 I’m still of the view that TNX should revisit the yellow TL at 32.16 with a good possibility that it could break down at that point.
 Bond yields are still hanging in there, with the danger to stocks being that the 2Y falls faster than the 10Y and the 2s10s rises above the resistance at -38 bps.
 I think this is a reasonable expectation. If equities sell off as expected, much more money will flow into the 2Y than the 10Y.
GLTA…