

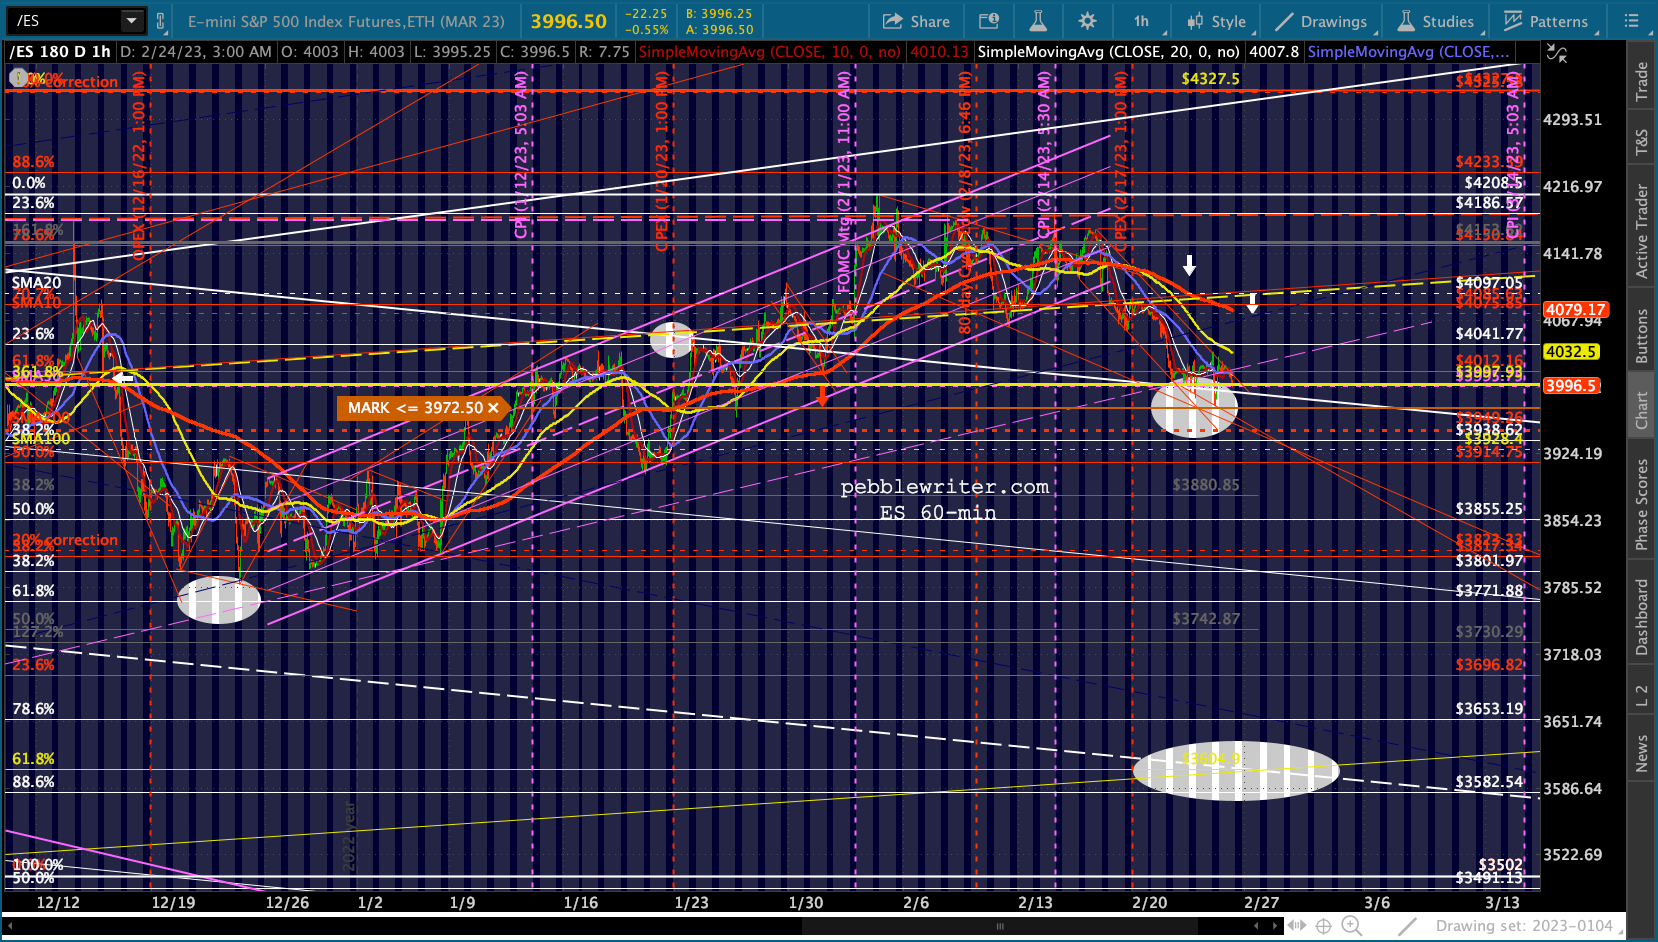
Futures have dropped back through the 50-day moving average, putting the 200-day back in focus after yesterday’s near miss.
 We’re essentially in the same situation as yesterday except that we’re jumping off from a much lower level.
continued for members…
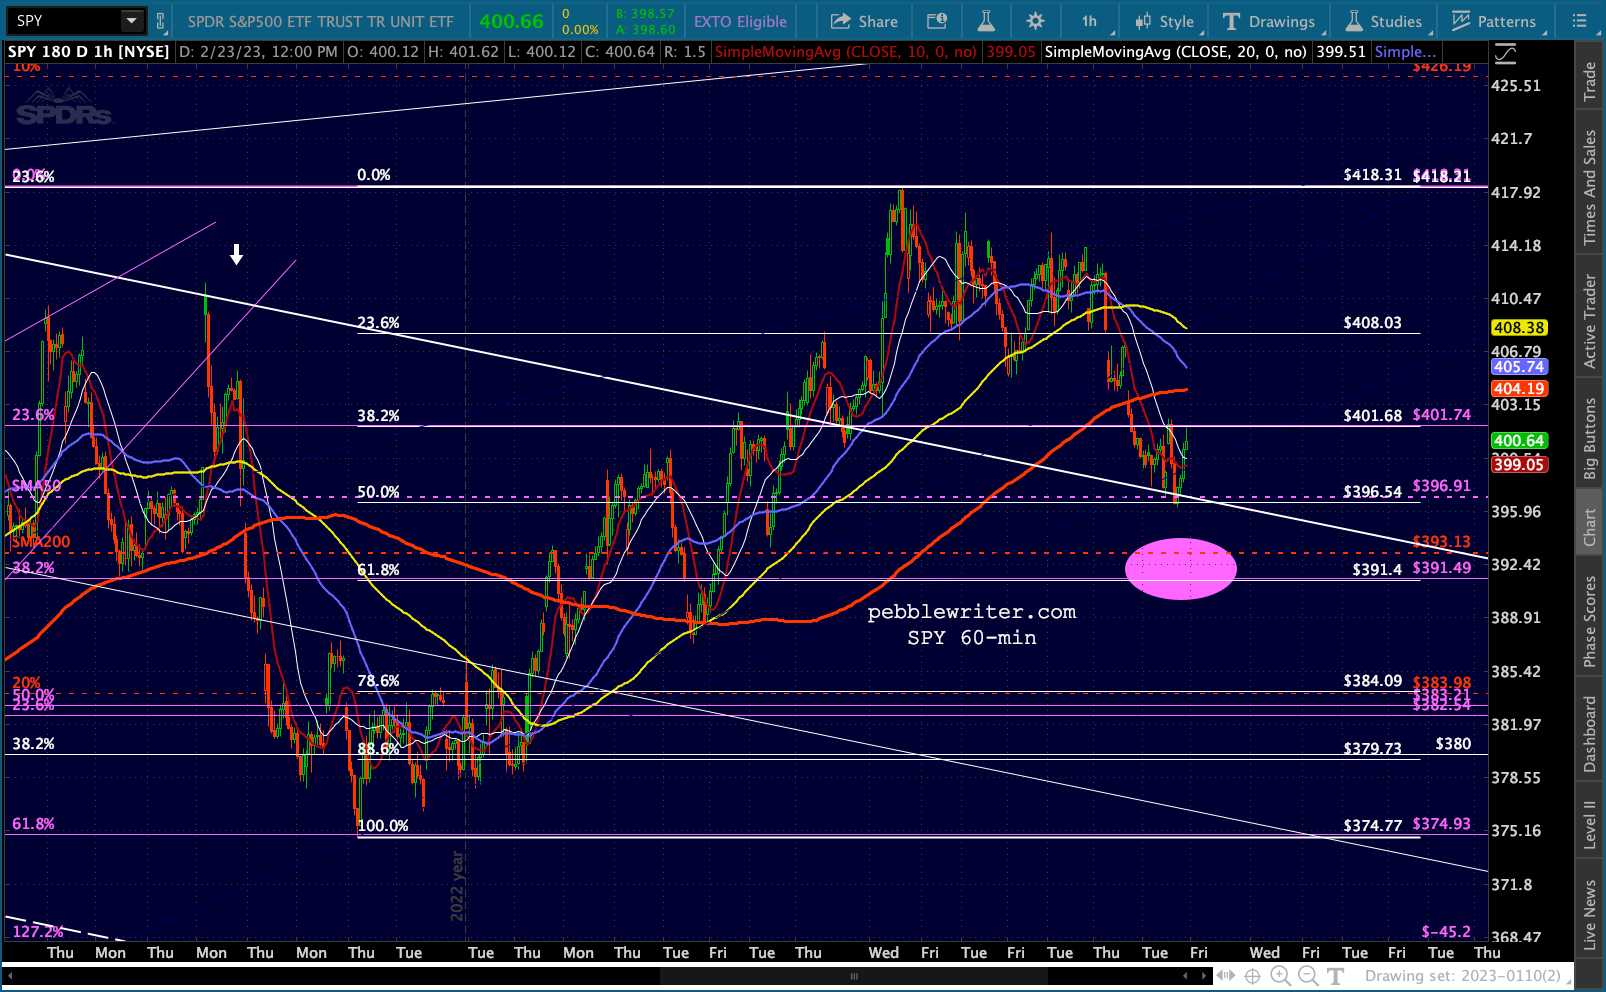
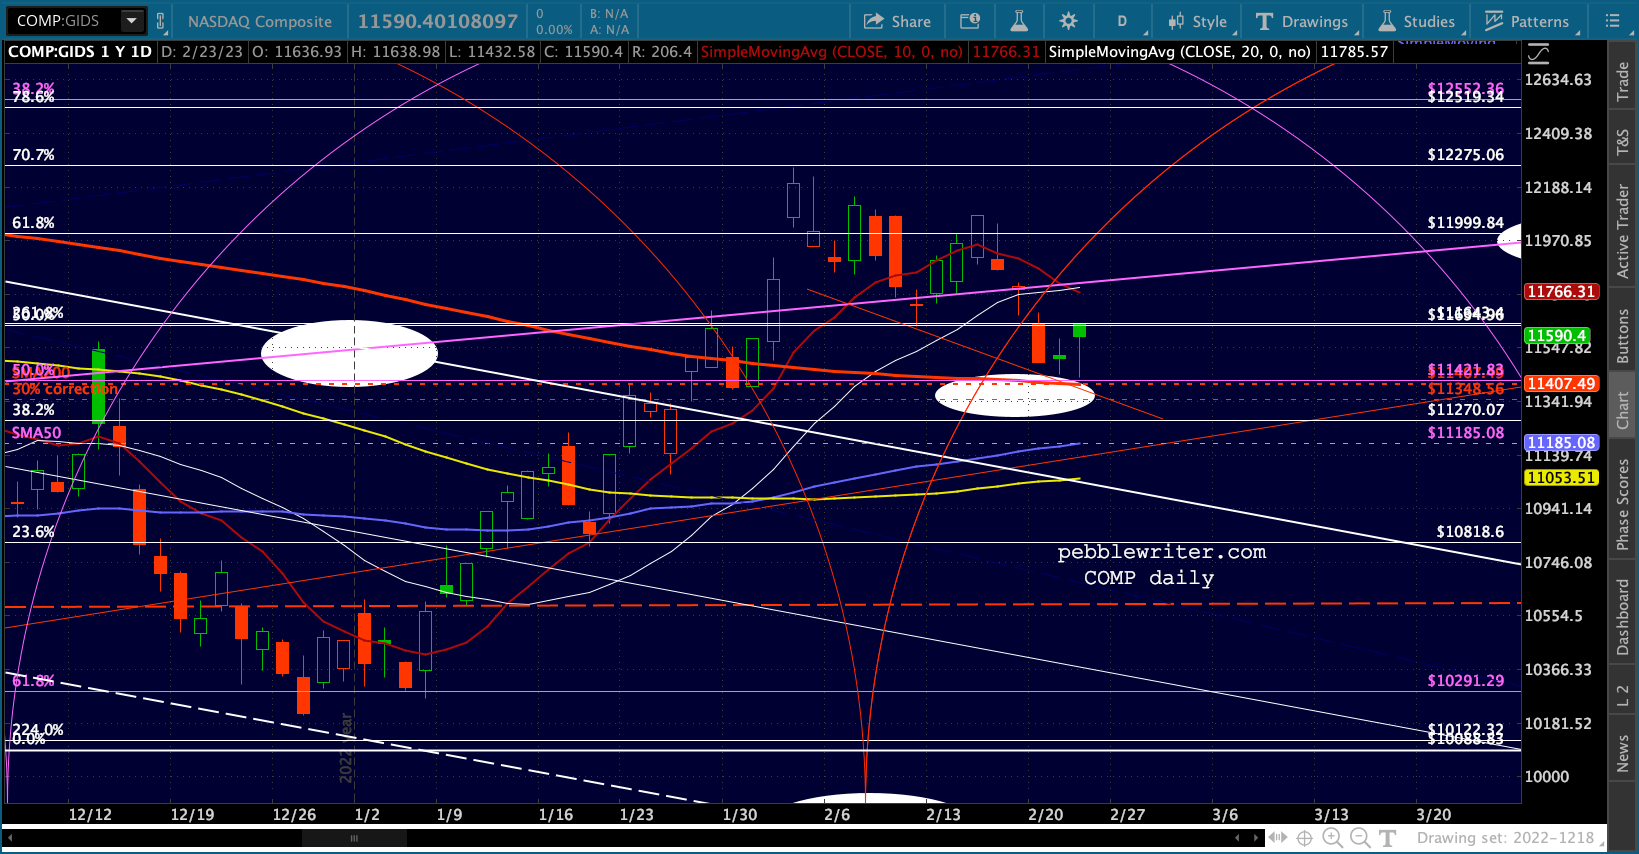
The only question remains whether or not TPTB will try to protect the backtest/SMA200 lows. Recall that we broke out on mostly short covering and algo baiting – dashing the super precise falling channels in most indices. Now we’re back to those channels and generally within1% of those SMA200s.


 Currencies appear ready to accommodate some downside – but the extent is not clear. EURUSD could easily slip down to 1.033, while USDJPY appears likely to target its SMA200 at 137 – both contributing to DXY strength which is pushing up against a channel midline. Past DXY rallies have been good for bears.


 CL continues to not break out, while RB has its eye on its SMA200 at 2.8383, which would normally correlate with a rise in the 10Y.


 Note the TNX breakout is holding.
  We haven’t looked at this chart in a while, but energy stocks continue to defy the drop in crude prices.
 Another favorite is the XLU chart, showing a very well performing cycle which is strongly negatively correlated with 10Y yields. Again, it suggests at least a mild selloff in XLU and rise in TNX.
  The correlation with SPX should also be noted. It is consistent with the SMA200 backtest scenario as well as a potentially larger drop.
 The 2Y is close to breaking out to new highs, putting 2s10s on track to widen.

 More later…