

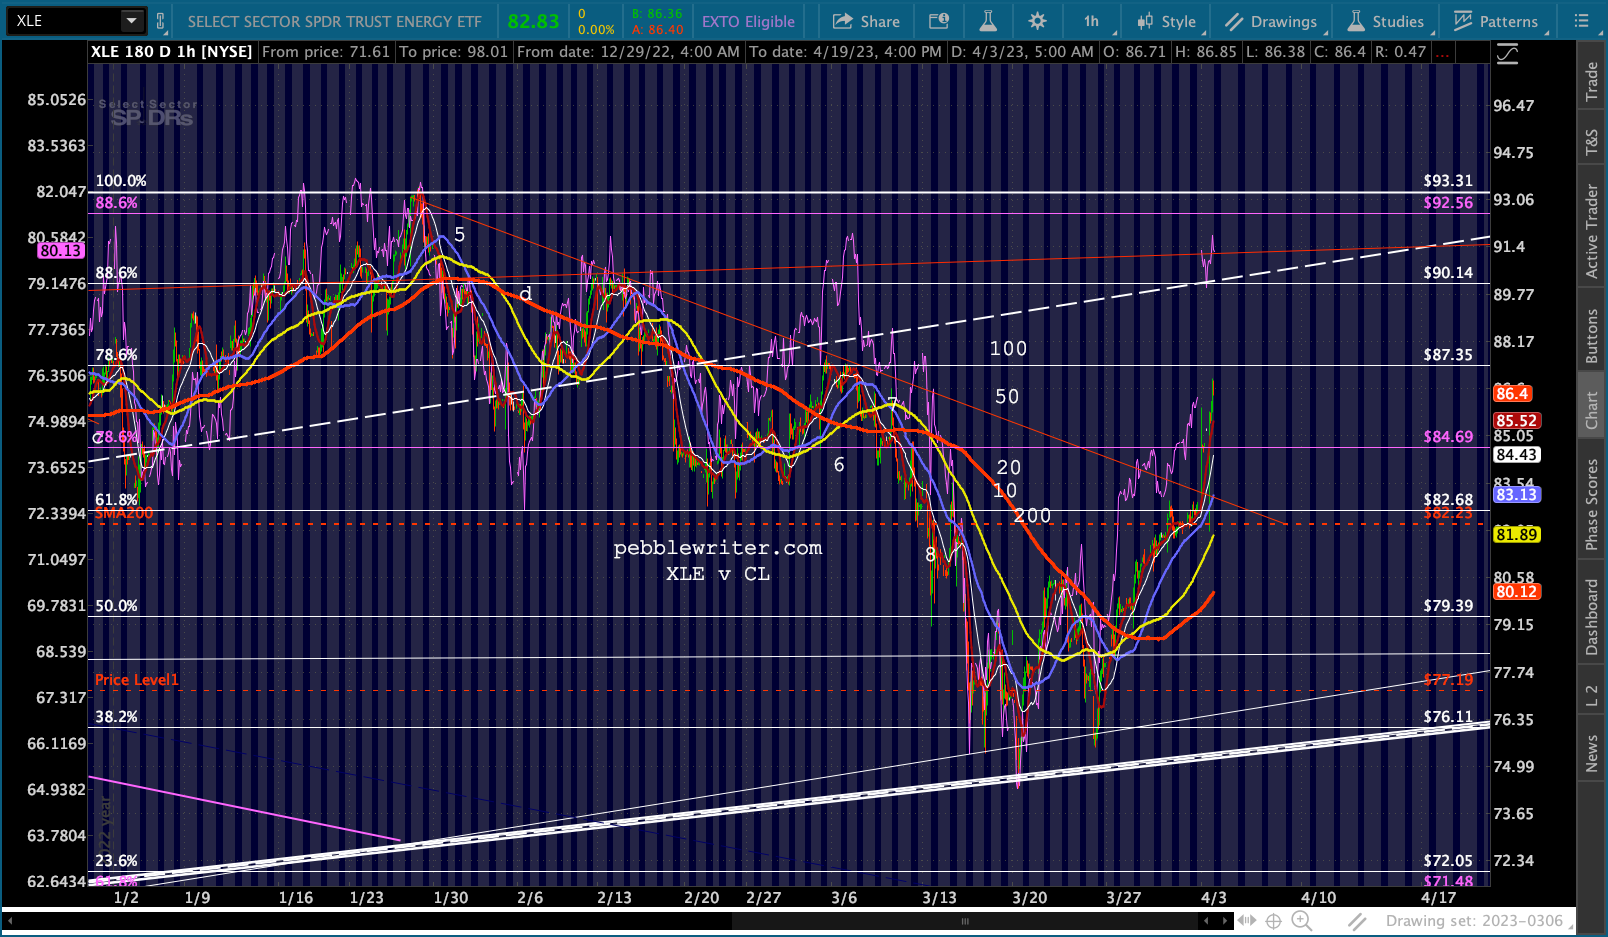
It was touch and go on Friday as XLE pushed above its 200-day moving average and WTI smacked into its 50-day. Fortunately for oil bulls and inflation enthusiasts, OPEC+ was watching the same charts and took action.
 continued for members…
So far, the impact on interest rates has been modest. 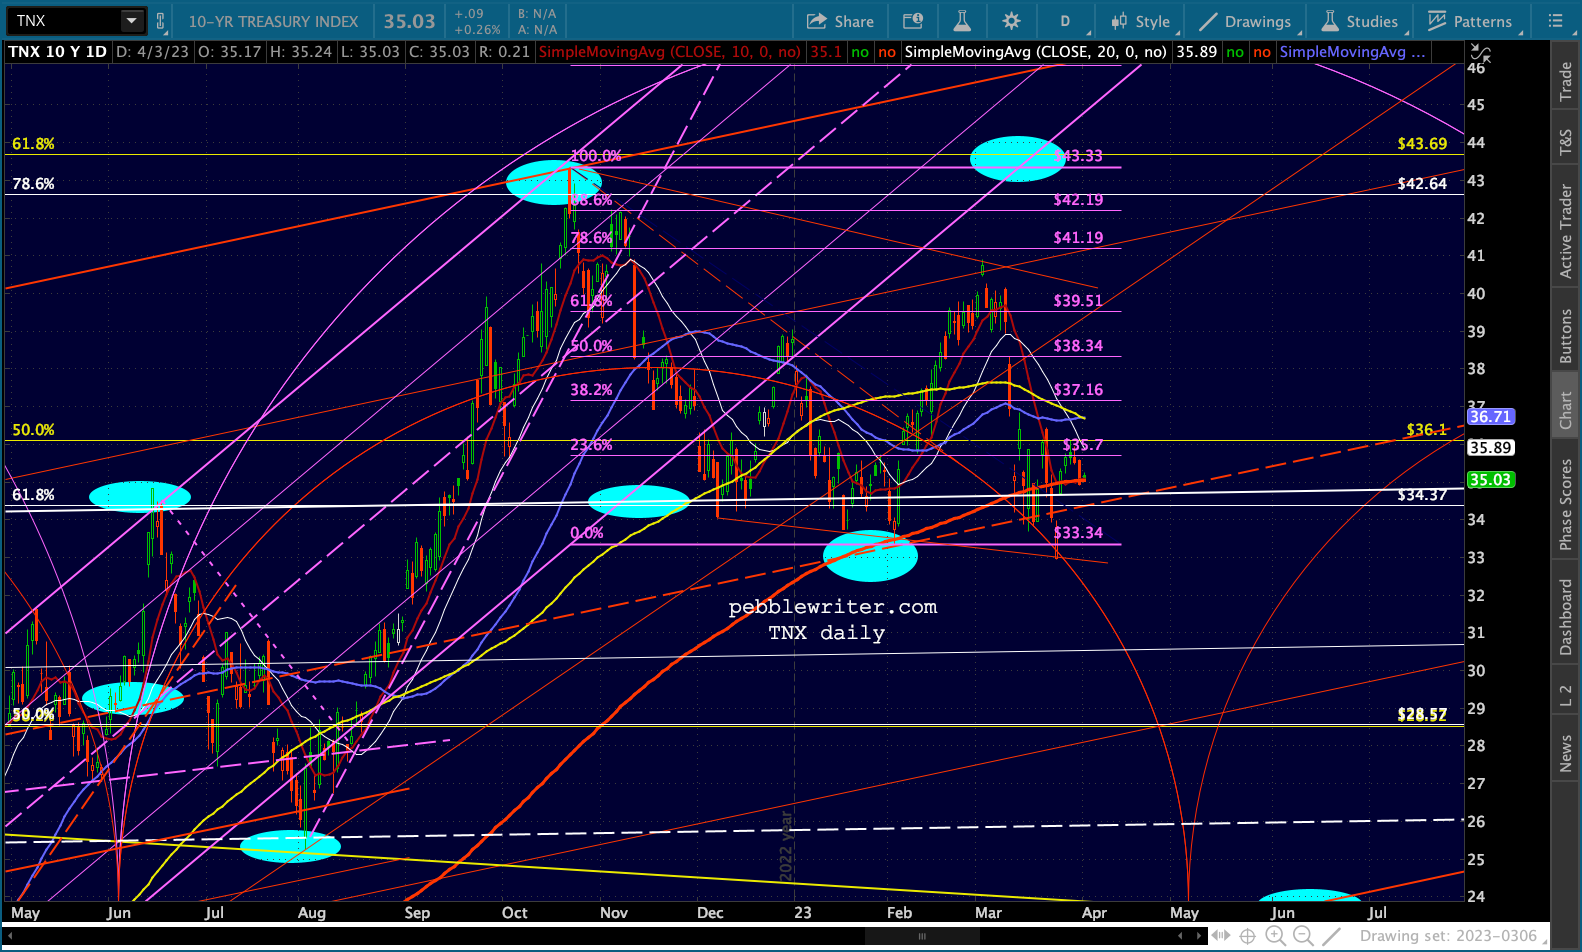 But, XLE is pointing toward a 4%+ gain on the open. More importantly, it has broken above TL resistance and potentially secured its recovery back above the SMA200.
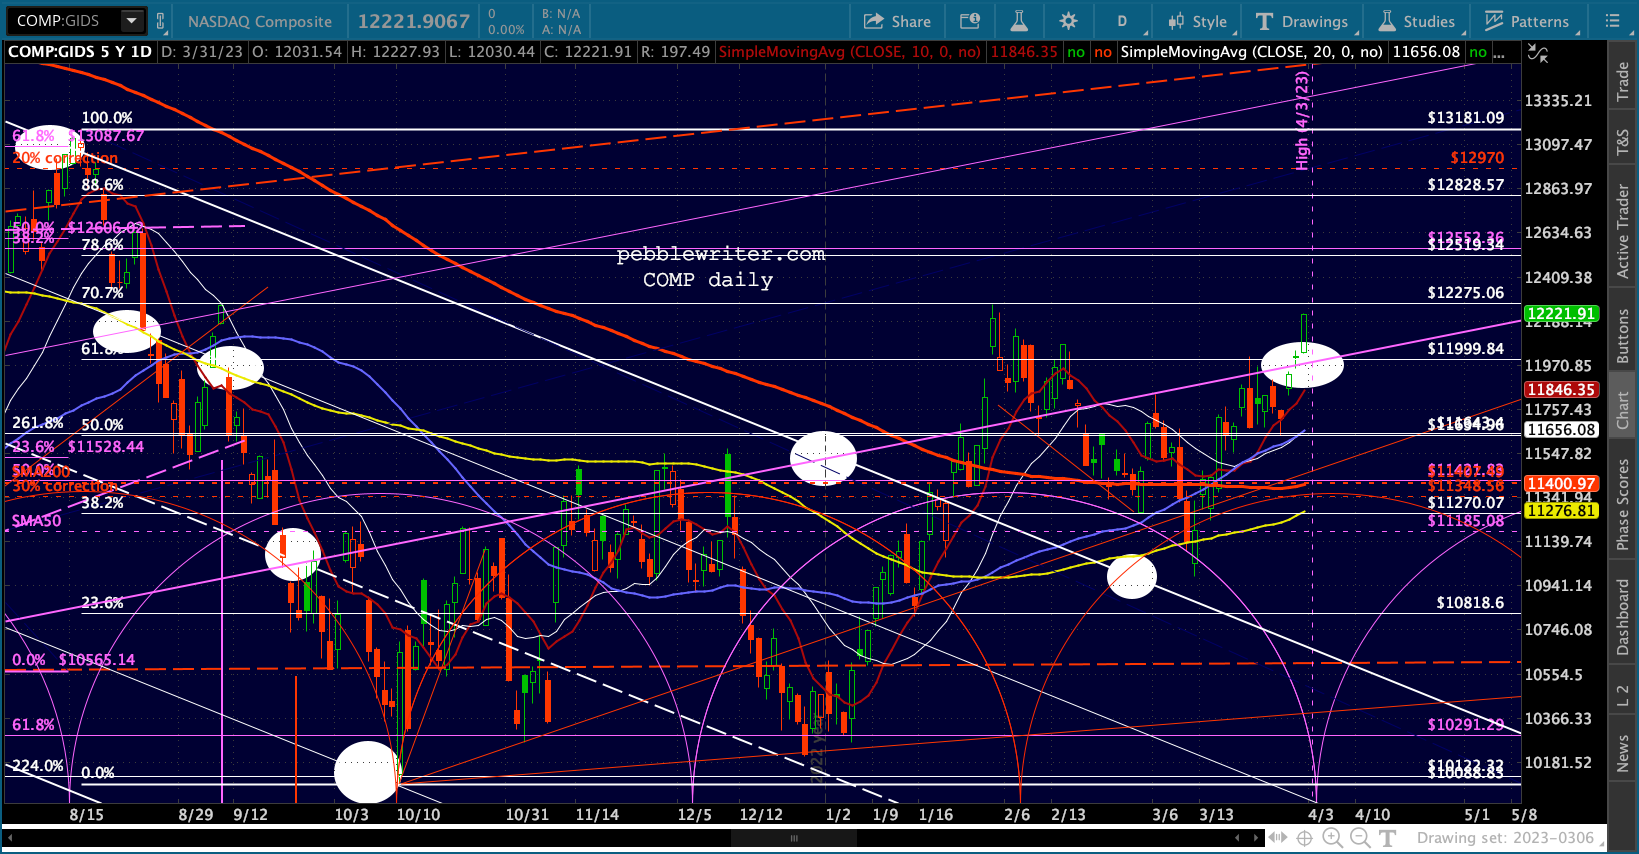
 There are just enough beneficiaries in the oil and gas sector that the overall impact on stocks is enough to prevent a inflation-driven selloff. Remember, there are some very mixed messages in equities due to the IH&S patterns playing out.
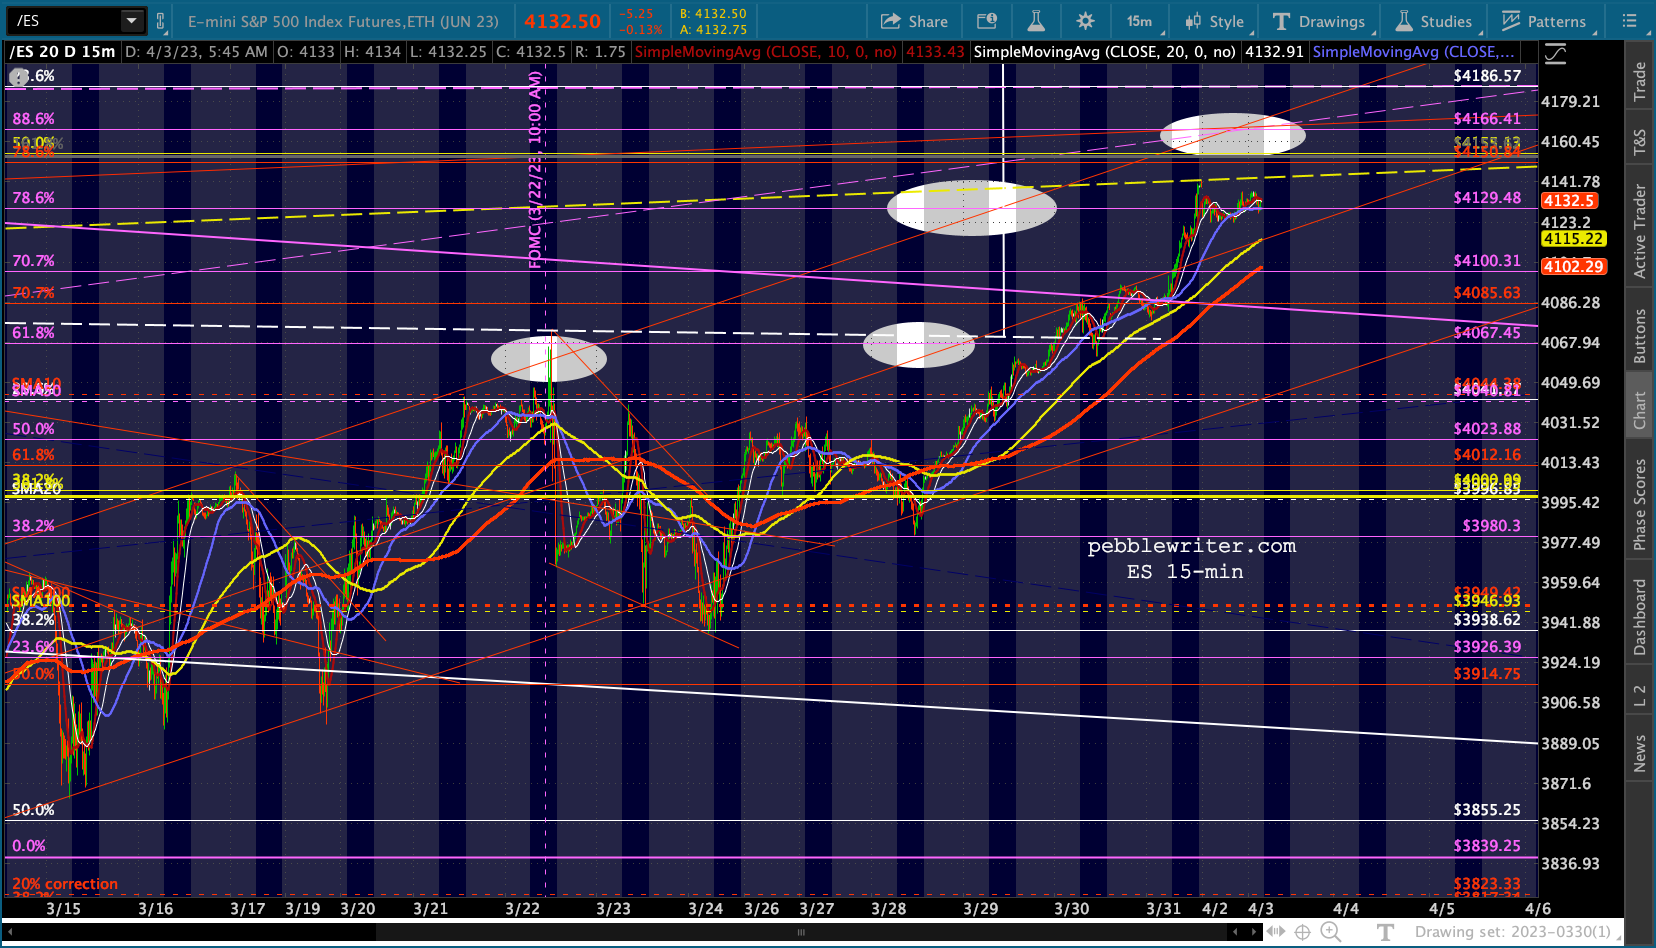
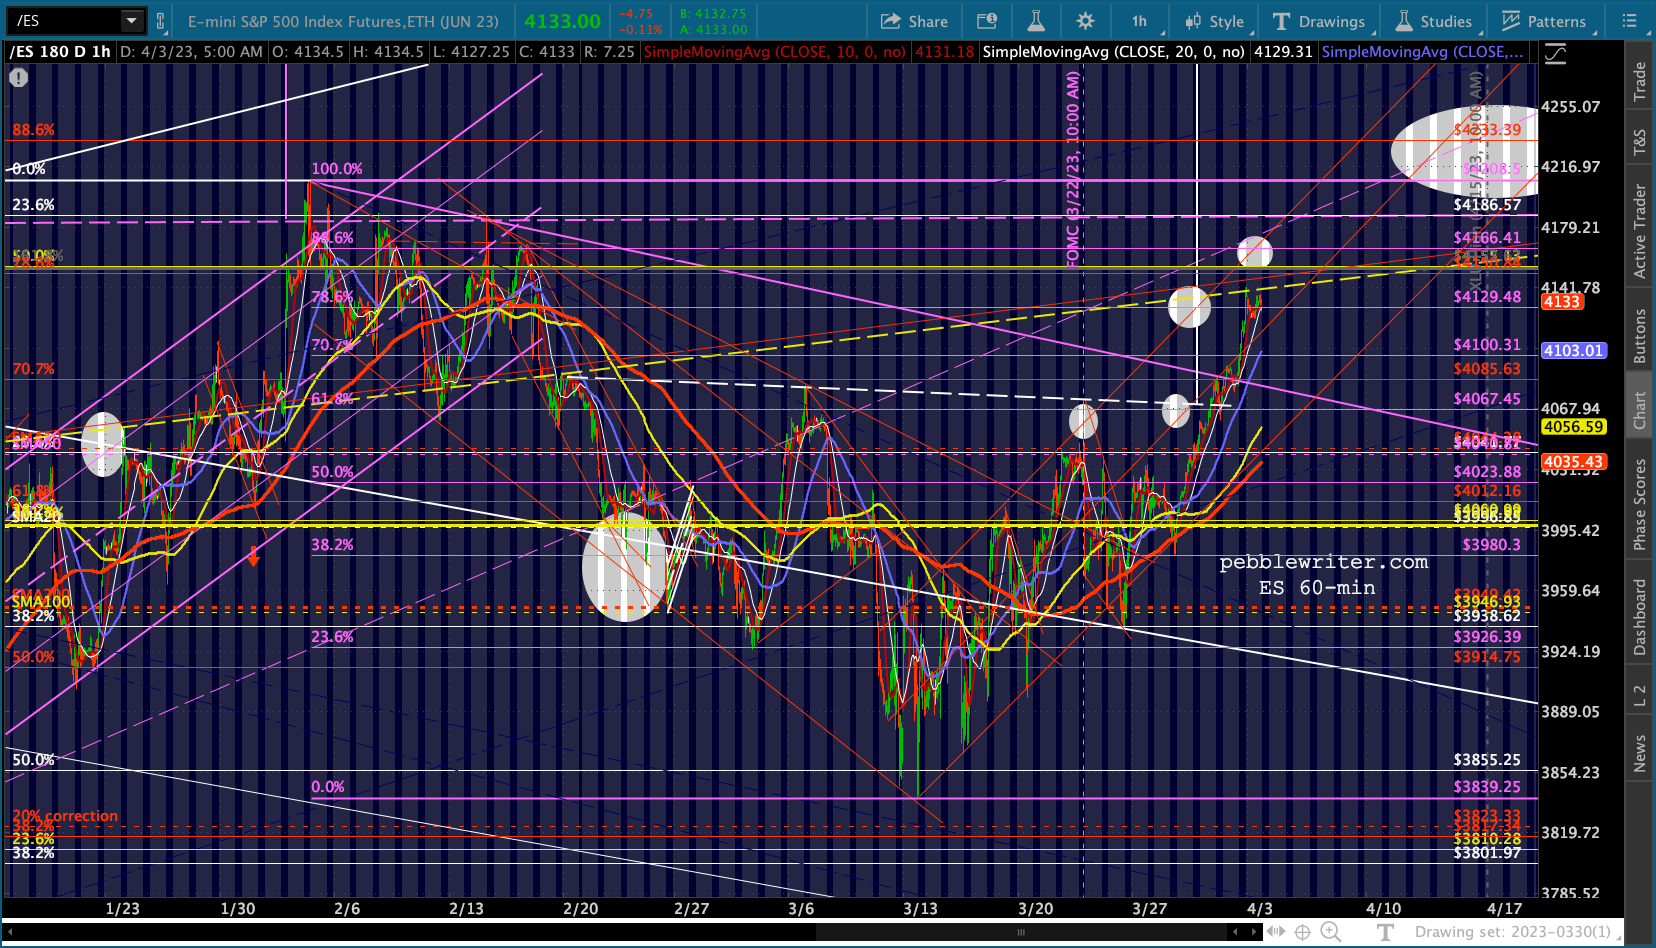
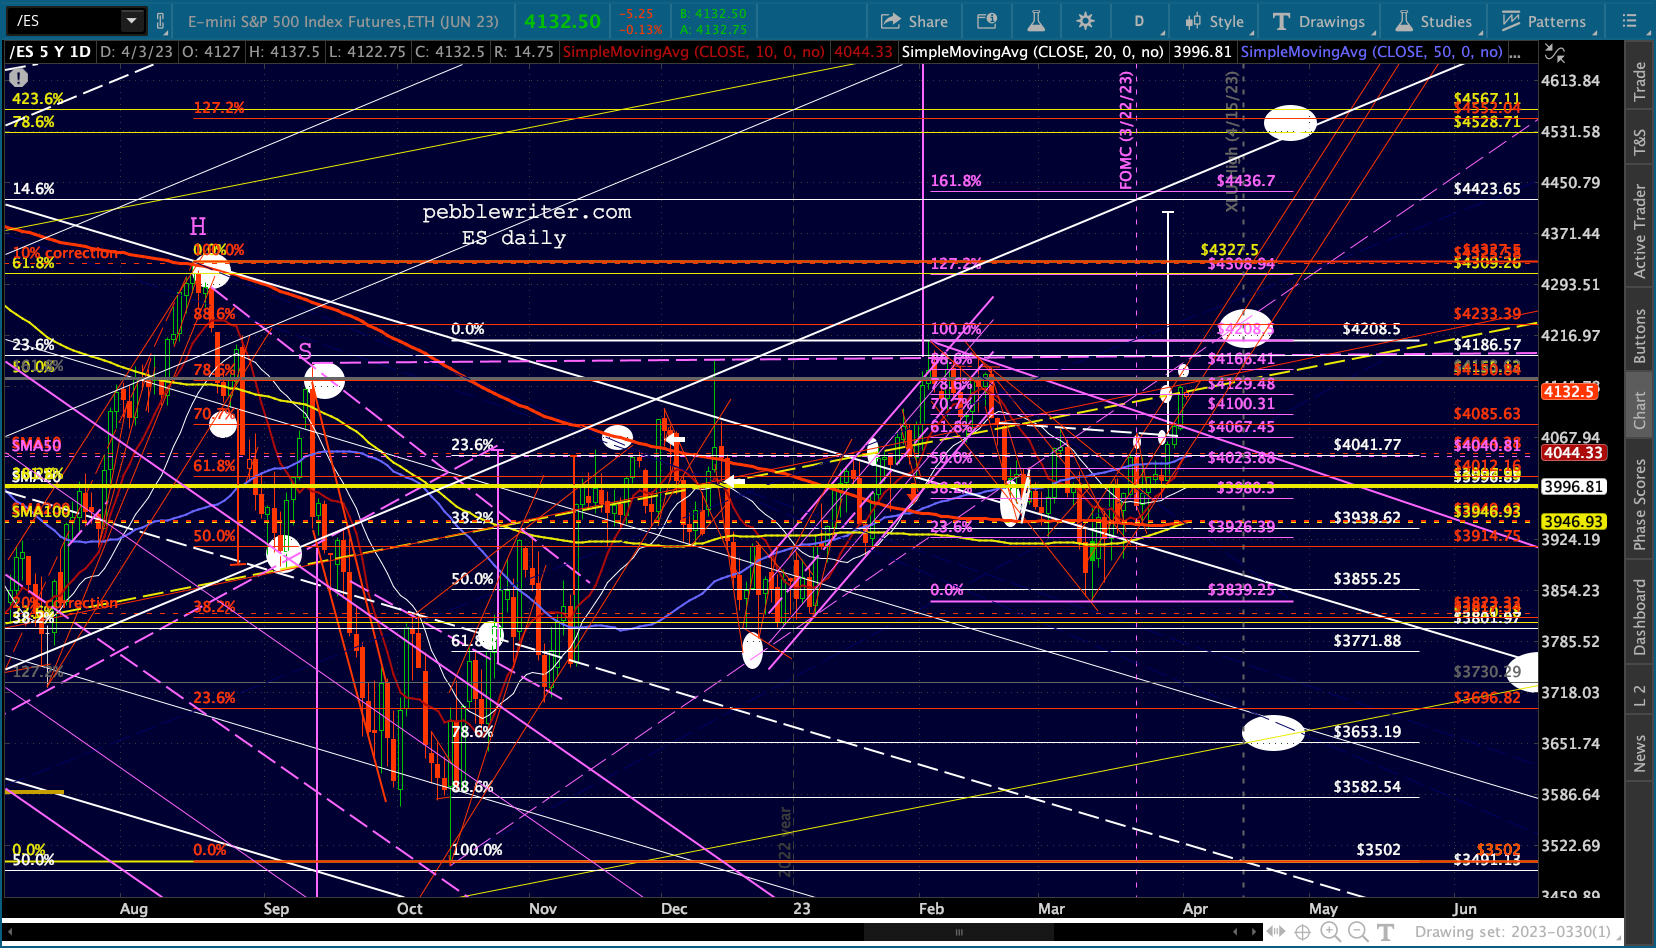
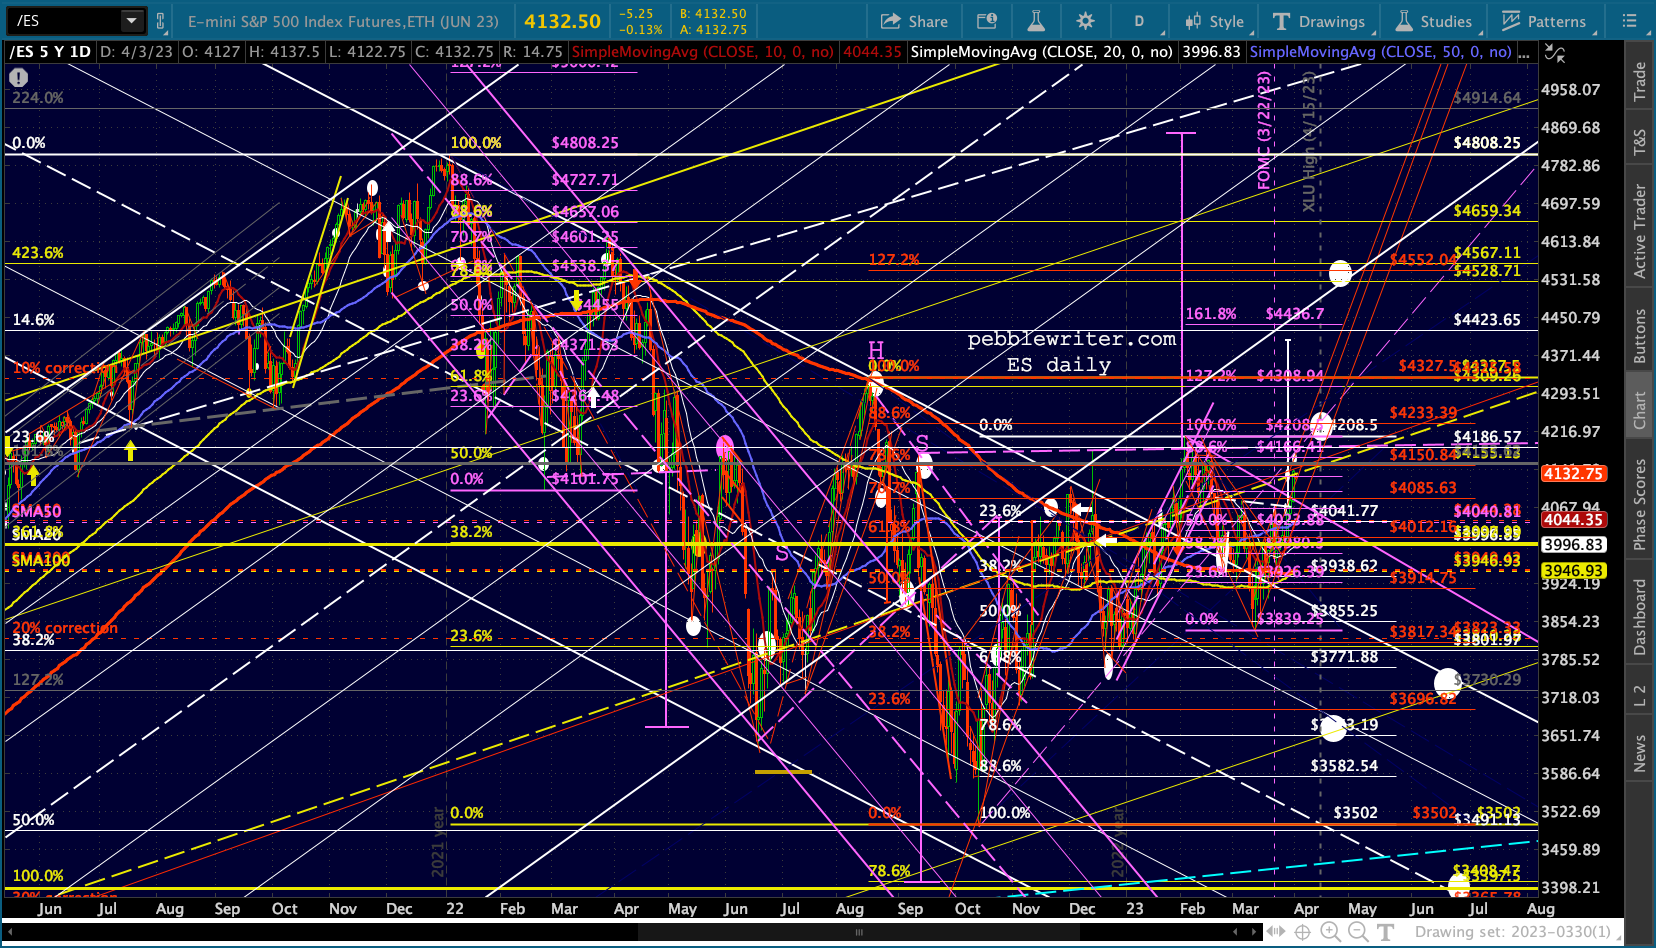
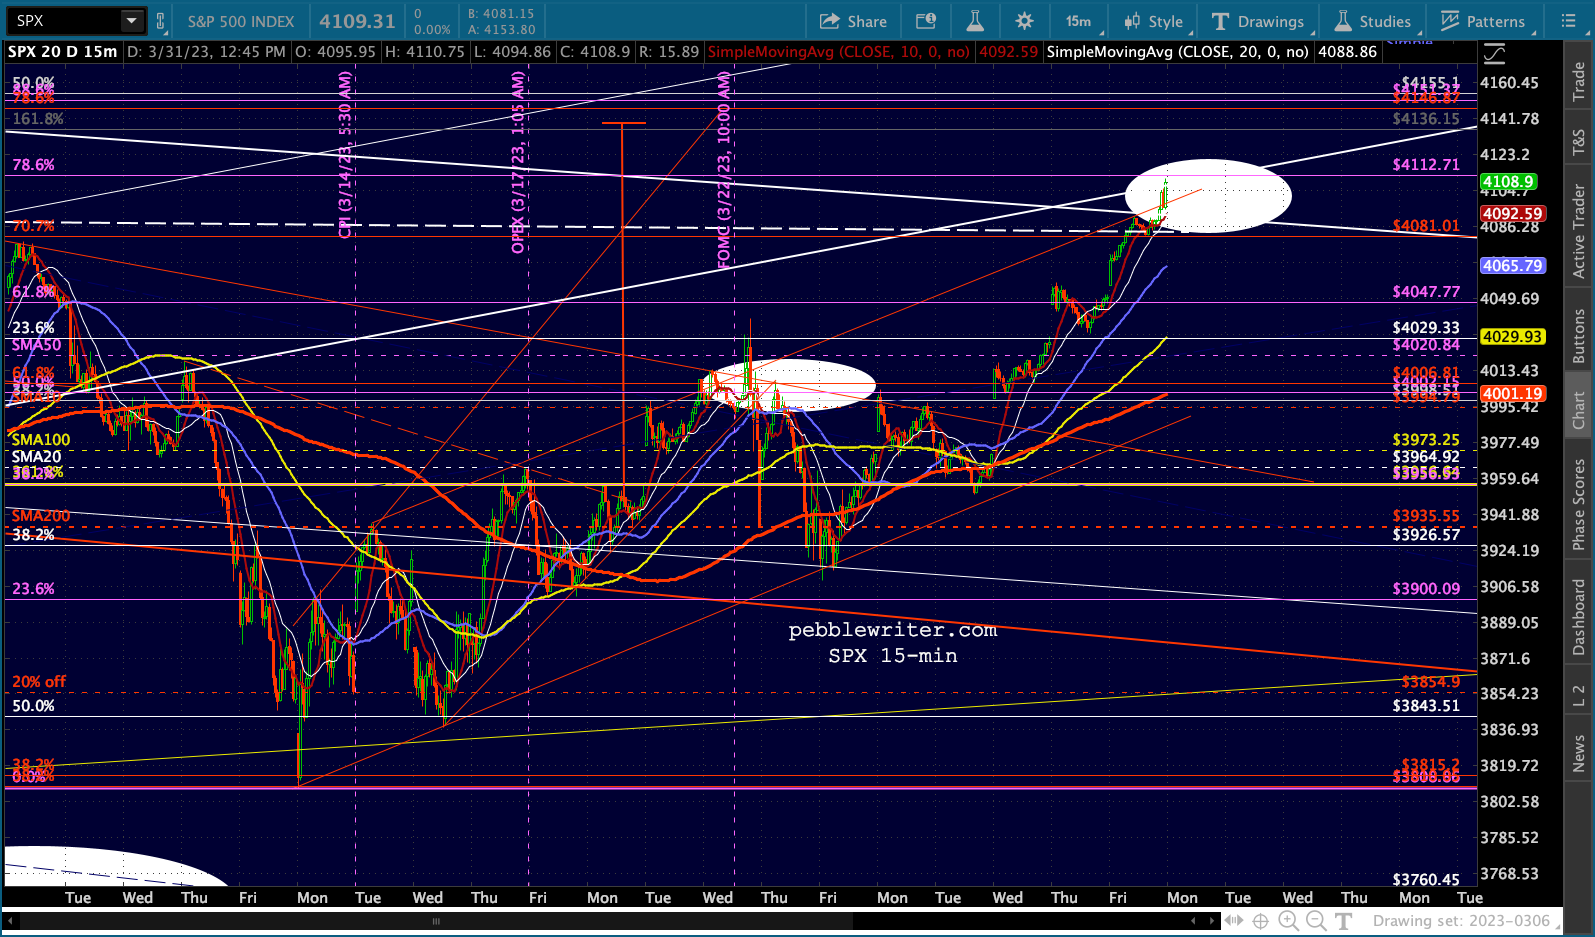
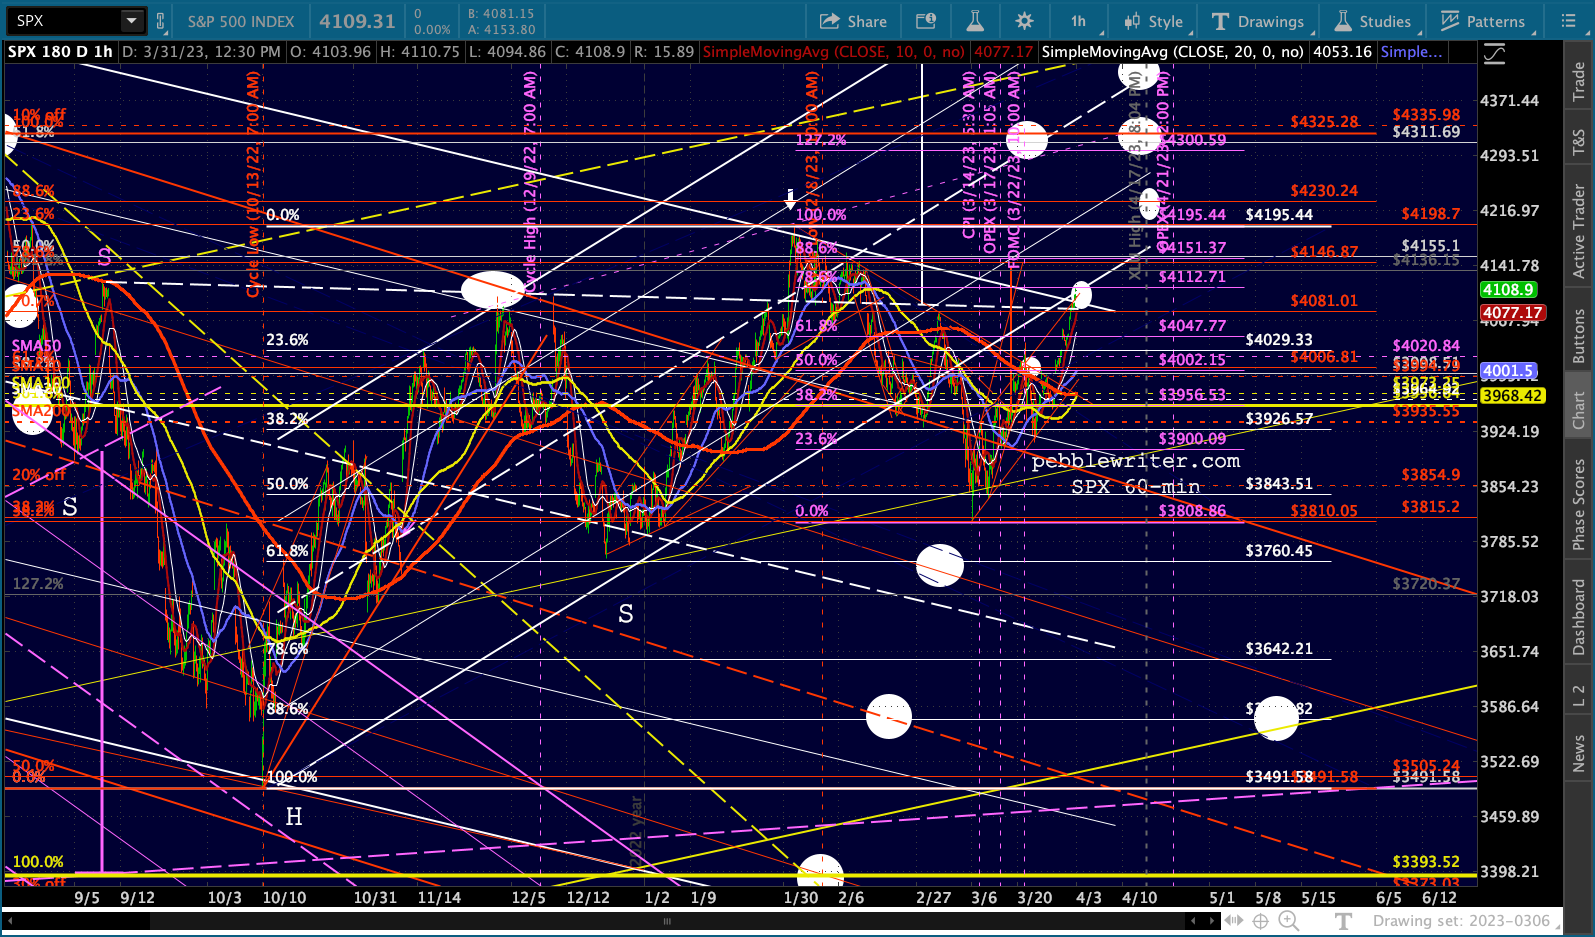
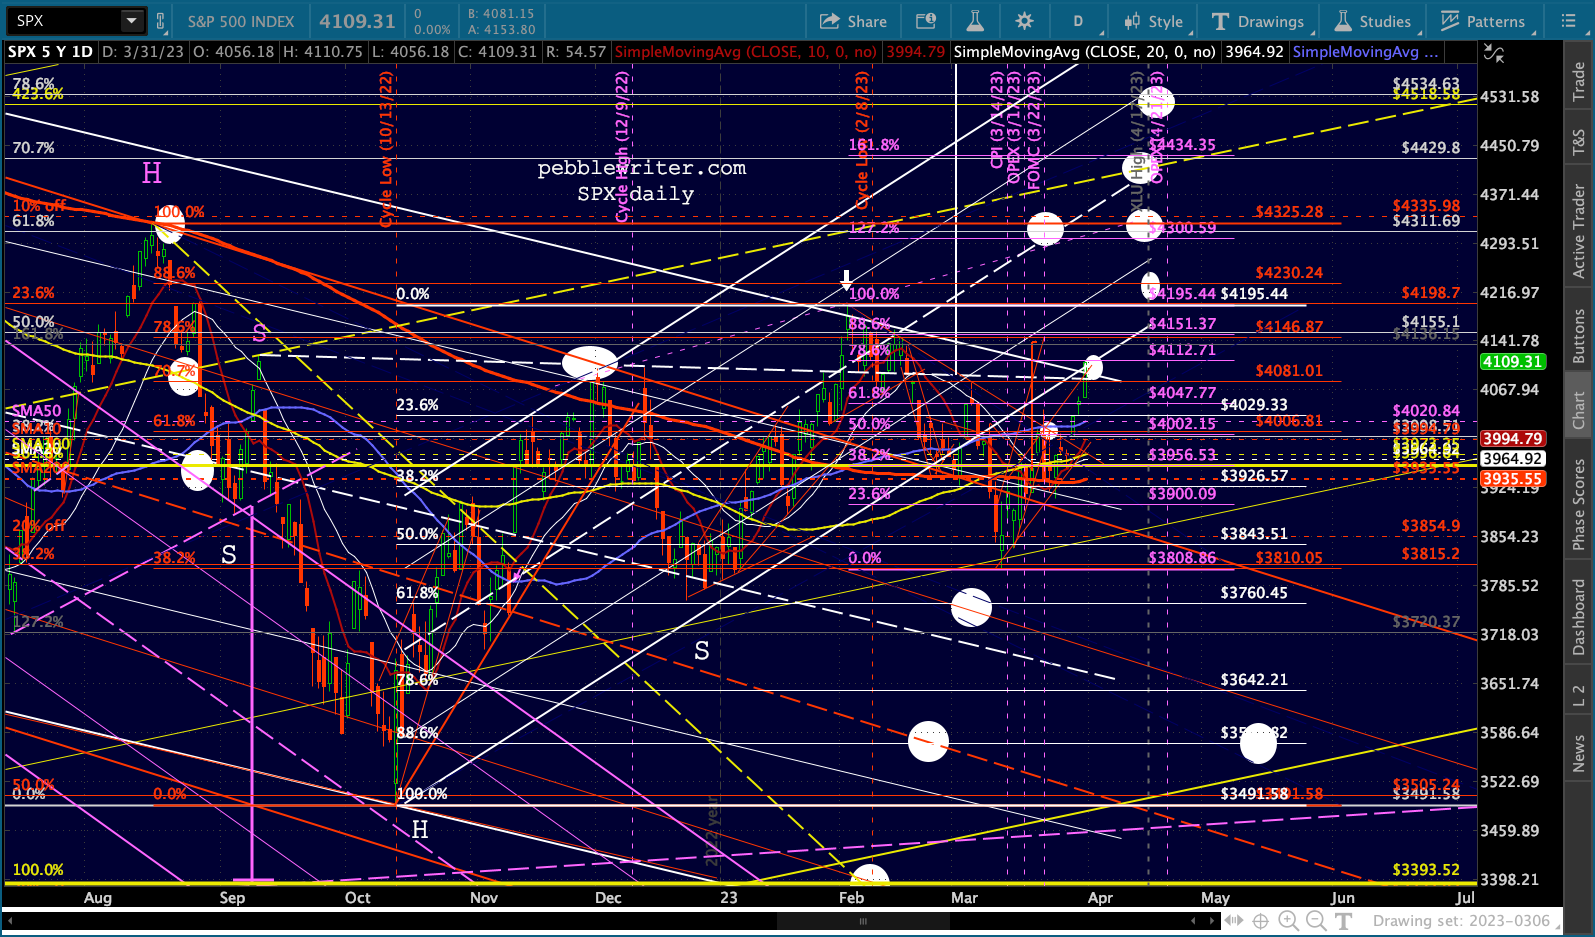
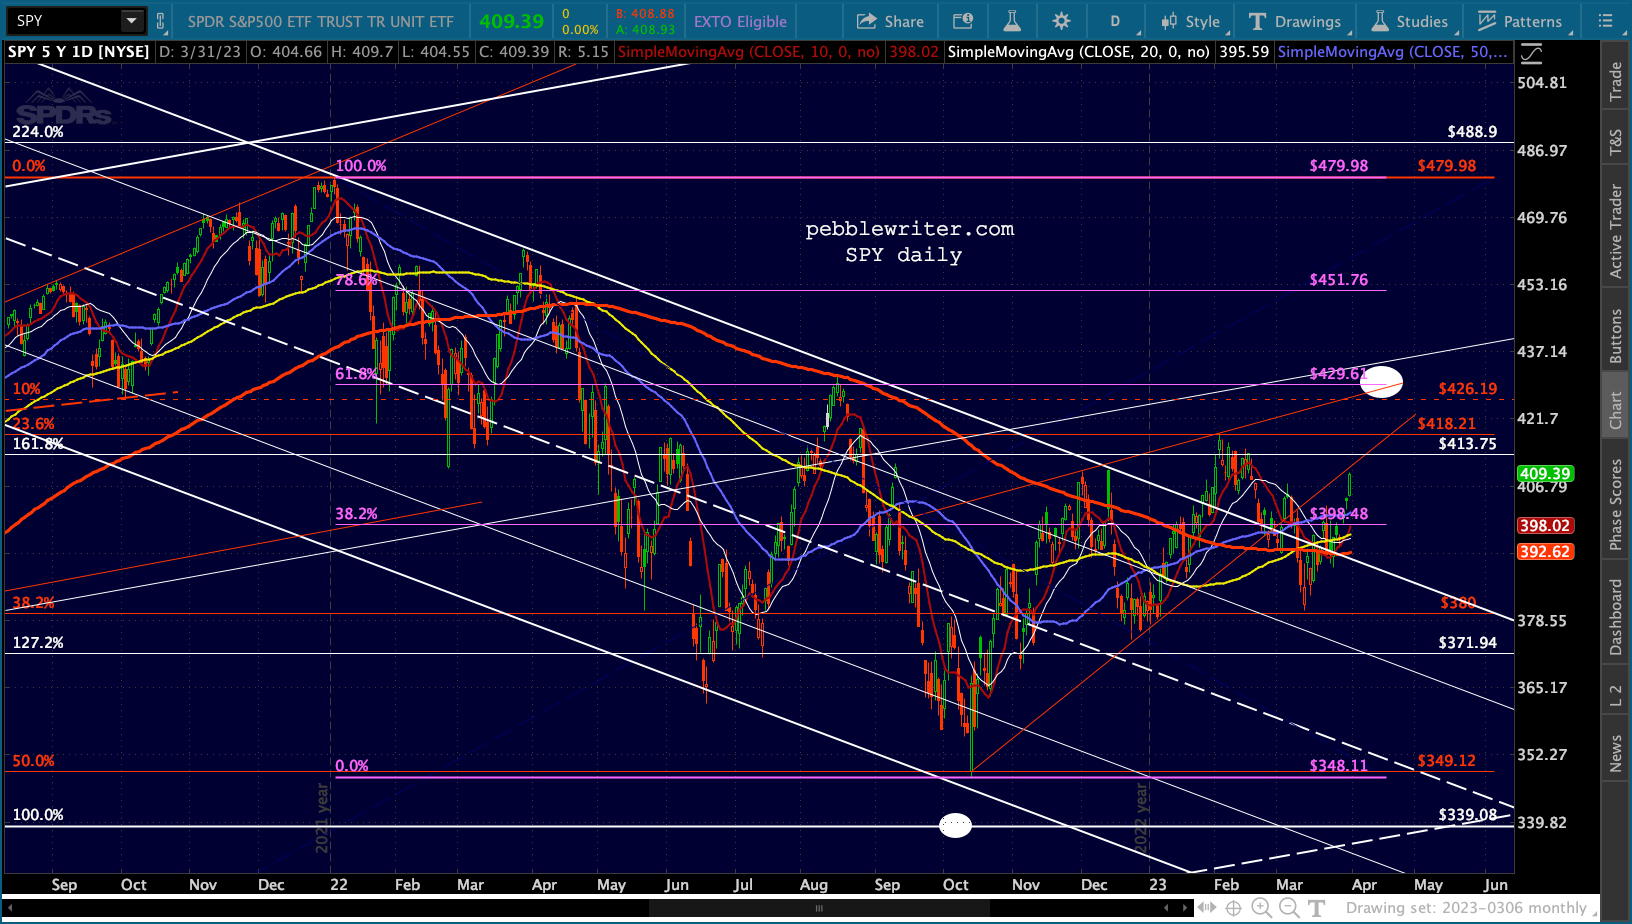
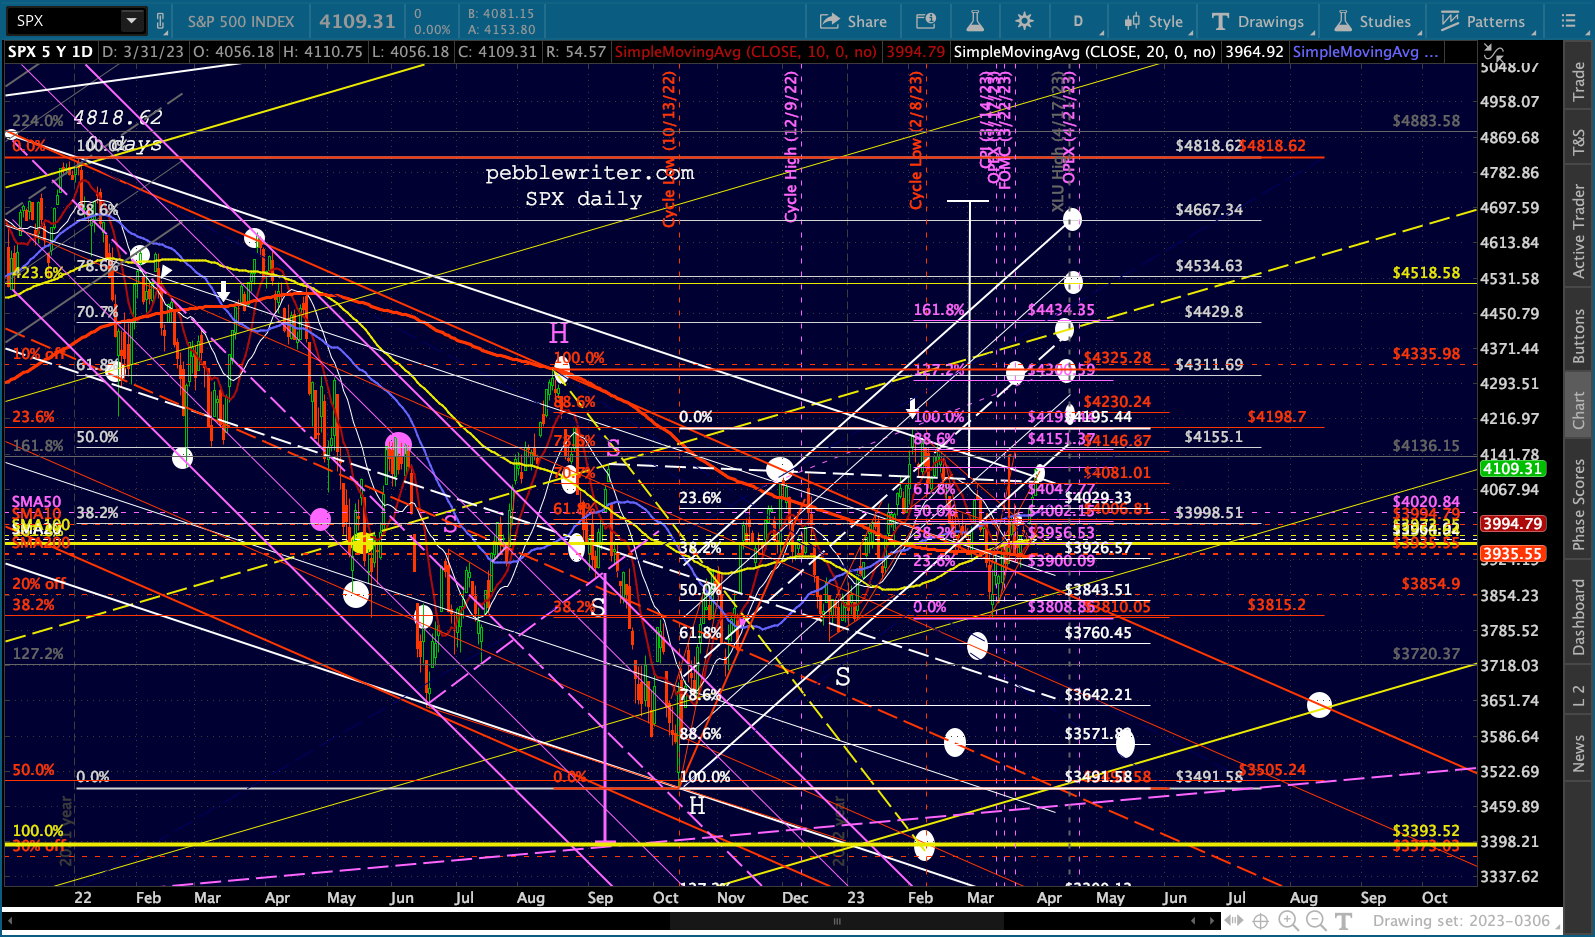 SPY suggests that the backtest targets we hit on Friday should hold.
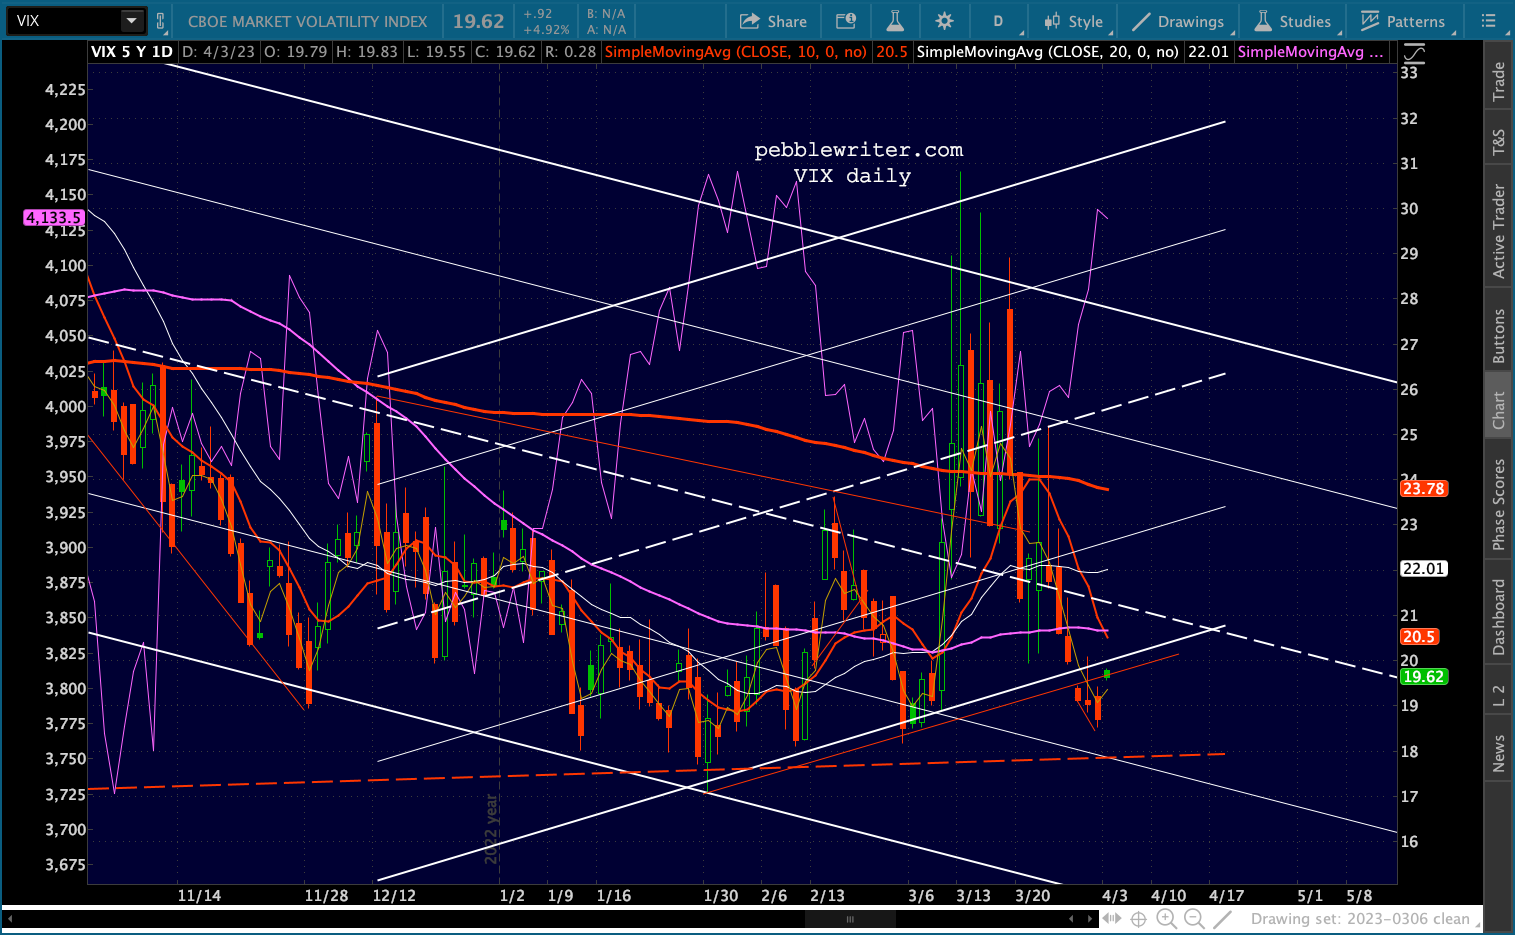
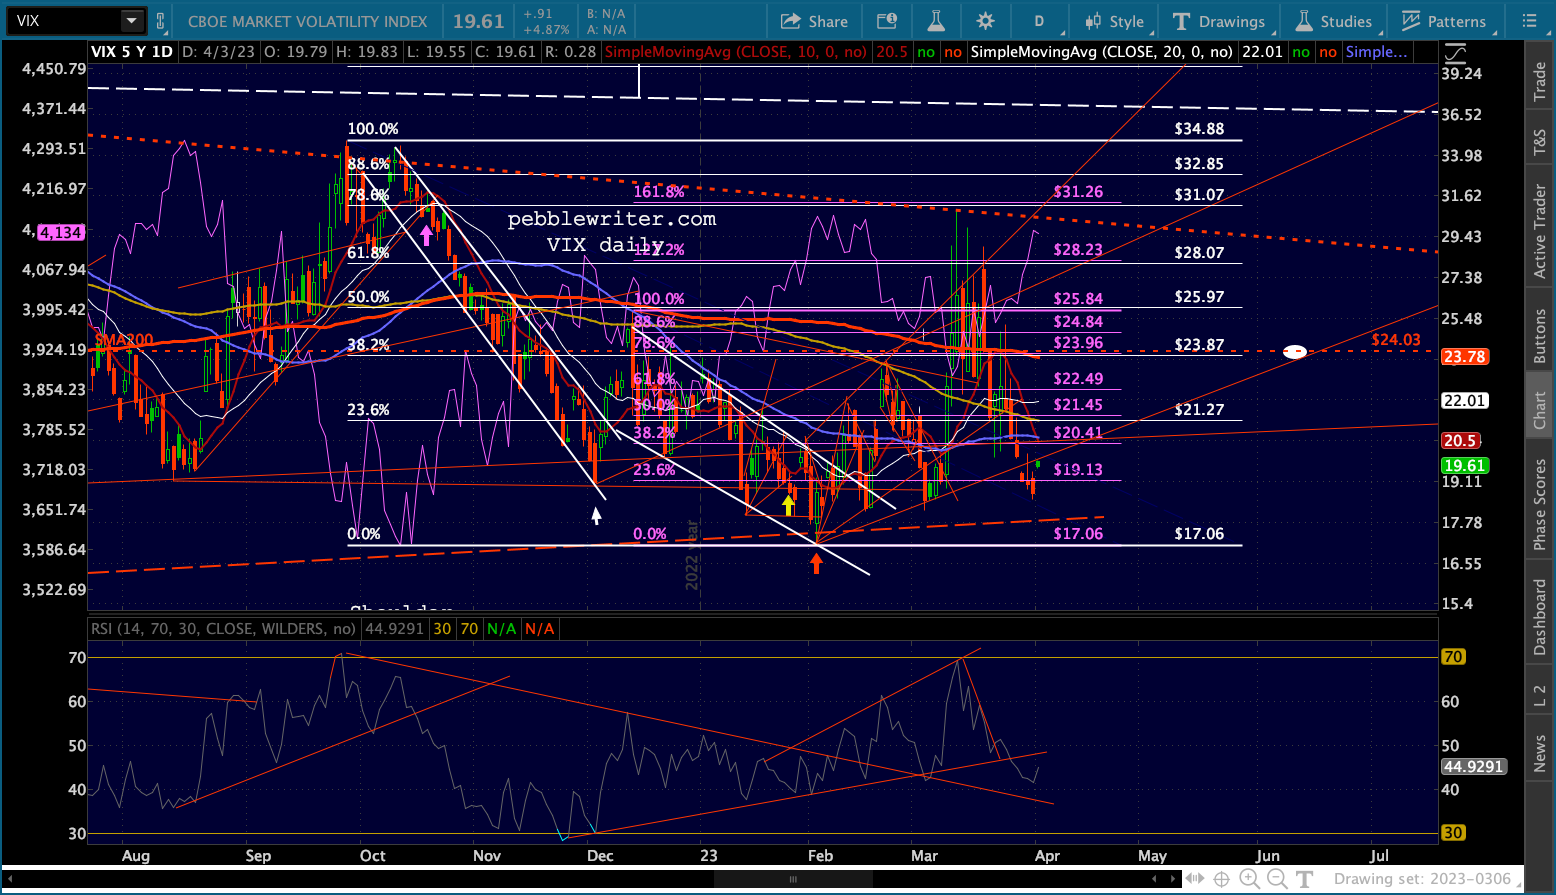
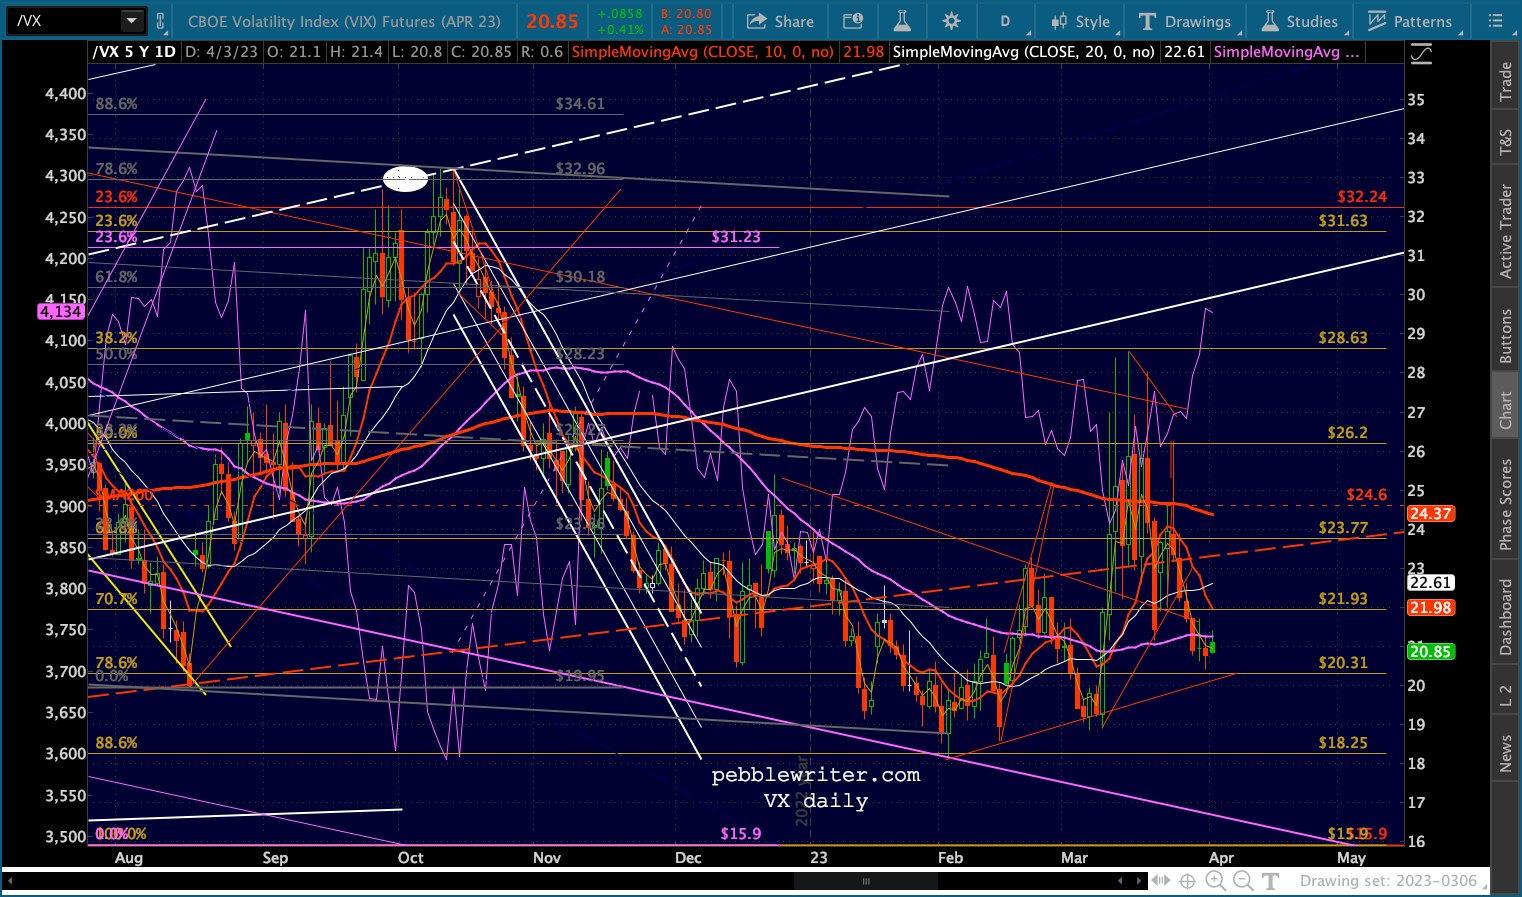
 And, VIX’s 60-min chart looks more convincingly bearish than its daily charts.
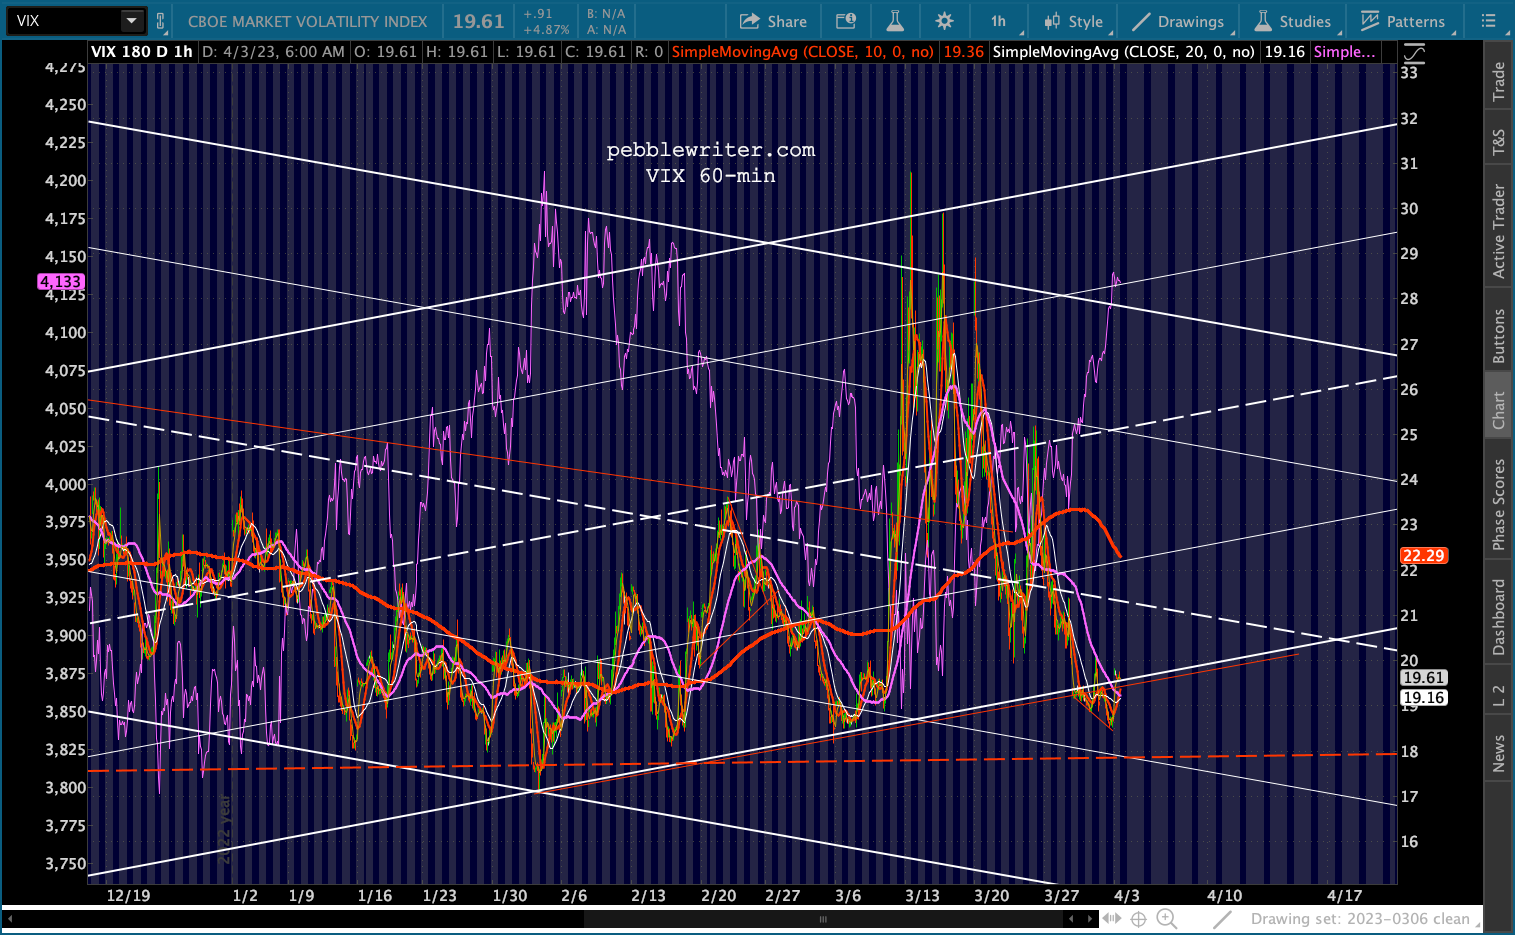
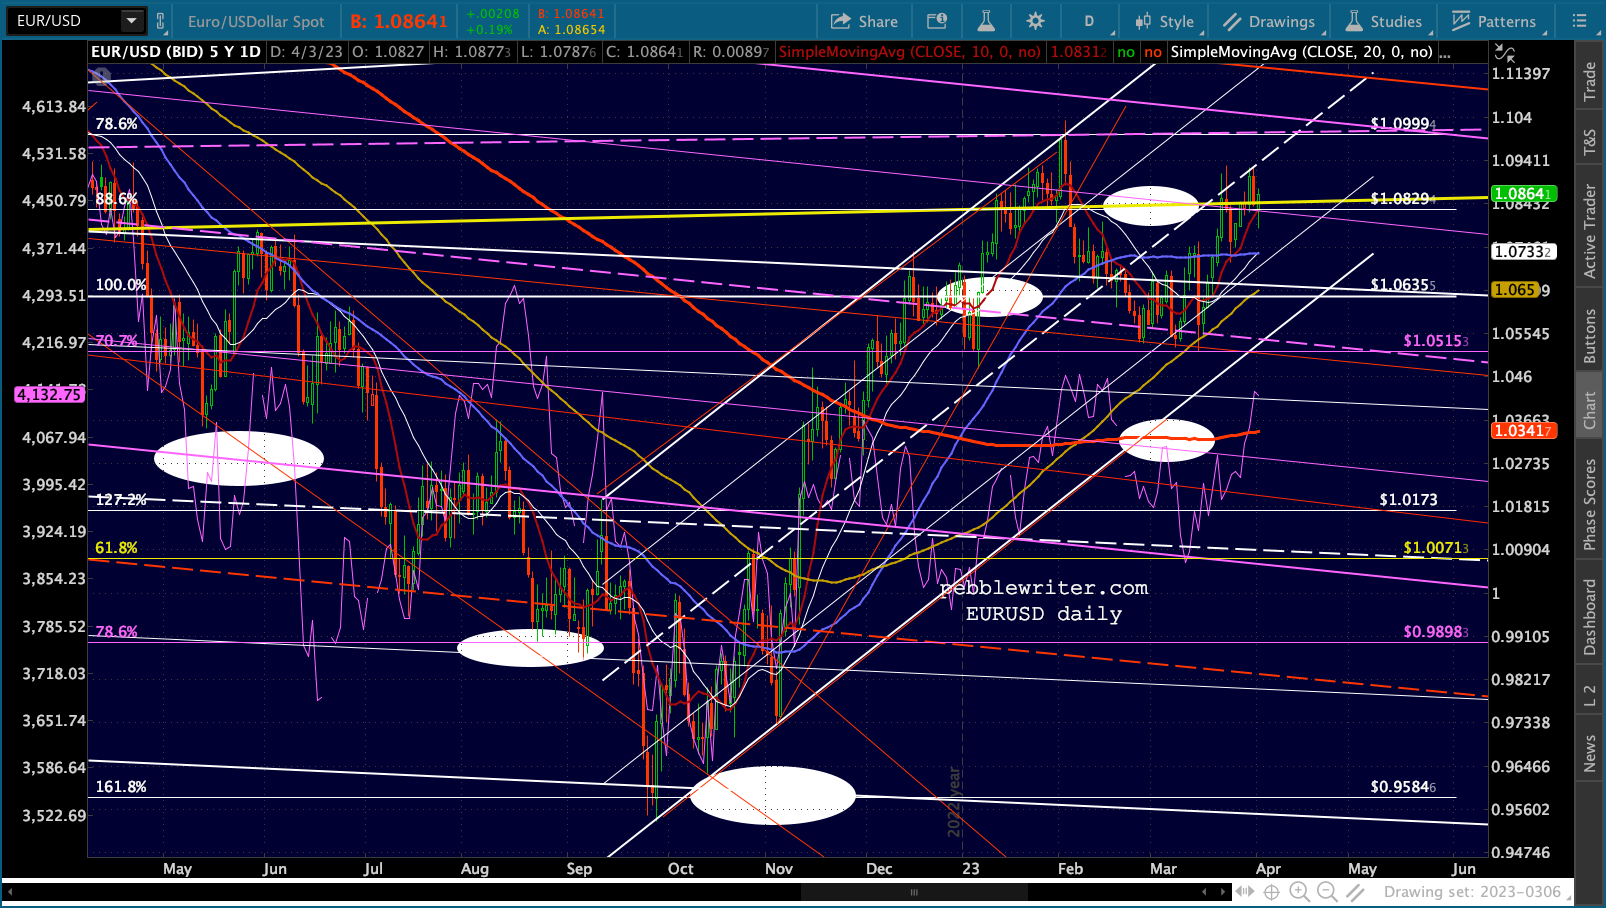
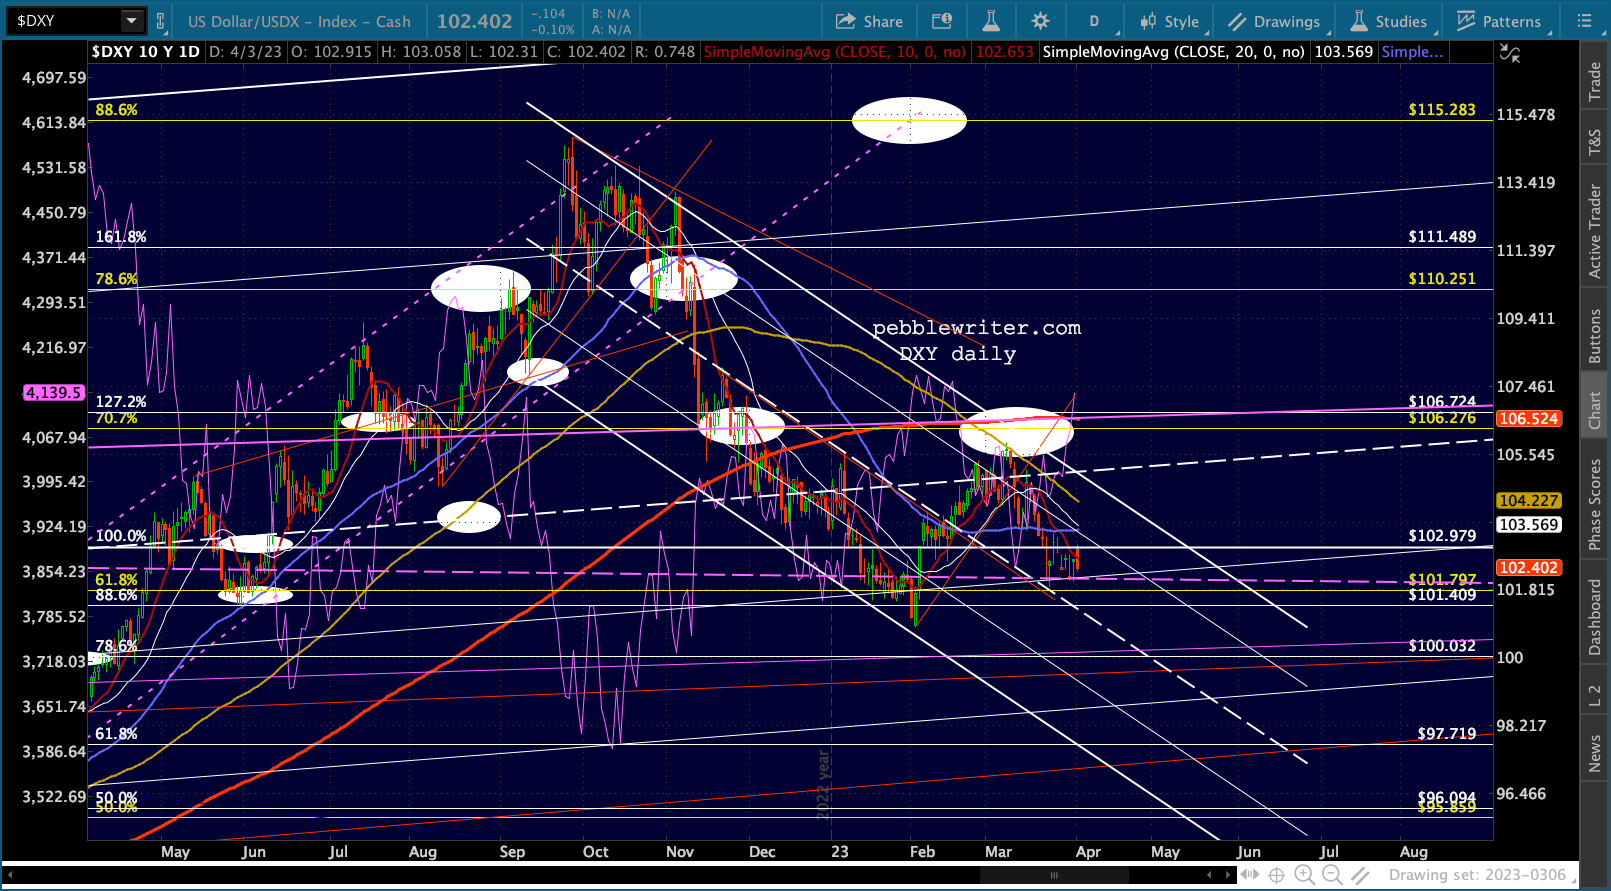
 Currencies are quietly bouncing all over the place, given the implications of more pressure on the Fed to hike some more than planned.
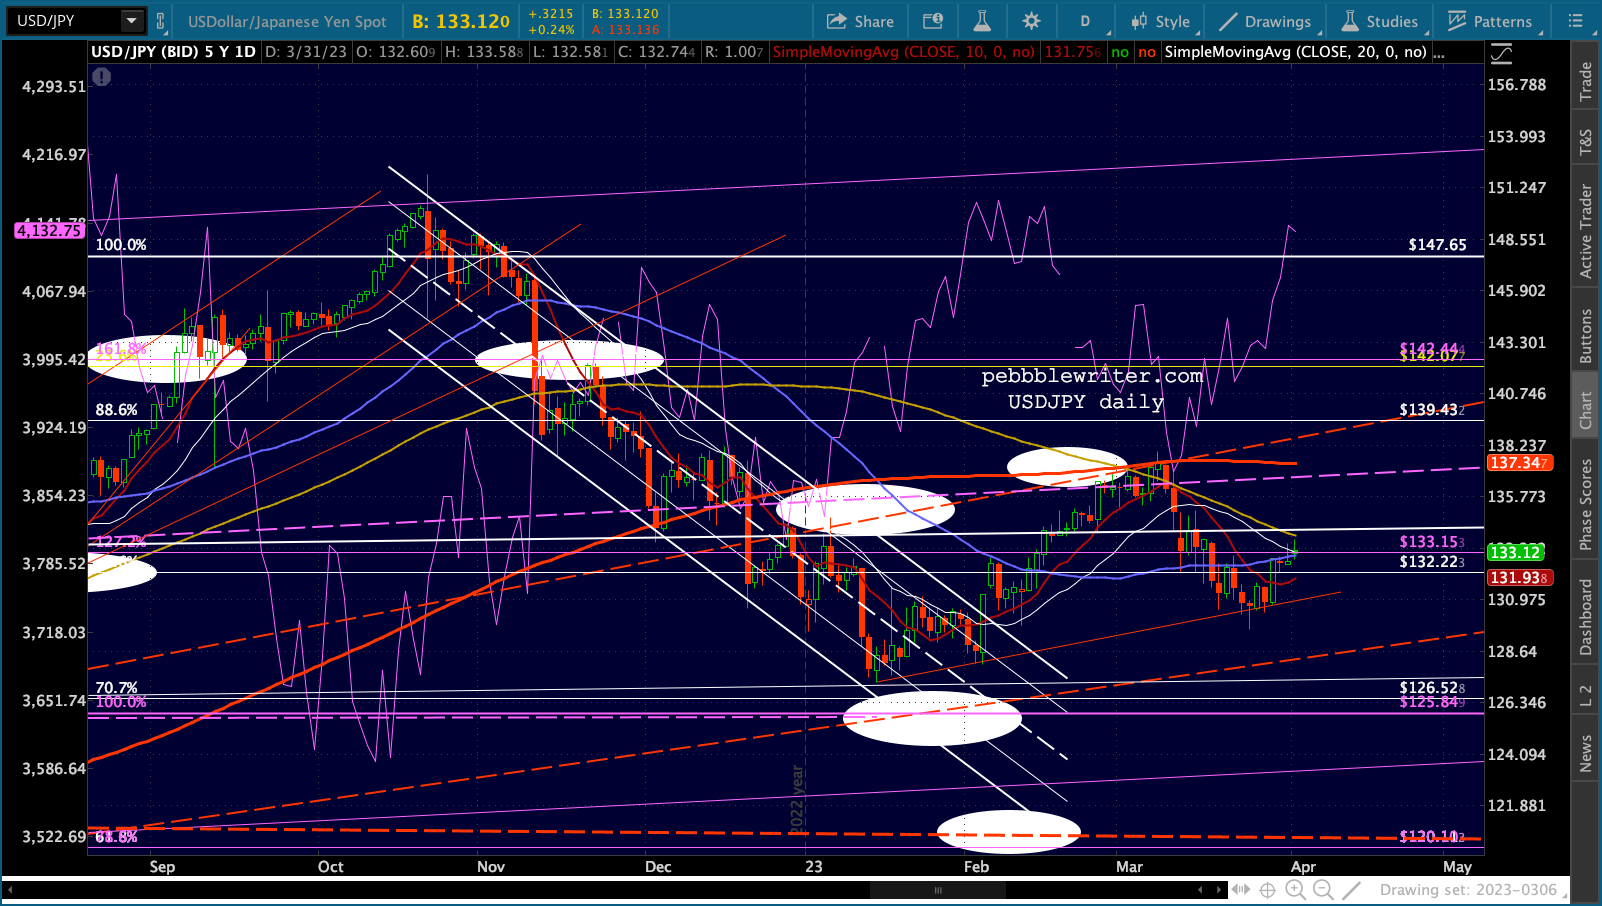 Will the BoJ decide this is the right time for a breakout? Could they even avoid it if the DXY strengthens with increase rate hike fears?
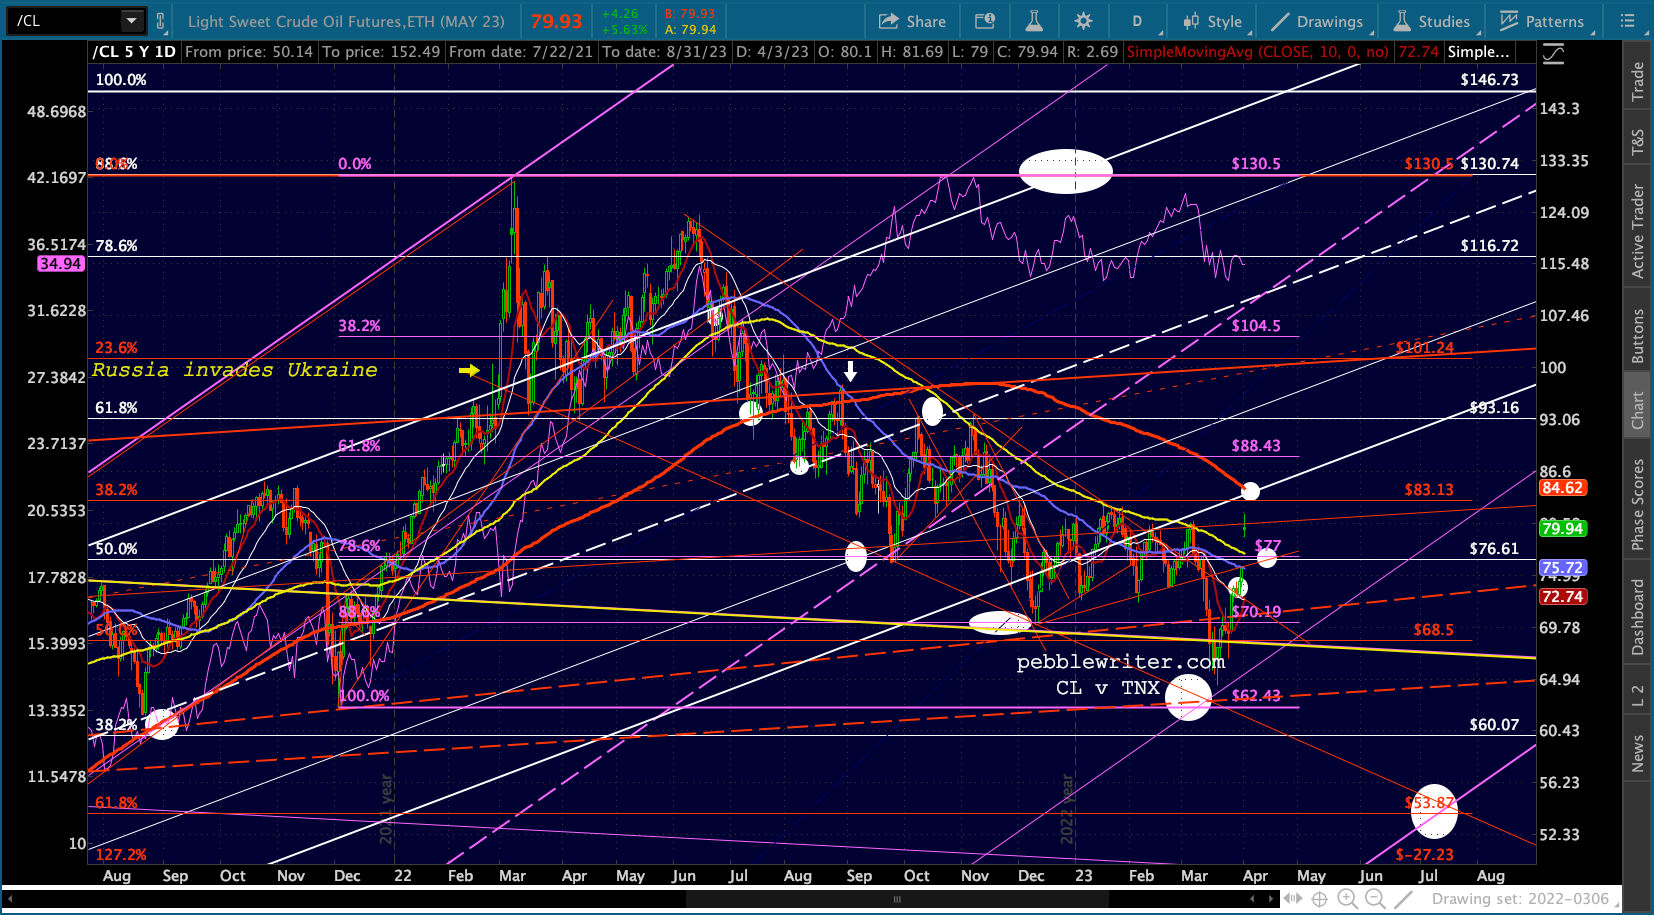
 This breakout is a big deal for CL, given that it gets another shot at the red TL and backtesting the SMA200 and broken white channel.
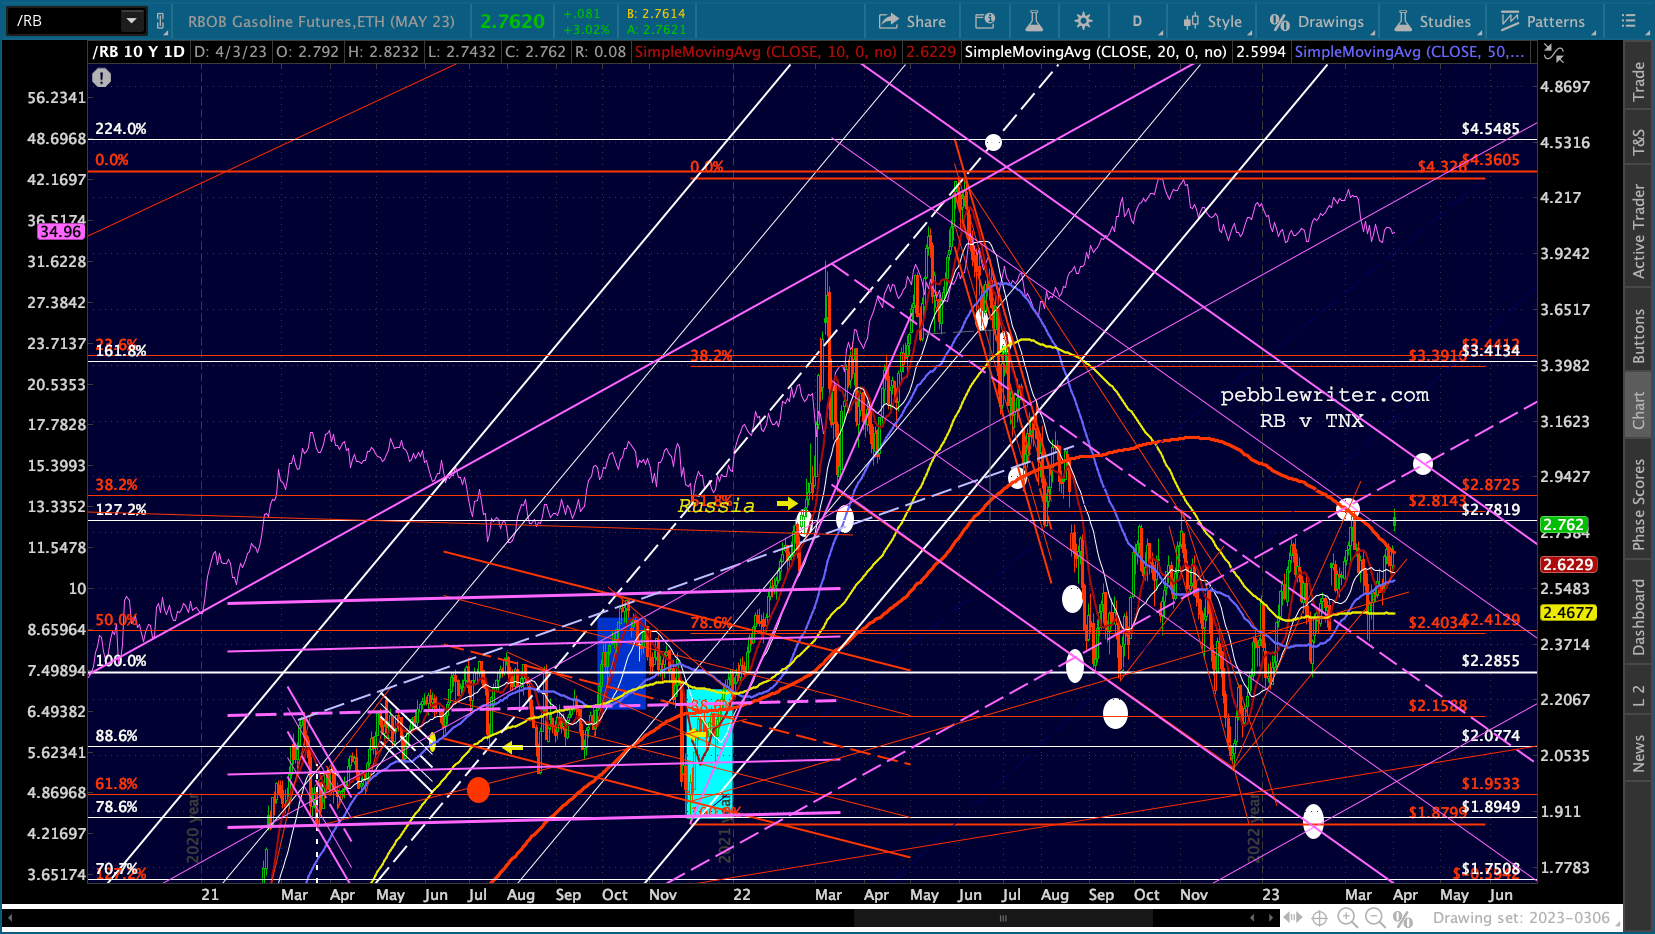
 But, it’s even more important for RB, which went ballistic last time it broke above its SMA200.
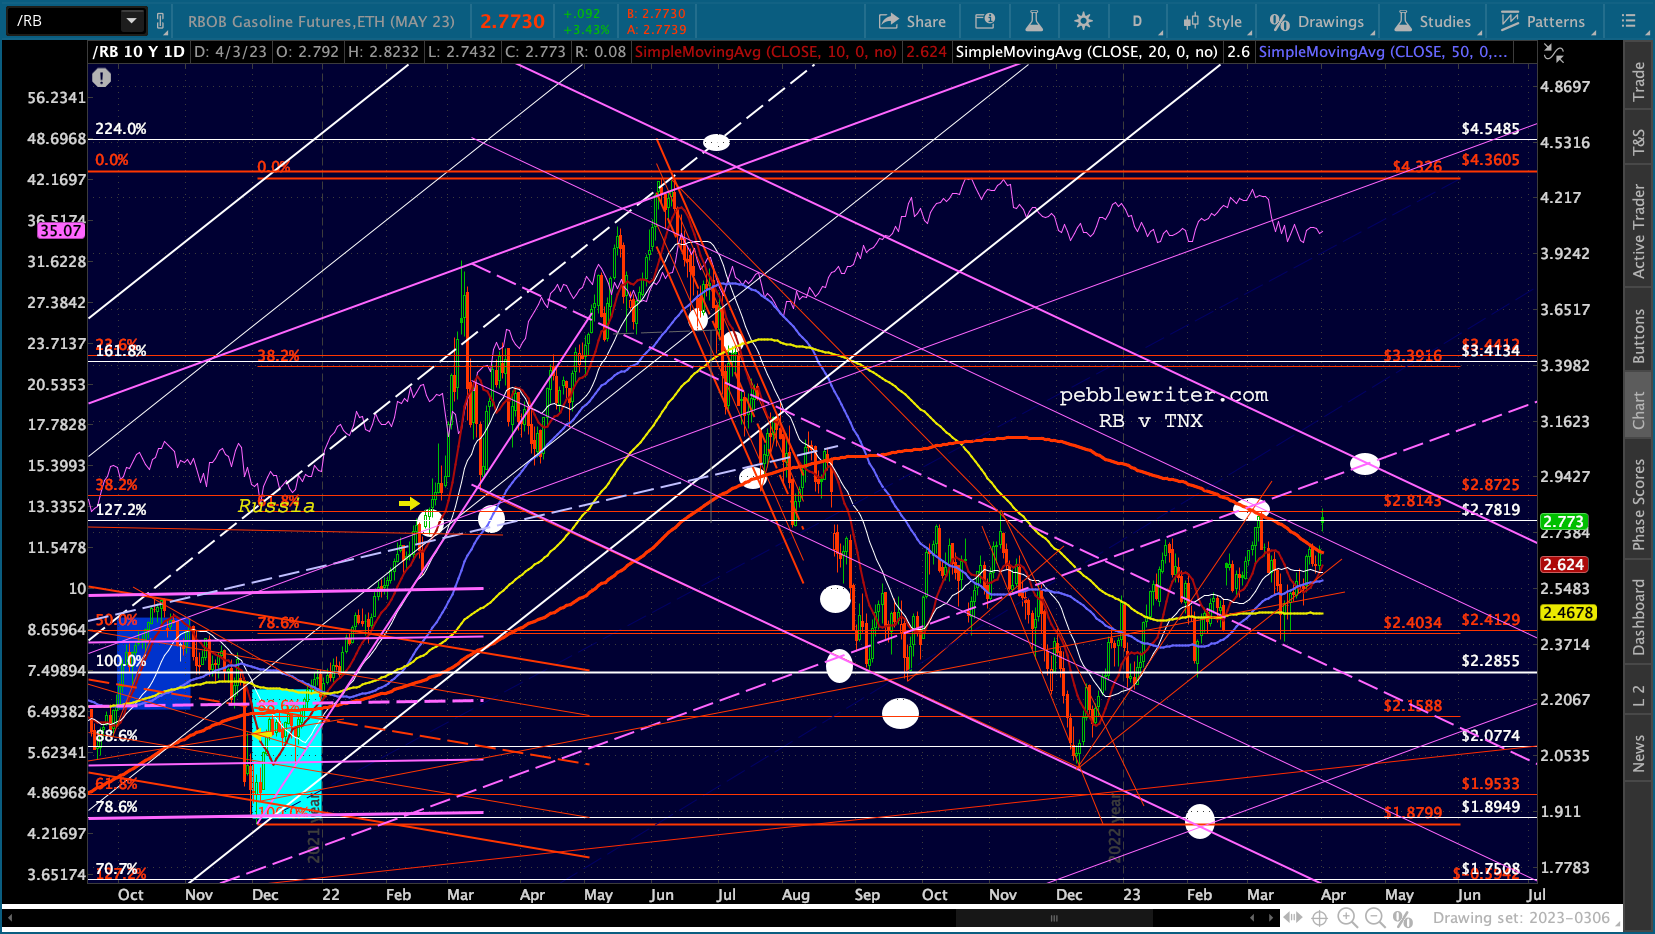
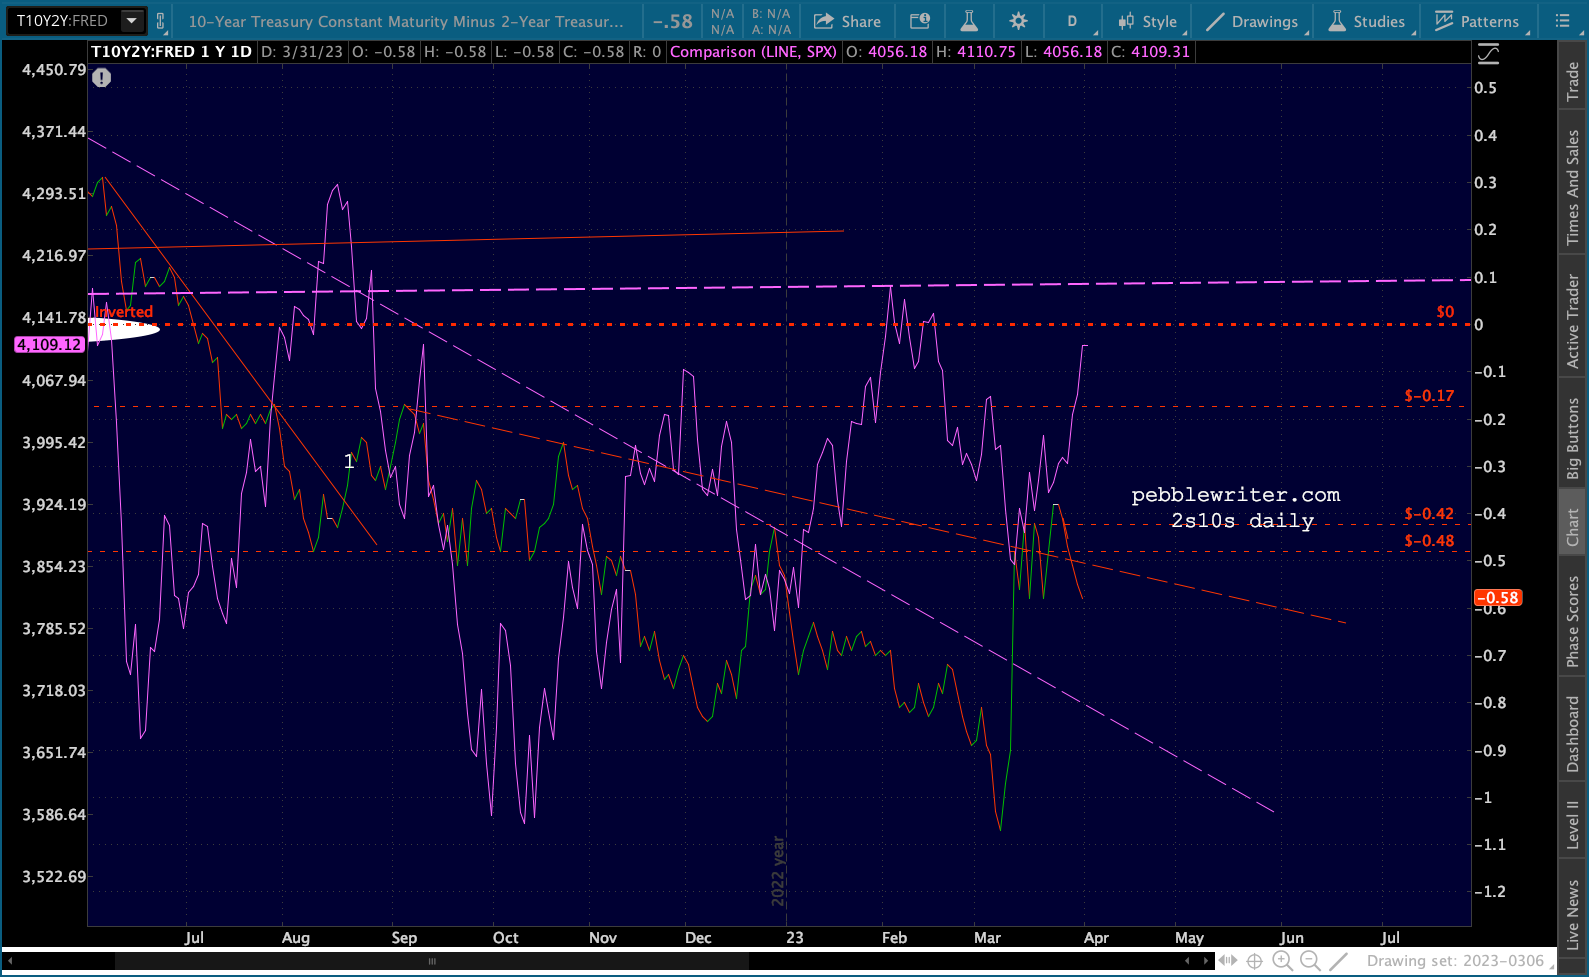
 Not surprisingly, the 2Y is getting more traction from oil’s move than the 10Y, helping the 2s10s back away from the breakout it had threatened last week.

stay tuned…