

In last month’s update on gold and silver [see: Dec 5 Update] we noted that gold and silver had reached our mid-October targets. We forecast that silver would likely drop to its 200-day moving average and continue dropping to backtest two significant trend lines at 22.
 It reached 22.04 on Monday before and has bounced 2.5% this morning.
 Likewise, gold reversed sharply off our 2152 target from October and dropped 160, but hasn’t quite reached our next lower target. It is an interesting development, and one which makes a statement about the USD and, possibly, inflation.
continued for members…
First a general snapshot of markets this morning…
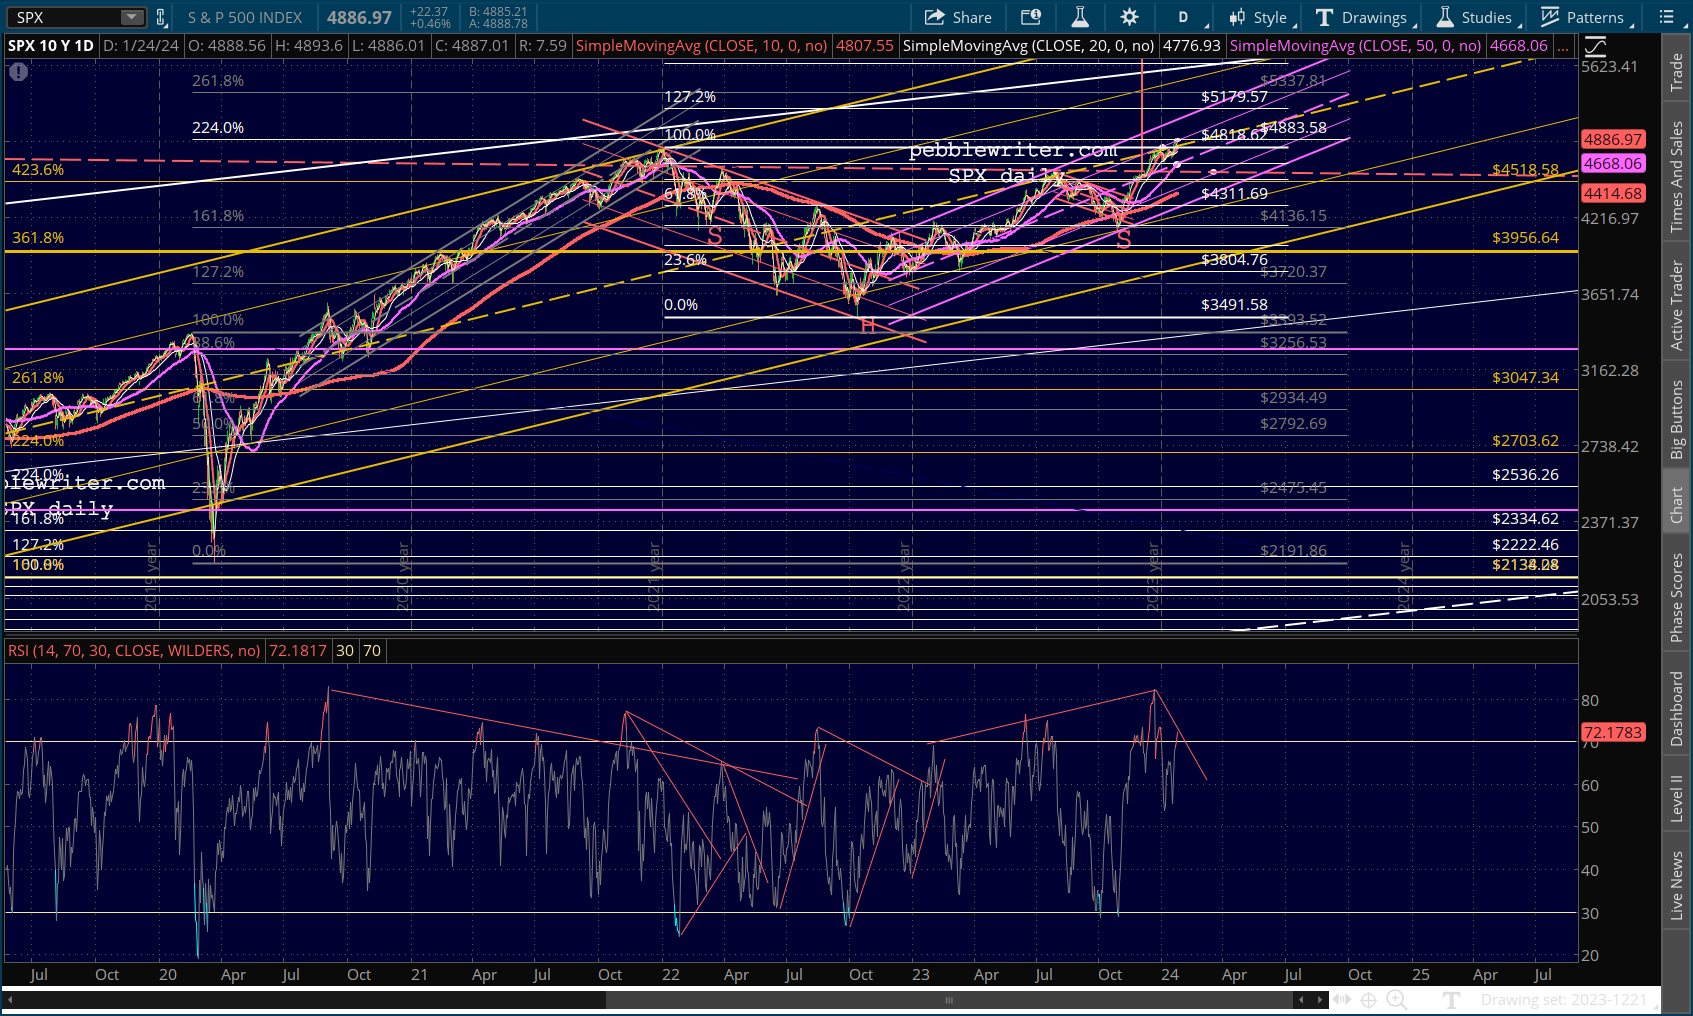
ES is up over 20 points overnight, mostly on NFLX’s bullish call after the close yesterday. the SMA50 has about one more session before reaching the July 27 highs at 4738. This means that a sharp backtest of this particular level (a more bearish scenario, for sure) will soon become less likely. 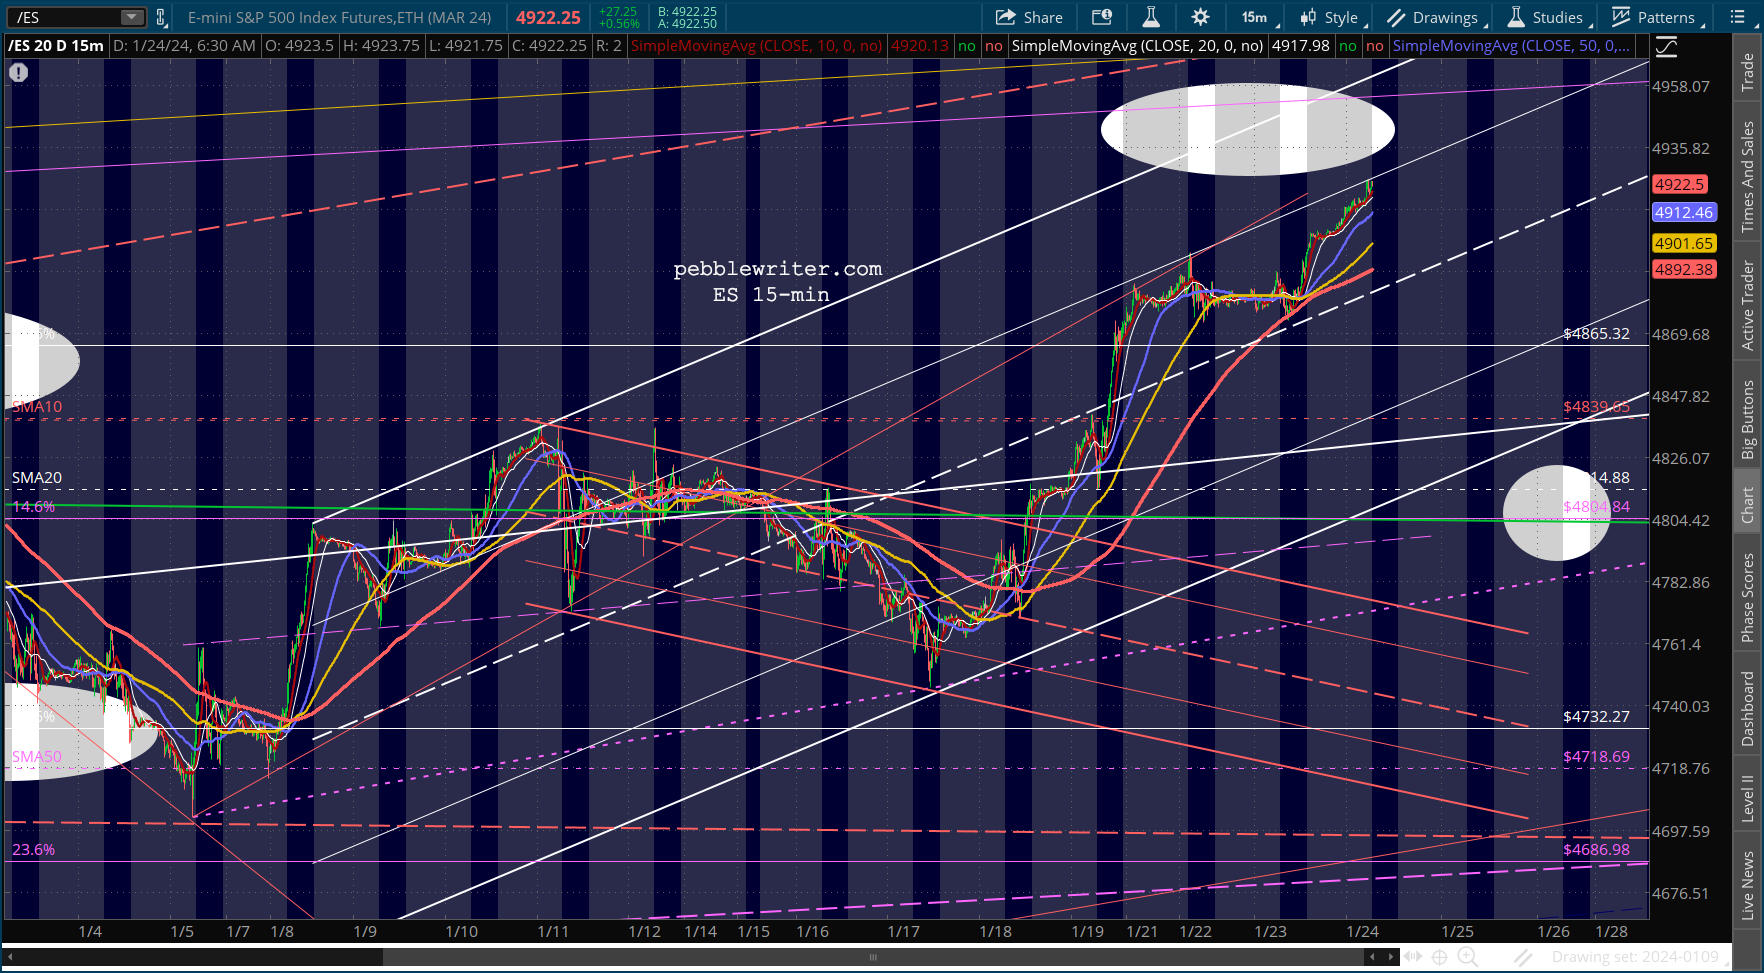
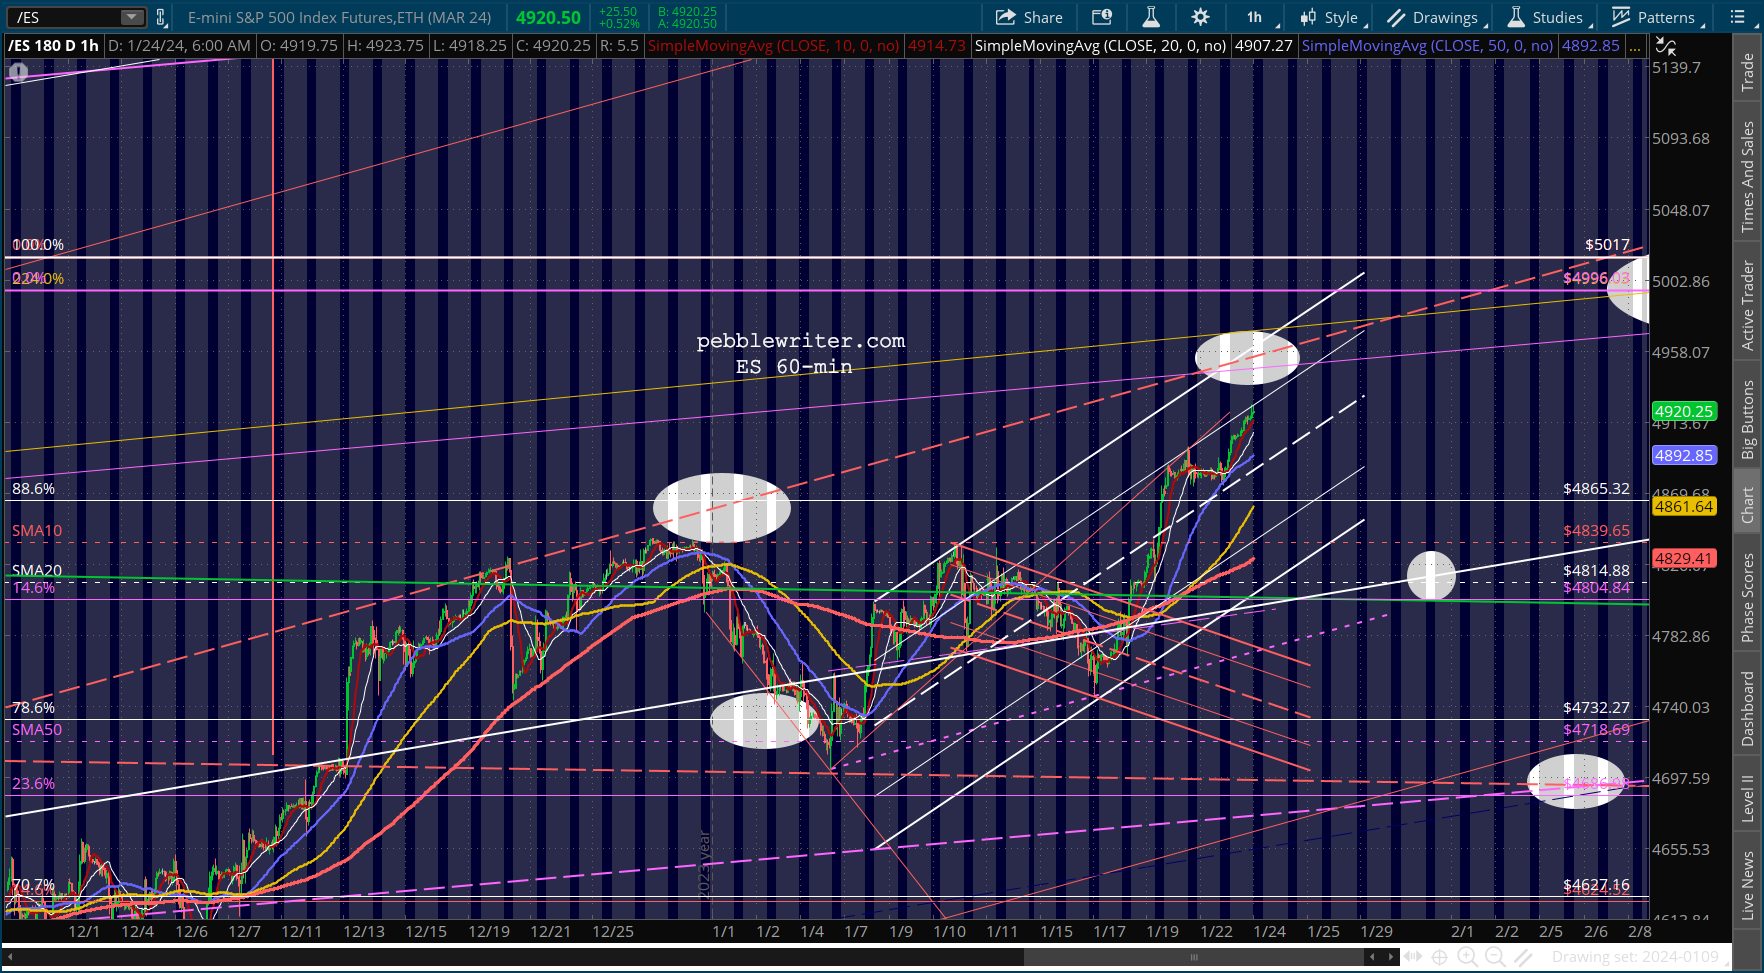 The (still) steep incline of the SMA200 argues for a more extended upside run, though ES will soon run into a Fib 2.24 extension at 4996, near enough to 5000 to potentially matter.
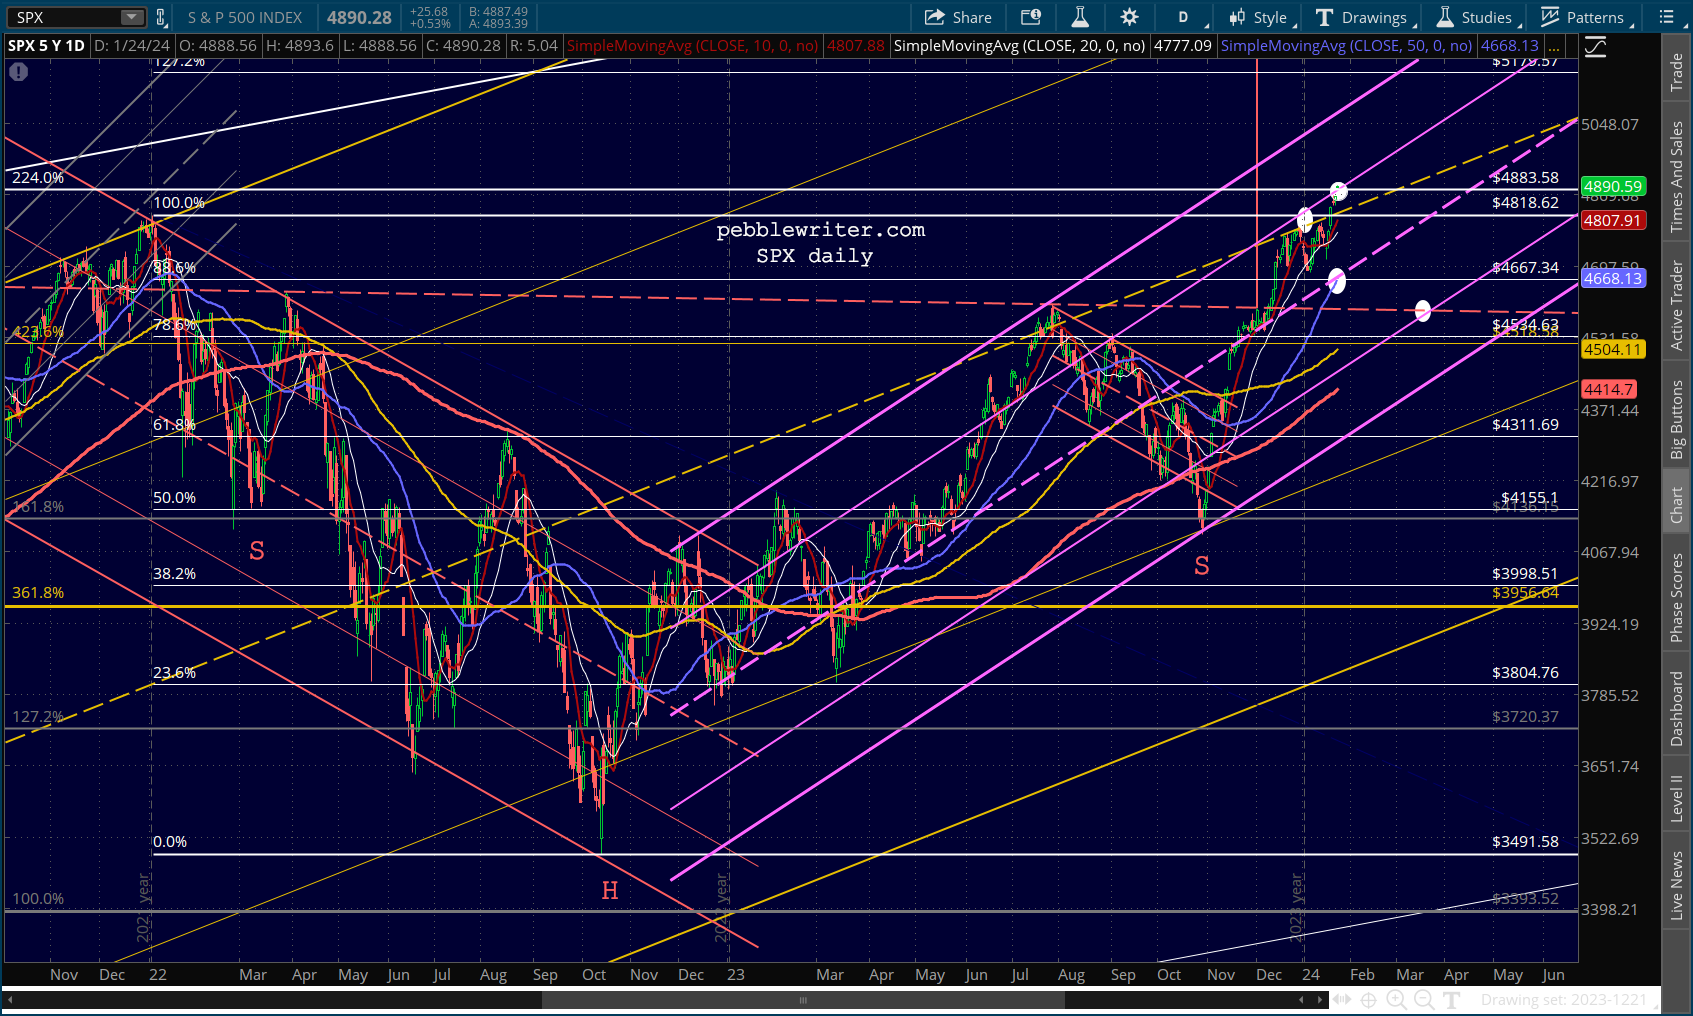
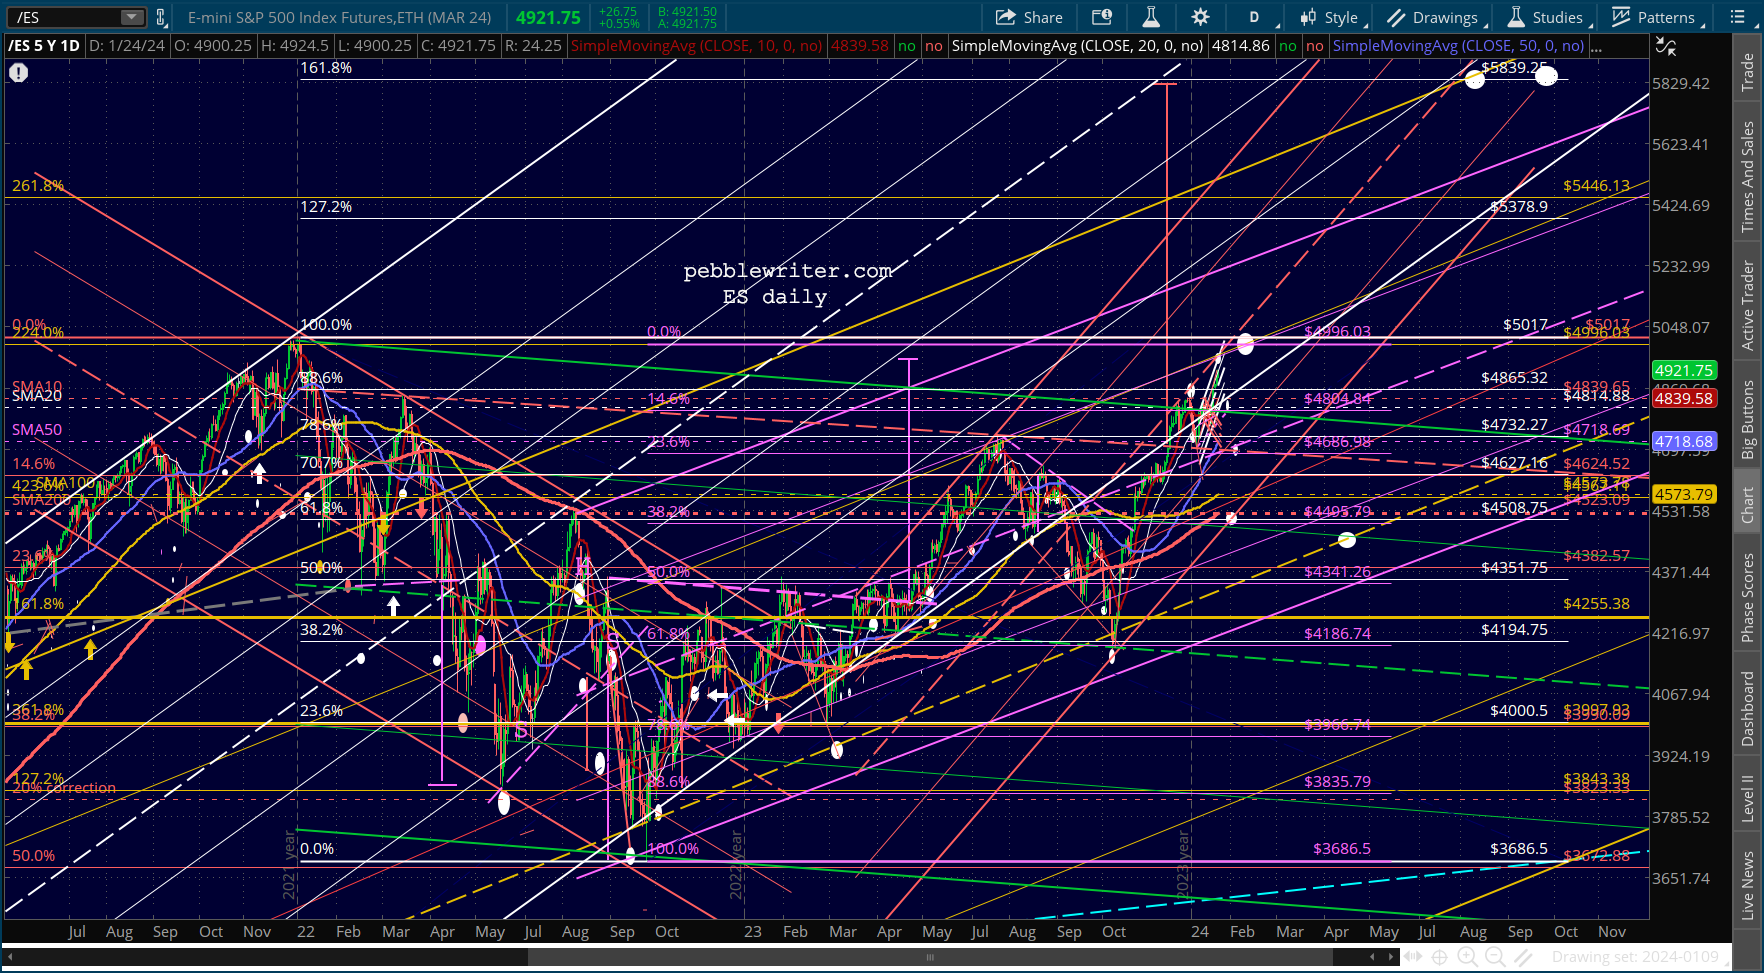 This puts SPX above its 2.24 at 4883. If it holds, there isn’t much overhead resistance until 5179ish – though the round number 5000 would represent an important threshold. If it doesn’t hold, then some rather bearish indicators start to matter. Read on.
 On the other hand, there is very substantial negative divergence with RSI – which recently reached a super high 82.18 – a level rarely seen that is usually followed by a correction of at least 10%.
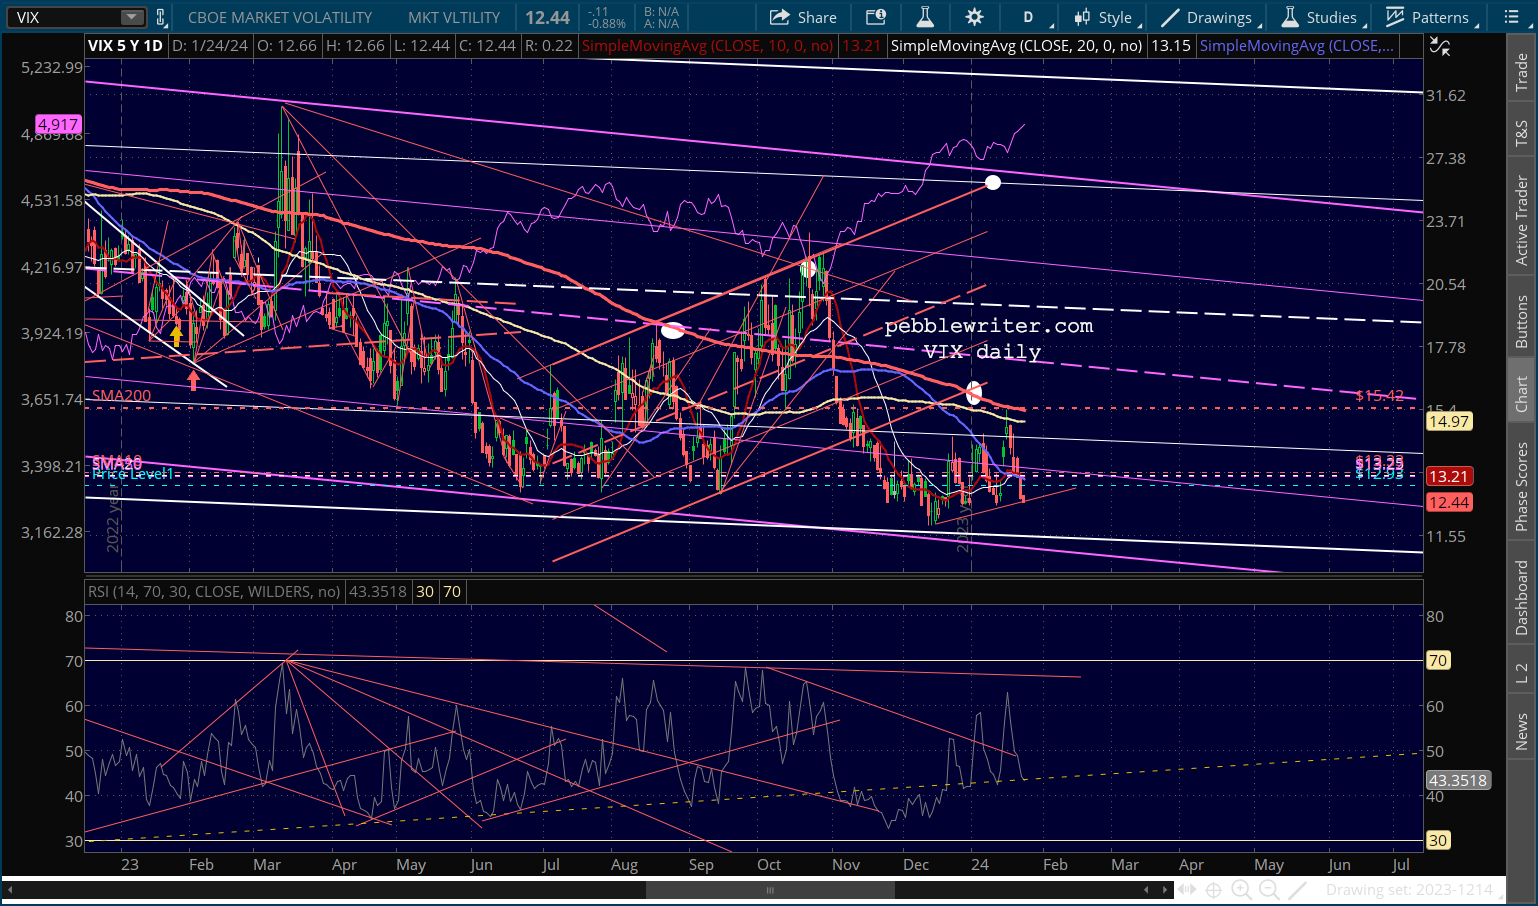
 Note that VIX is testing a TL connecting its recent lows. If it doesn’t break down below 12.40, then I would look for a rebound to actually tag its SMA200 – now lower than its Jan 17 highs at 15.4. It could bring the current meltup to a screeching halt.
 Likewise, the apparent breakout of EURUSD from its falling white channel (recall that it broke back into this channel on Jan 16 before testing its SMA200 for over a week) also represents a backtest of the white channel’s top as well as the SMA50 and SMA10. If it can’t break out of the channel again, this will represent a serious headwind to stocks.
  I do believe tat EURUSD will have trouble breaking out again – simply because of what it would do to the DXY and the (already iffy) inflation picture in the US. Simply put, US CPI cannot drop dramatically if the DXY plunges. The DXY broke out of a little falling channel that’s been in place since October — which was, not coincidentally, the stocks market’s lows.
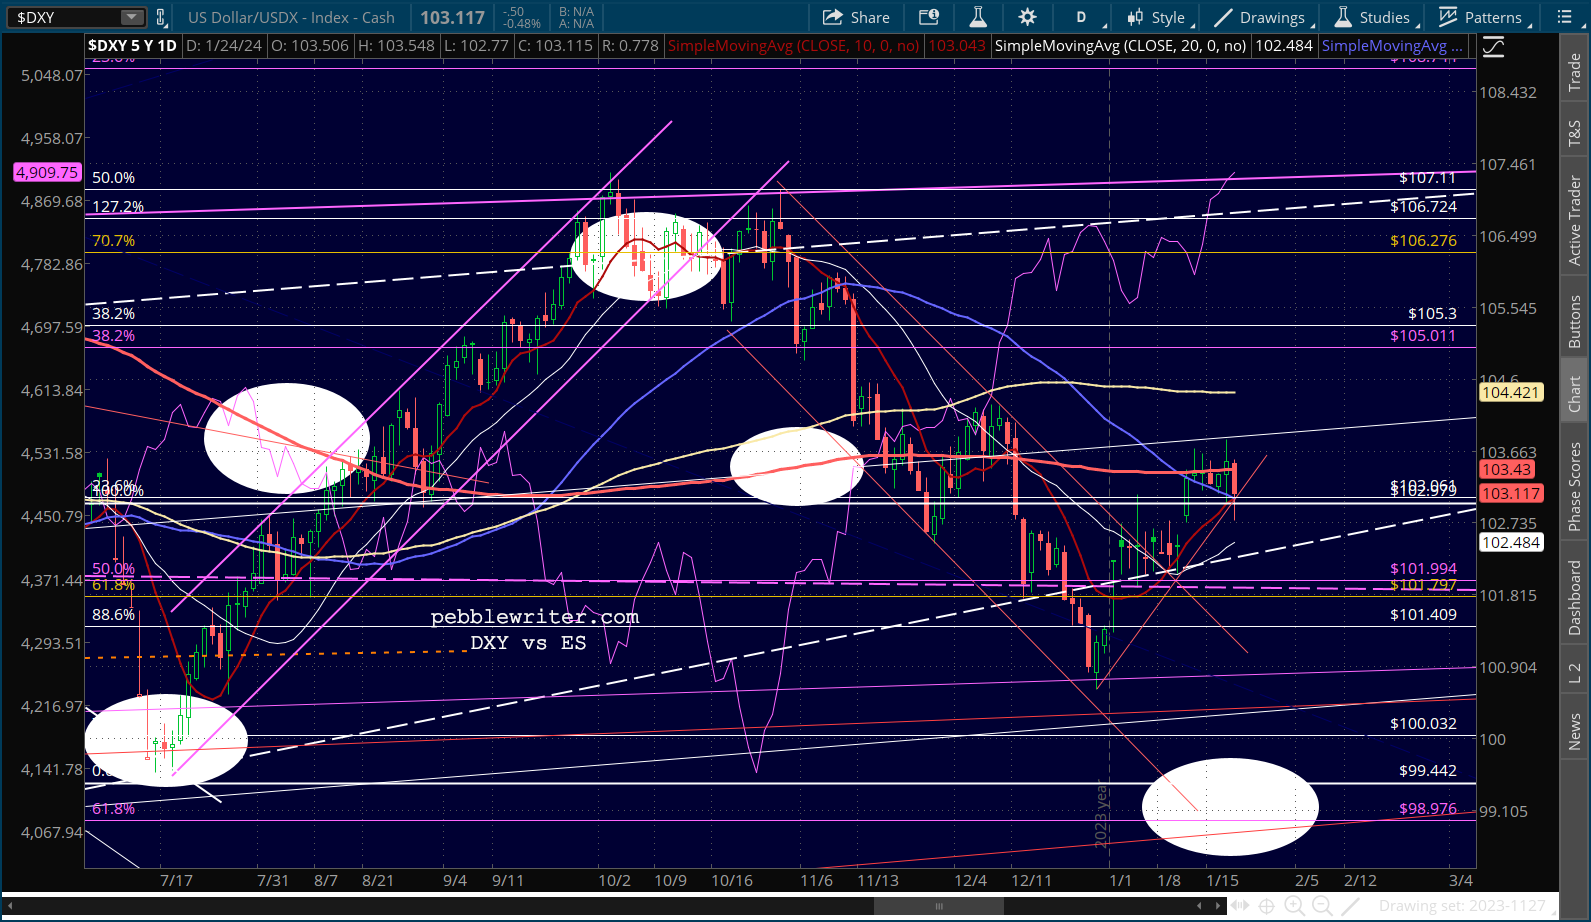 Note that USDJPY is exhibiting its first sign of weakness since Jan 2 – also a negative for stocks.
 Oil and gas continue to nudge higher…
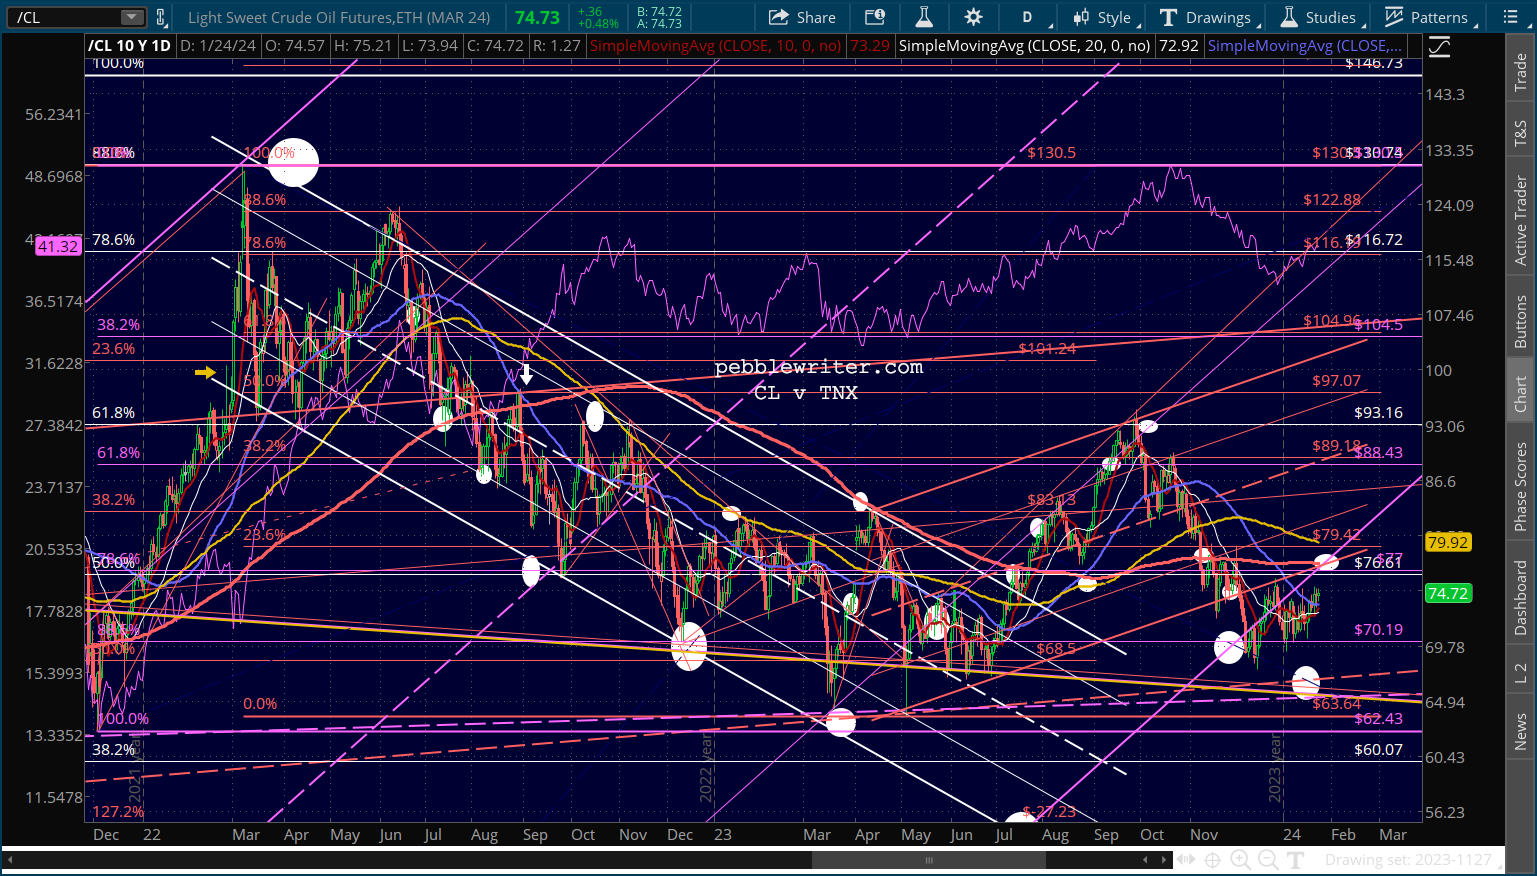
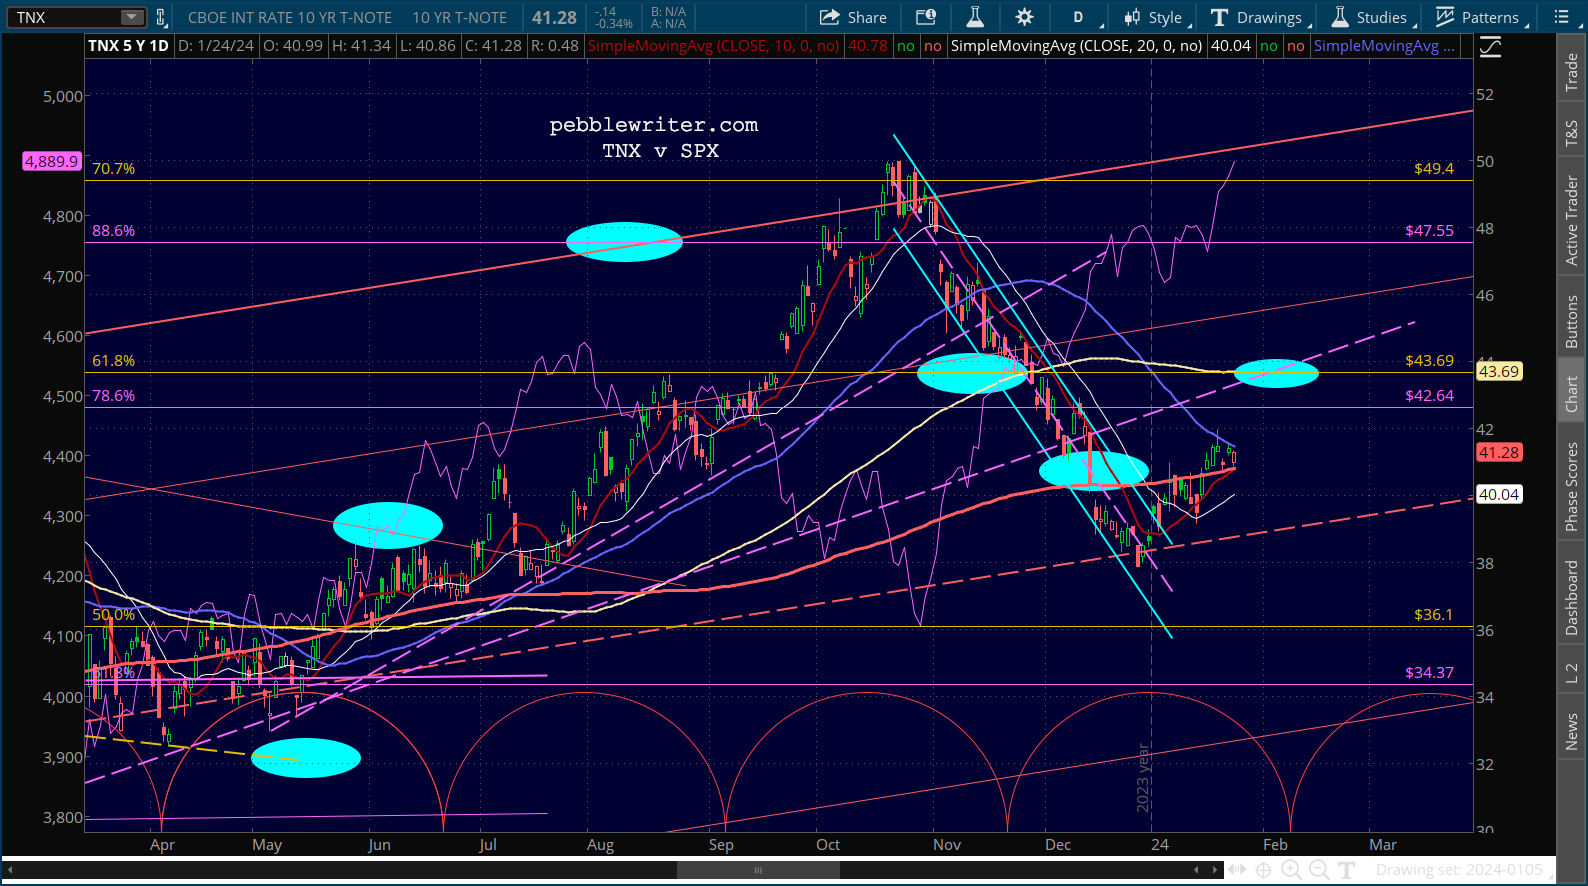
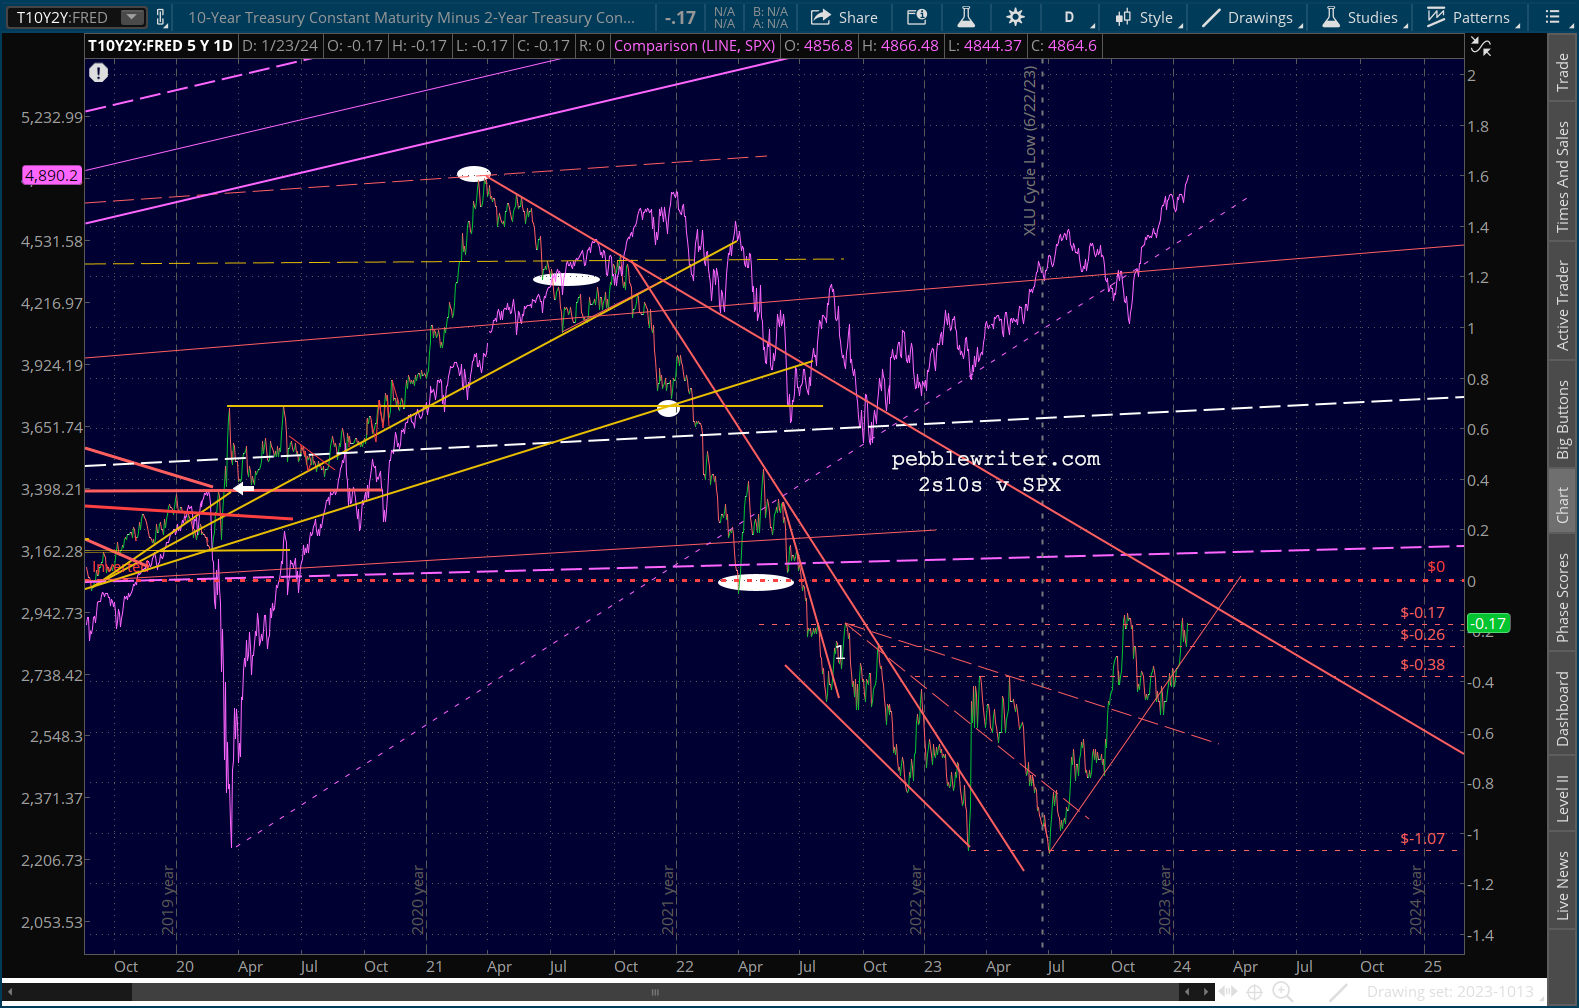
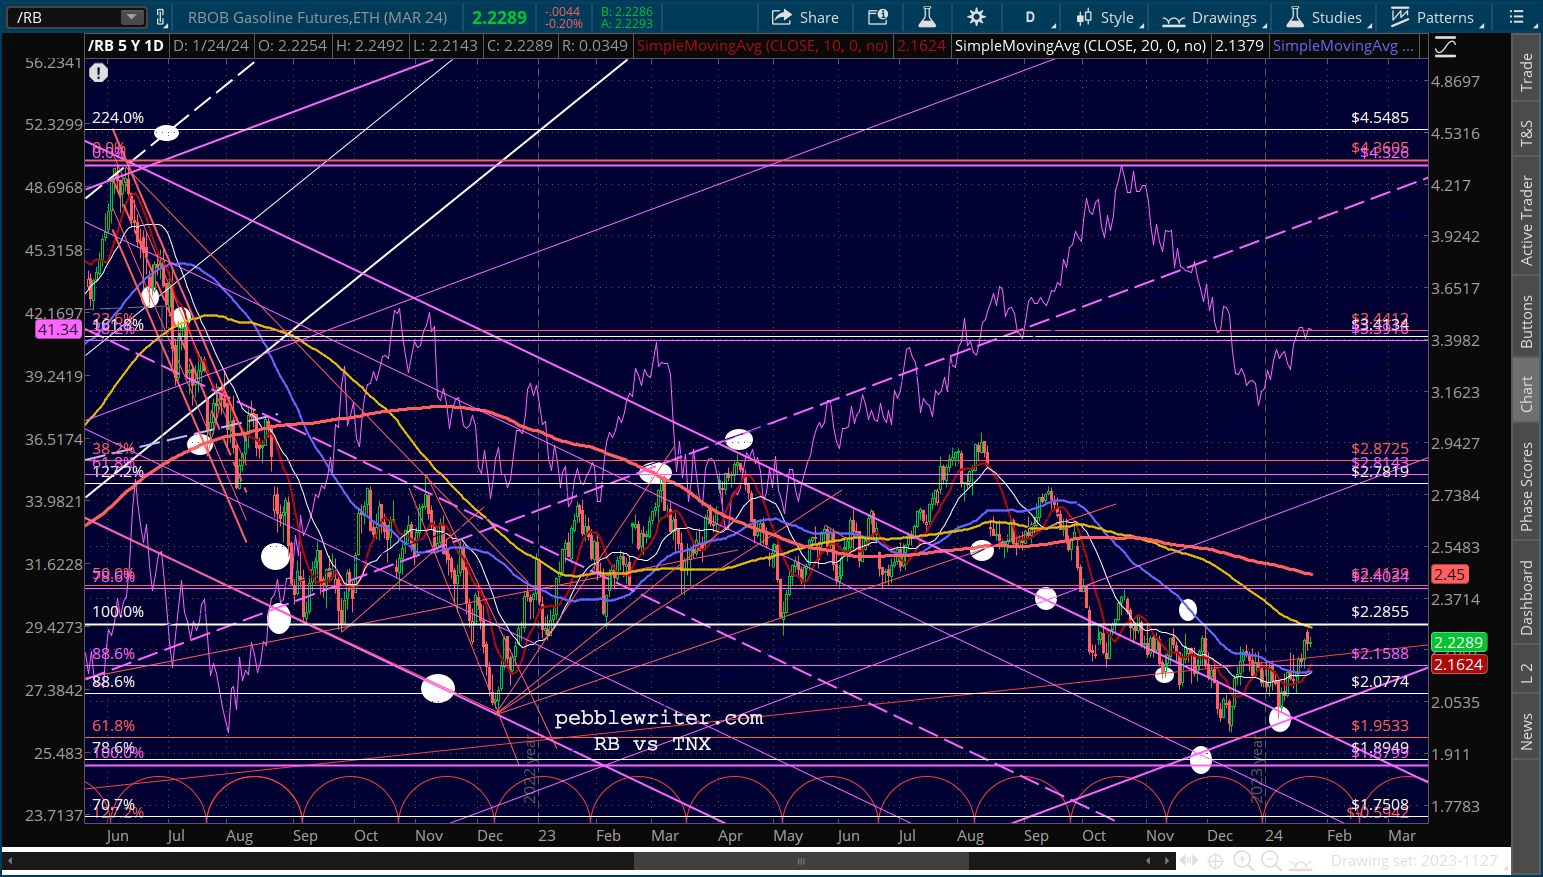 …meaning more pressure for the 10Y which has, so far, managed to hold its SMA200. There hasn’t been much talk about it, but the 10Y is a whopping 35 bps above its Dec 27 lows. It is again making noises about normalizing the 2s10s – a possibility if the 10Y pushes through 4.37.

 Now, on to the gold and silver update. I think there’s a very good argument to be made for inflation continuing to be a problem. I also believe that TPTB will do whatever they can to keep a lid on it, including suppressing oil and gas and other commodity prices as best they can.
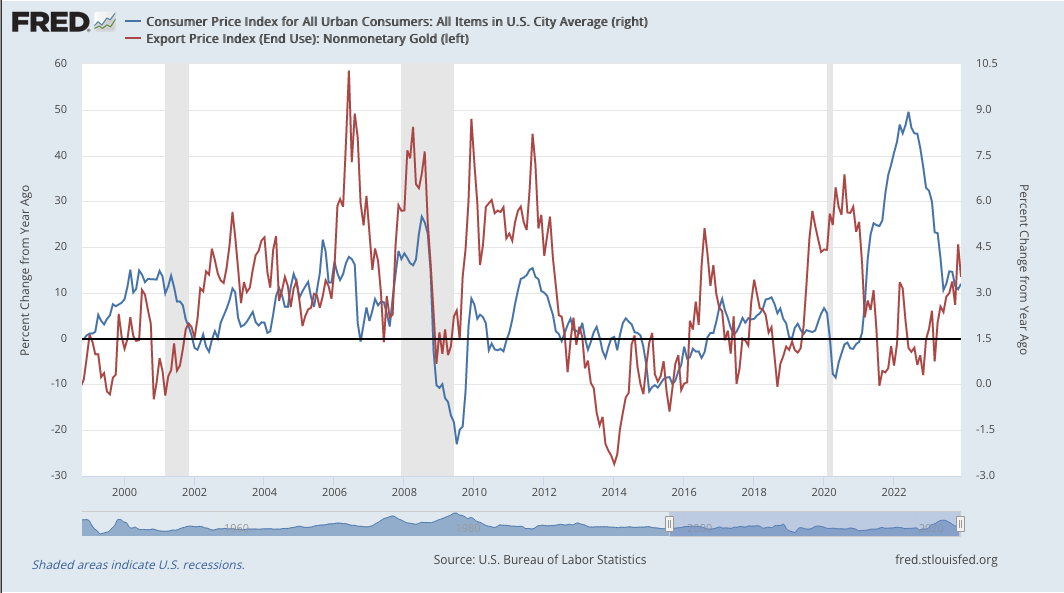
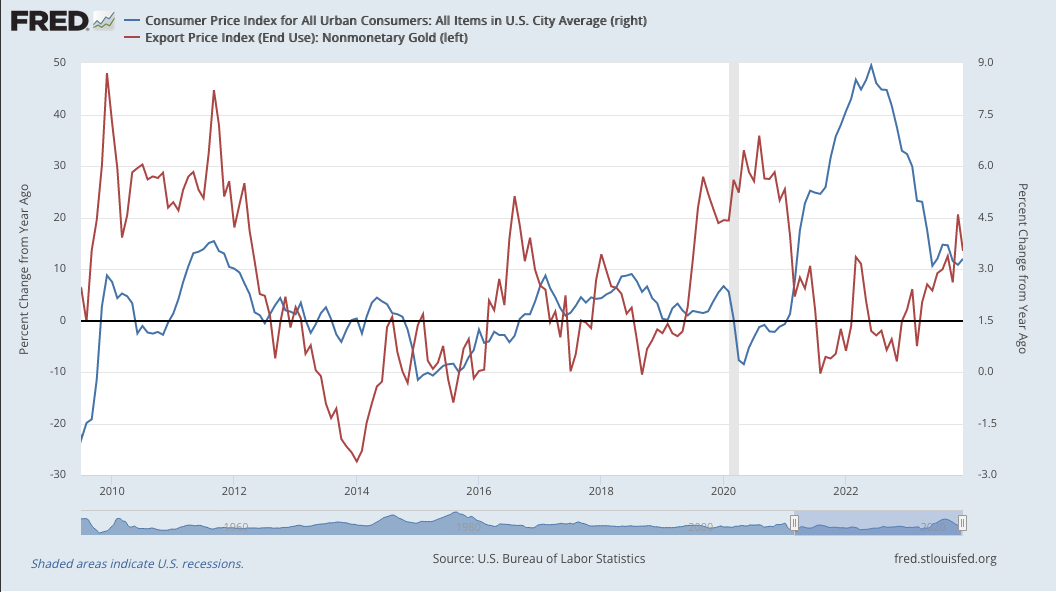
Gold and silver are interesting subjects in this conversation from two perspectives. First, they are negatively correlated with the USD, which is directly correlated with CPI [the US is a net importer and, thus, a higher USD tends to lower the price of imported goods.] Second, they have an impact on public perception about inflation.
When inflation is problematic, investors expect gold and silver prices to move higher. Therefore, lower (or at least static) gold and silver prices must mean inflation isn’t a problem.
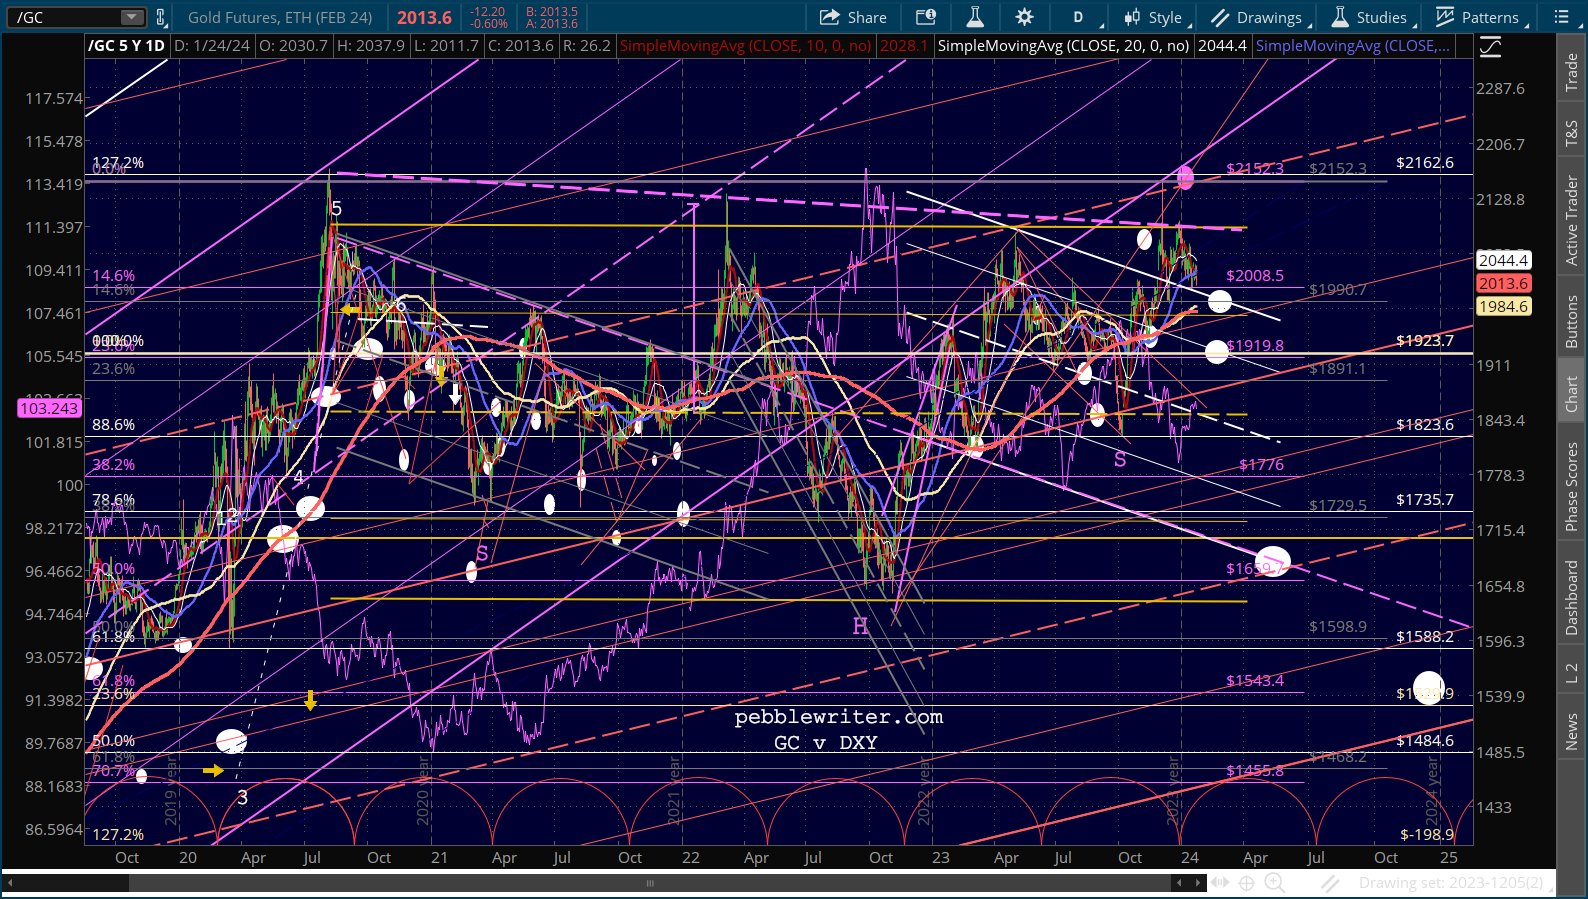
Let’s examine the charts in the context of the above precepts. As we’ve discussed many times in the past, there is likely no way in hell that TPTB would allow (if they’re able) the large IH&S pattern in GC to pay off. A 25% rally in gold would be a tacit admission that inflation is out of control.
 Note that the highest CPI levels since 1981 have resulted in very muted increases in the price of gold.

 As a result, I believe we’re destined to see a large flag pattern continue to play out, with an eventual (whenever that may be) decline to the bottom of the large red channel. My best guess based on the channels and Fibs is that it would be sometime around 1543-1588 between Jun 2025 and Feb 2026.
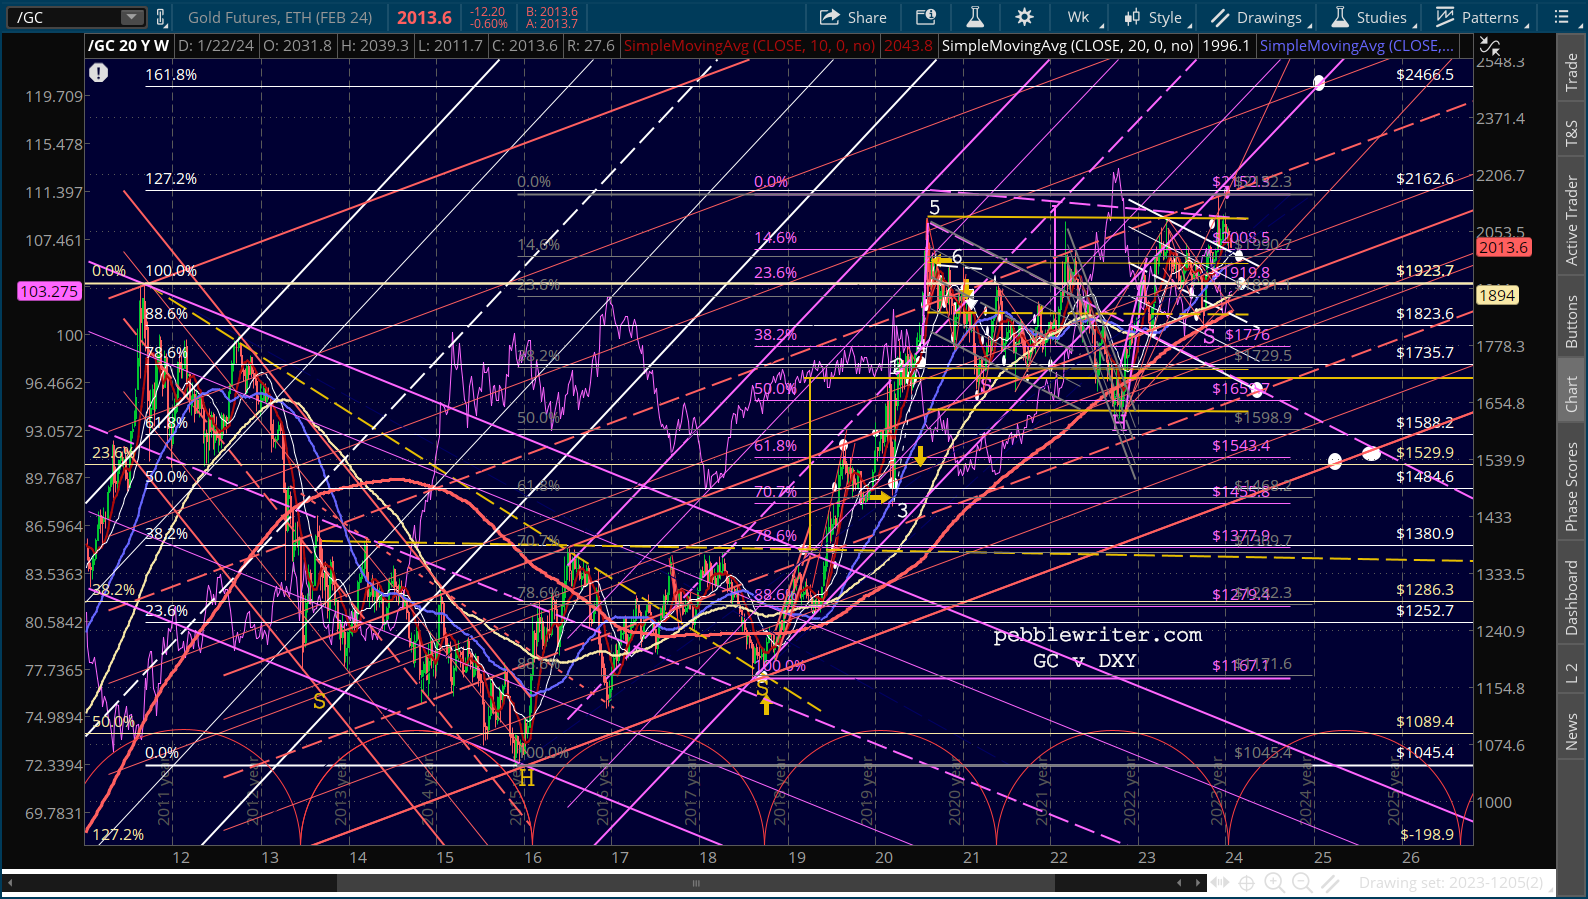 The cycles pose an interesting dilemma. While lining up nicely with previous lows, the Oct 2022 low came almost exactly where a high would normally have been. It was followed by a high when the low would normally have been. If the pattern has reversed, it suggests that the next major low would be in May-Jun 2025. If the cycle reverts to normal, it suggests major lows around Sep 2026.
If I’m wrong and for whatever reason GC takes out the 2152 highs, then we’re looking at 2466 or so (the white 1.618), potentially as soon as Aug 2024 but more likely around Jan 2025.
I don’t think I am wrong in interpreting the charts. The May and Dec 2023 highs are backtests to the broken rising purple channel and failed to make new highs or see any carry through.The next mostly likely move is to backtest the broken white channel again as the SMA200 emerges from it in Feb or Mar 2024.
But, remember, this forecast is predicated on the Fed being able to keep a lid on inflation. If a wider war breaks out in the Middle East or around Ukraine, all bets are off.
Silver’s a little easier, as it’s already broken below its SMA200, which is bearish. But, it has already backtested its broken falling white channel, which is theoretically bullish.
The larger picture is quite negative, as it shows a huge H&S pattern that would imply negative prices if/when it plays out. Note that the purple neckline crosses pretty obvious horizontal support around the white .786 at 13.82 around Jan-May 2026.
 The falling white channel originally targeted Jan 2025, but the (lame) breakout between Apr-Dec 2023 ruined that channel and a replacement is not yet evident. The purple IH&S pattern which completed but went nowhere targets 36ish, but SI would have to top at least 25 for that to happen. Again, that 15% rise from current prices is unlikely at this time, but if the we tangle directly with Iran, oil goes to 120, and CPI goes to 12%, things would change in a jiffy.
 Therefore, despite the bearish outlook, I would avoid shorting GC and SI. Life is too short and there are enough things to worry about without the prospect of a broader military conflict smashing the value of your portfolio.
The market just closed, and I see that this morning’s ramp completely unwound. SPX closed back below the 2.24 Fib extension at 4883. No idea whether it will follow through, but score one for the bears. Looking at EURUSD, DXY, etc, tt’s exactly what we discussed this morning and would suggest a 5% drop to 4600ish.
GLTA…