

As noted yesterday, gold and silver reached our target ranges from mid-October. GC came up slightly short of its target from Oct 18 [see: Mideast Worries Mount]…
 …before being aggressively hammered.
 Silver nailed its target very precisely before meeting a similar fate.
  We’re faced with the usual questions after targets are reached: Was that it? Is it over? What’s next?
continued for members…
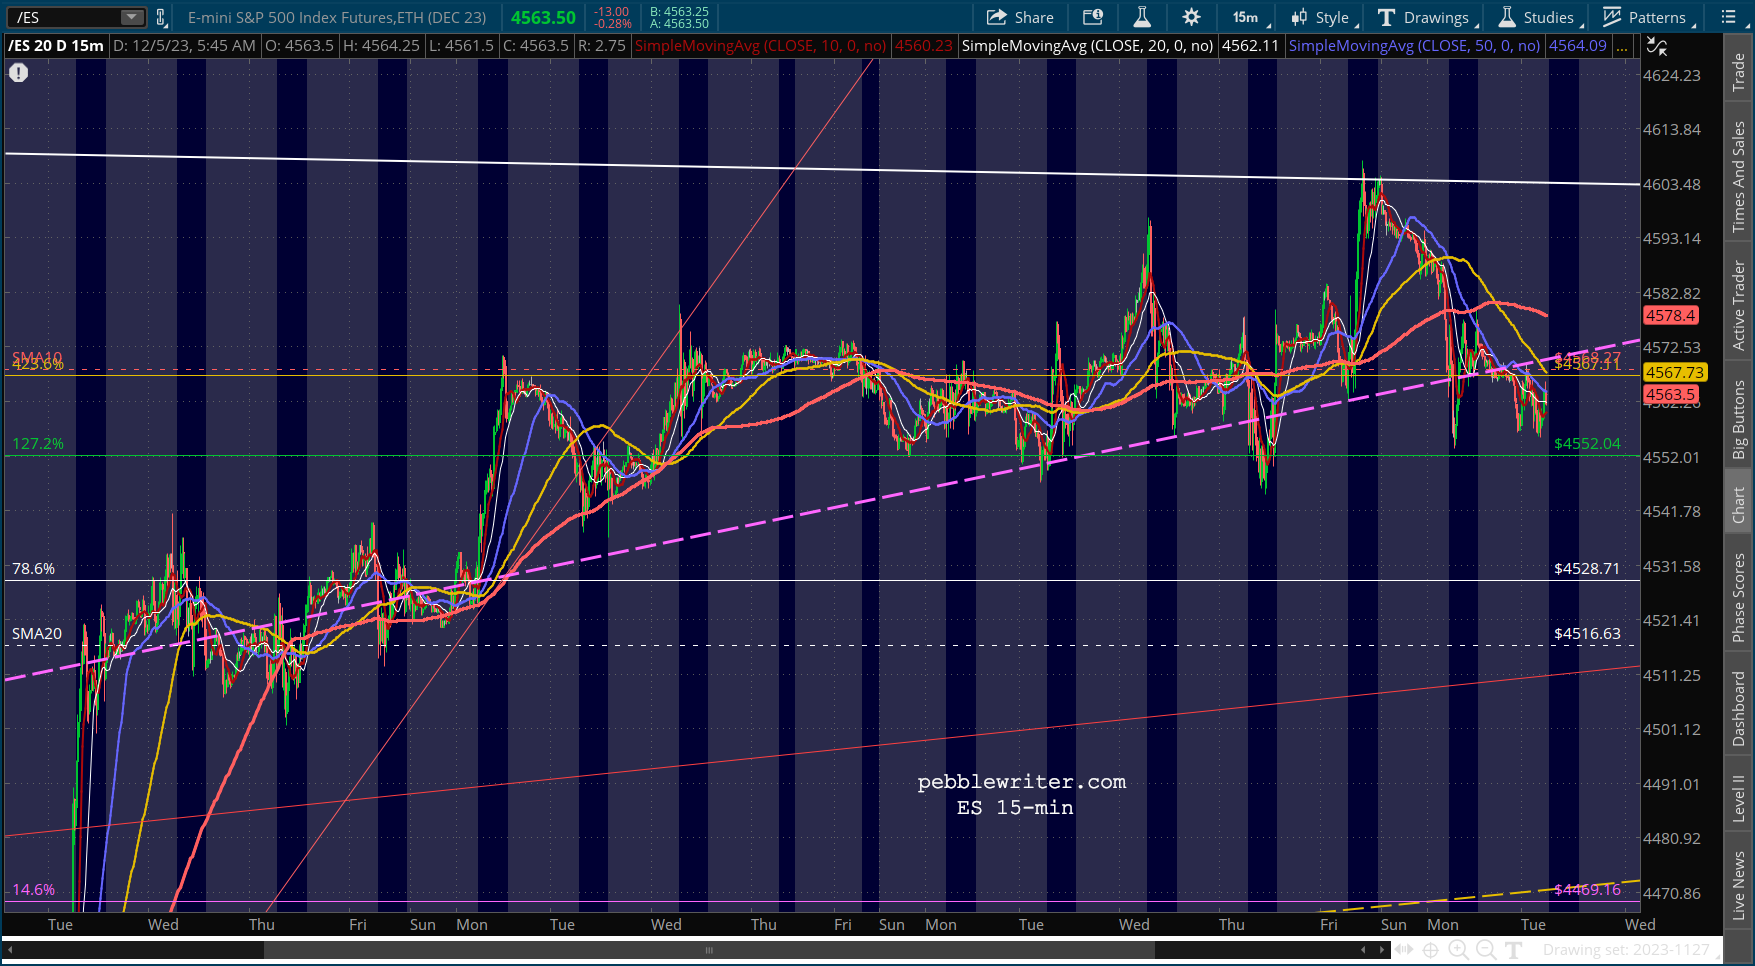
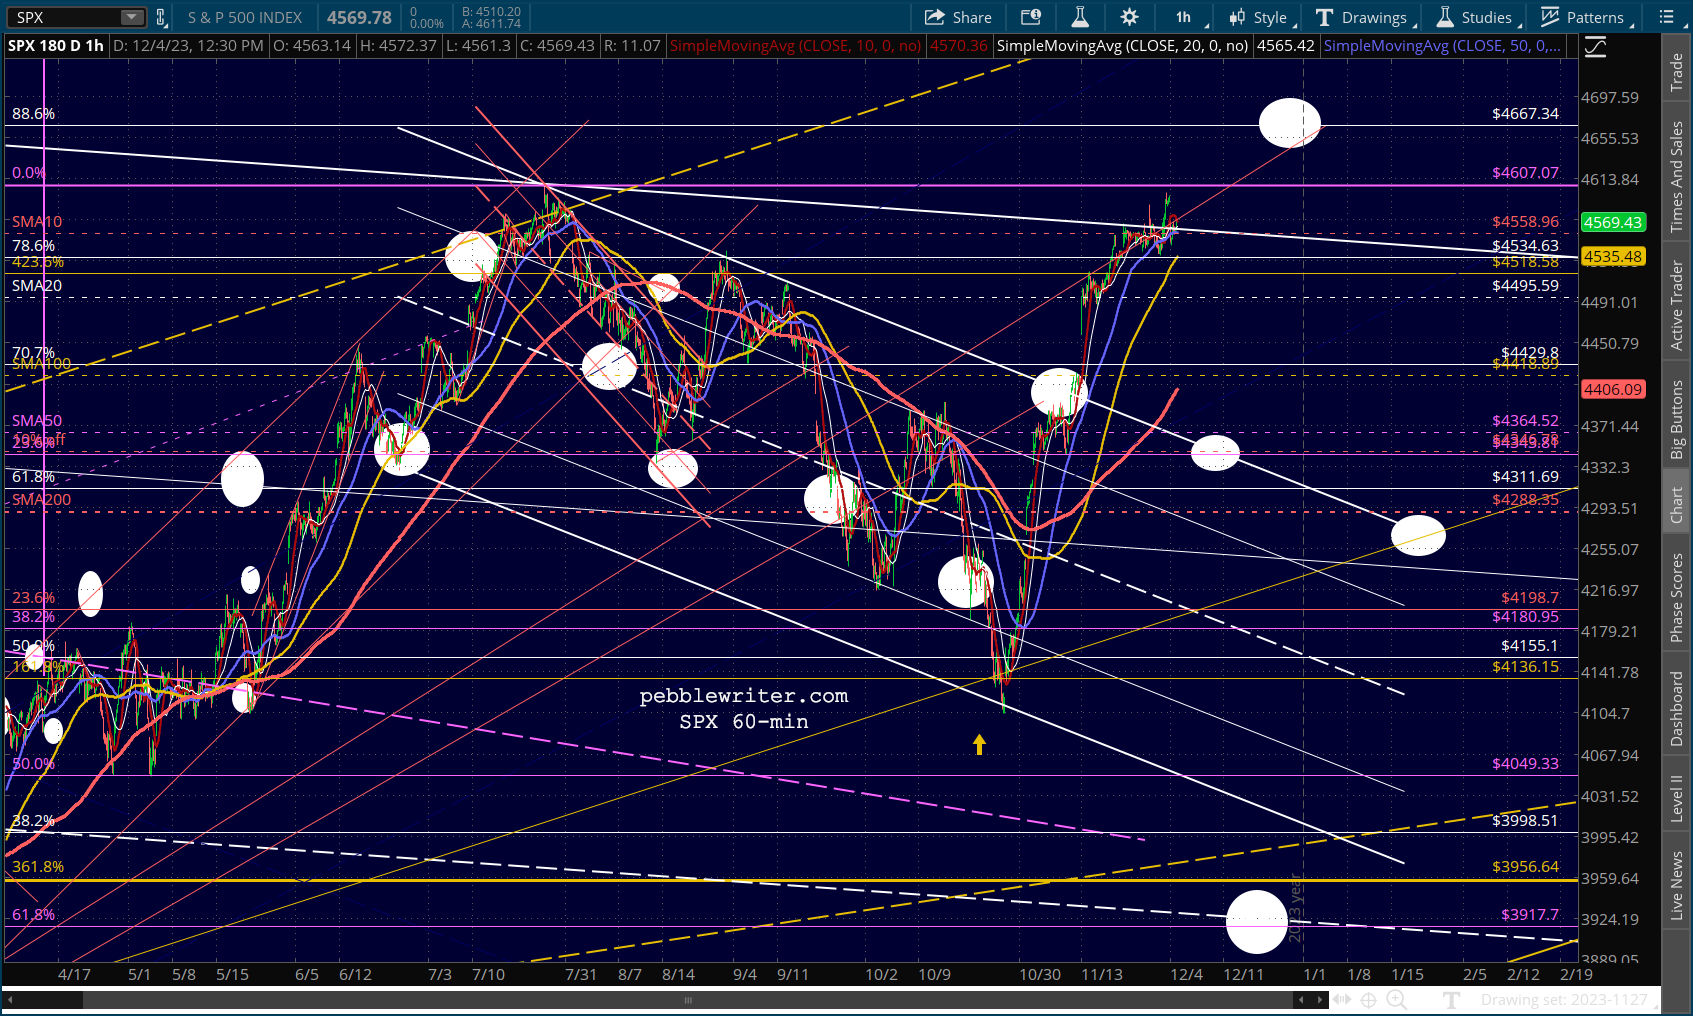
First, a rundown on overall markets. Futures are off again this morning, though we’ve not seen much in the way of a serious breakdown just yet.
Both SPX and ES are still hovering around their SMA10s.
 As discussed yesterday, VIX gapped higher, only to settle back down as the day progressed – thereby ensuring that SPX closed above its SMA10.
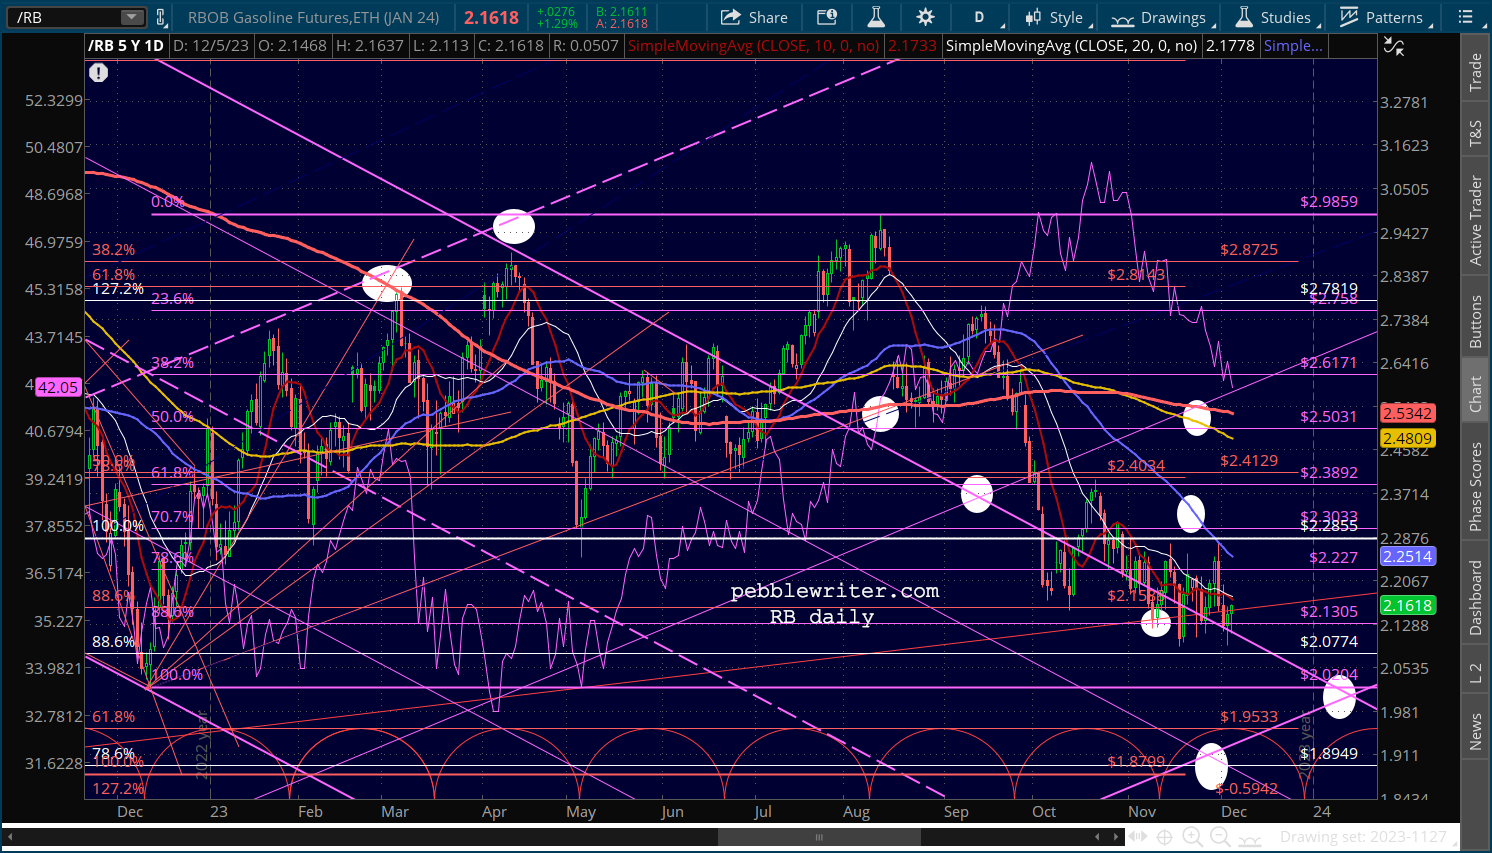
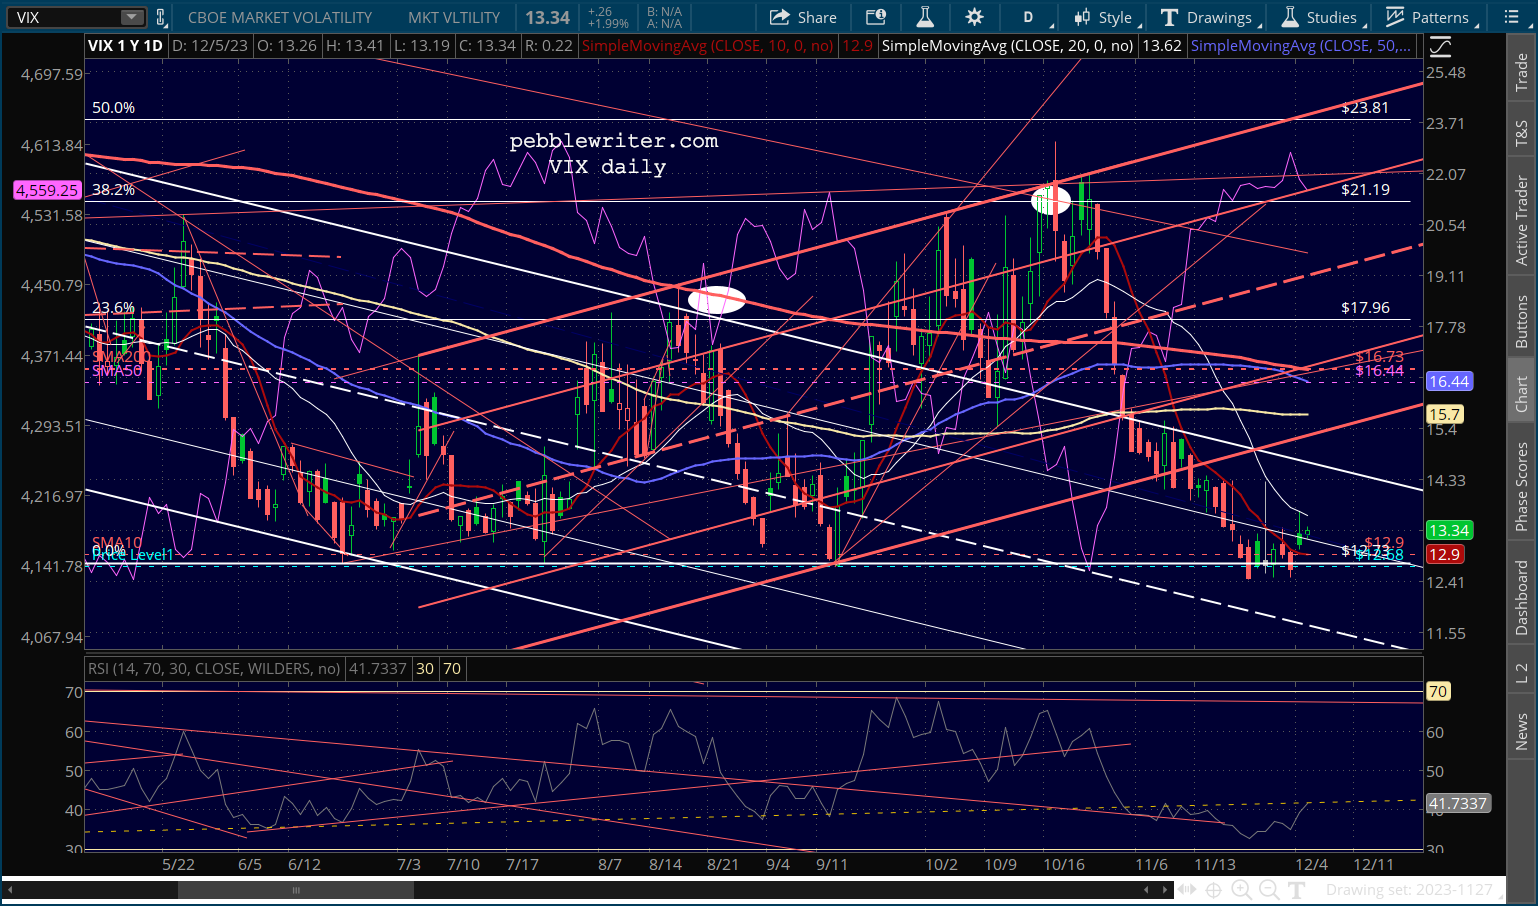 CL and RB are both getting a bit of a bounce this morning…
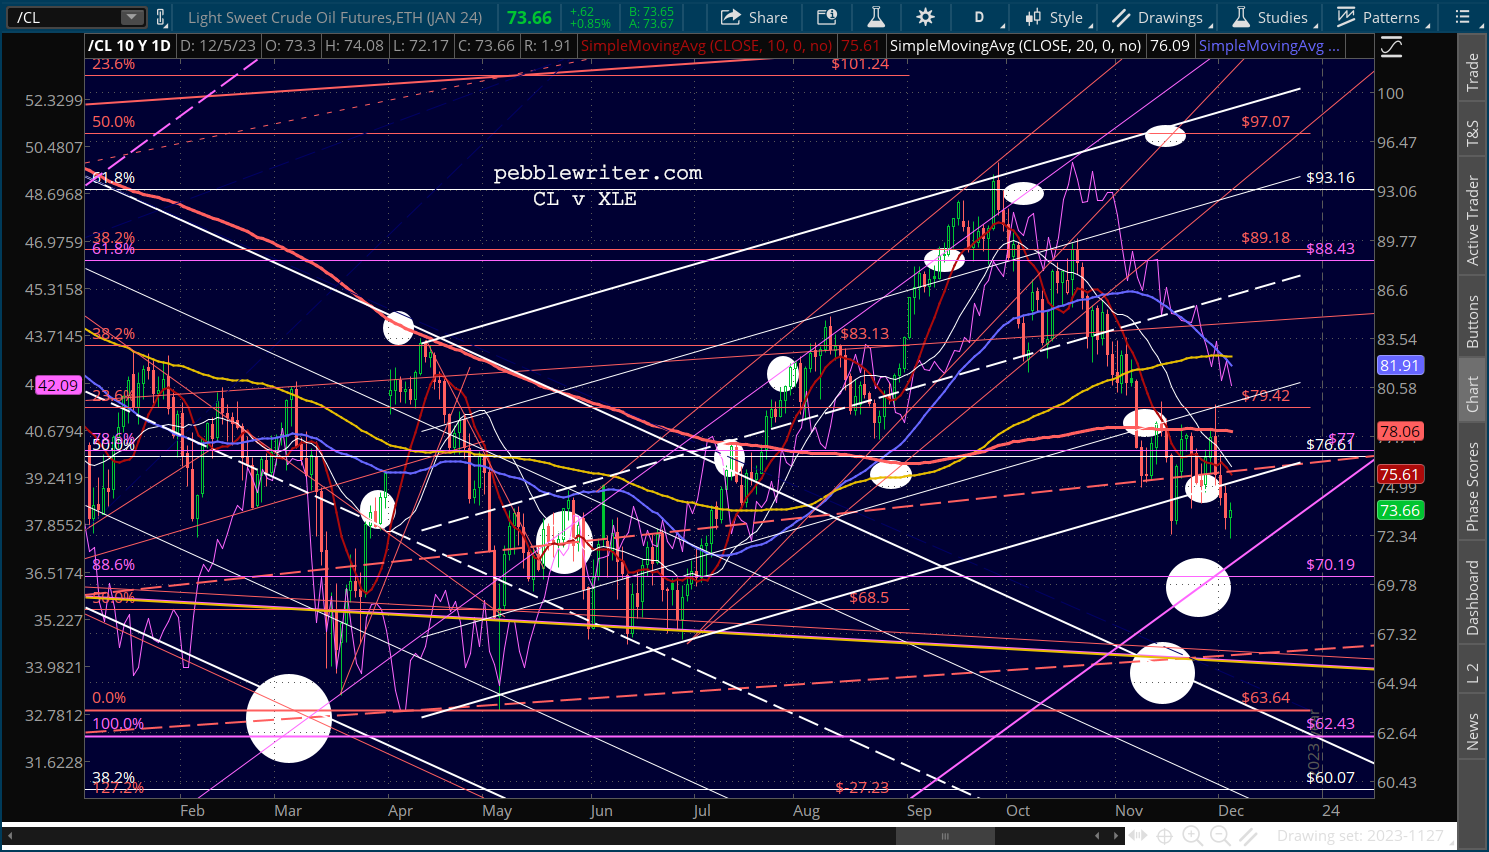
 …with the 10Y slipping slightly lower to test the TL from Dec 2021.
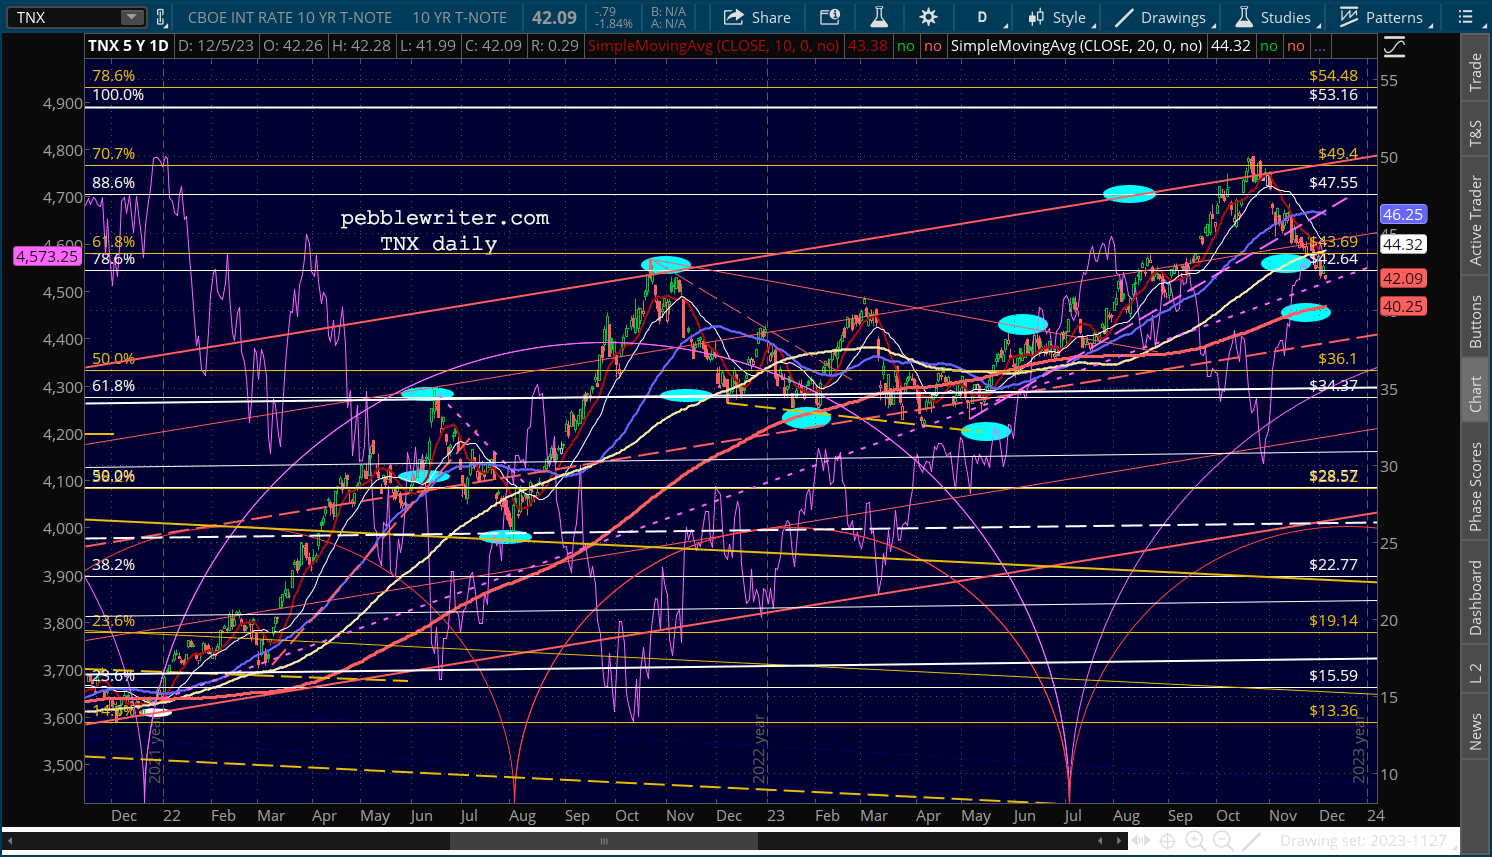
 EURUSD appears headed south of its SMA200 – a negative for stocks.
 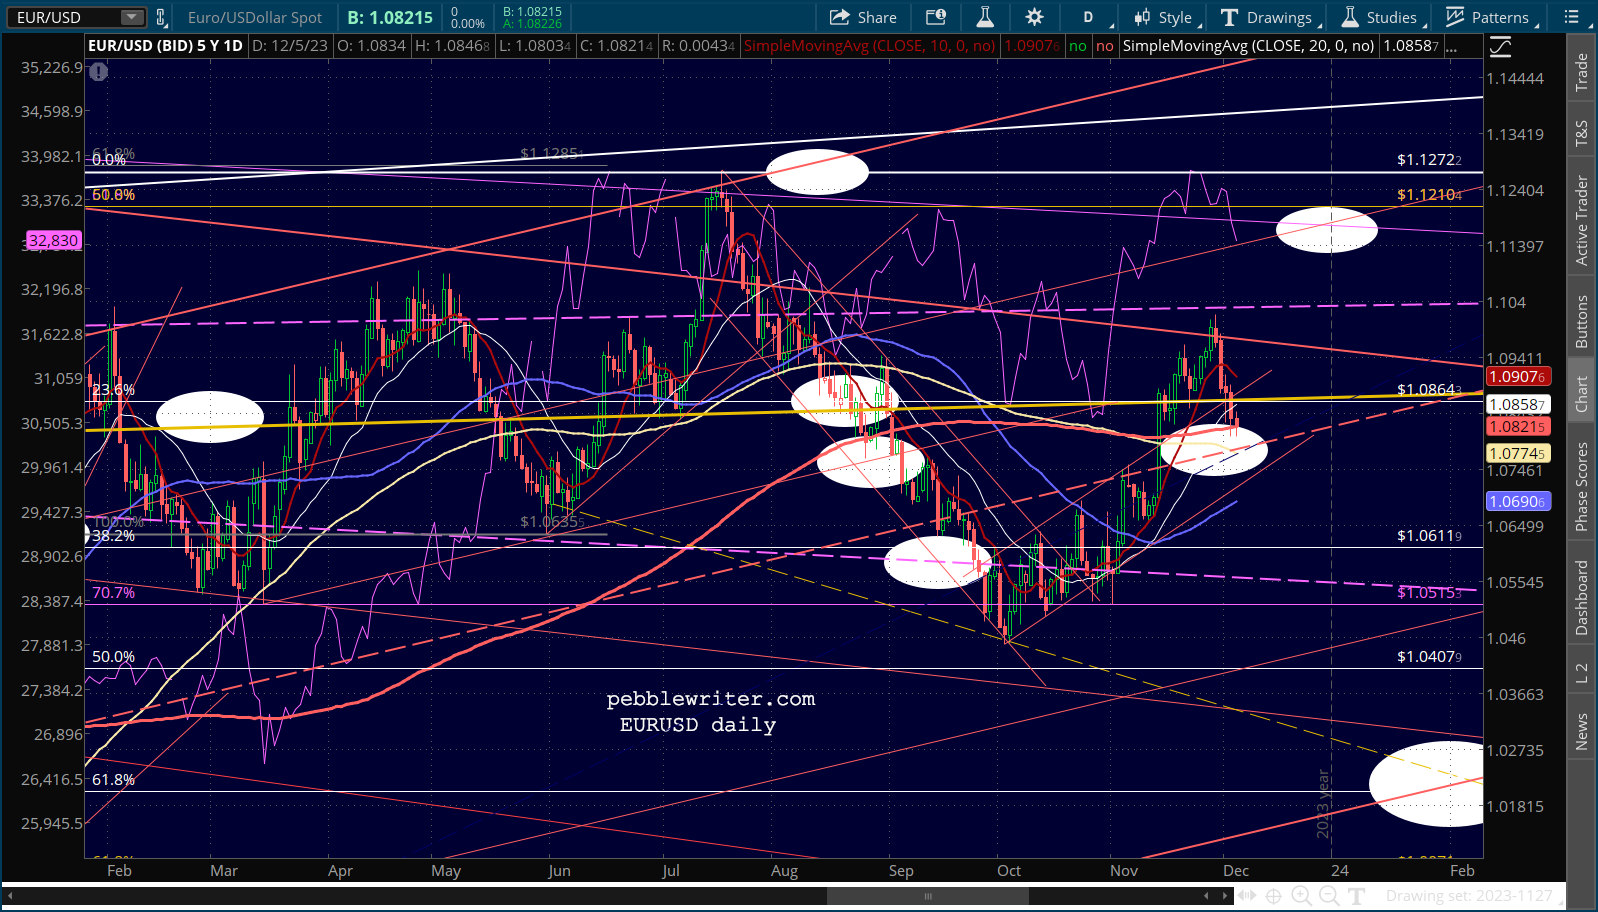 While USDJPY is hanging on to a TL from March with its SMA200 just below at 142.19.
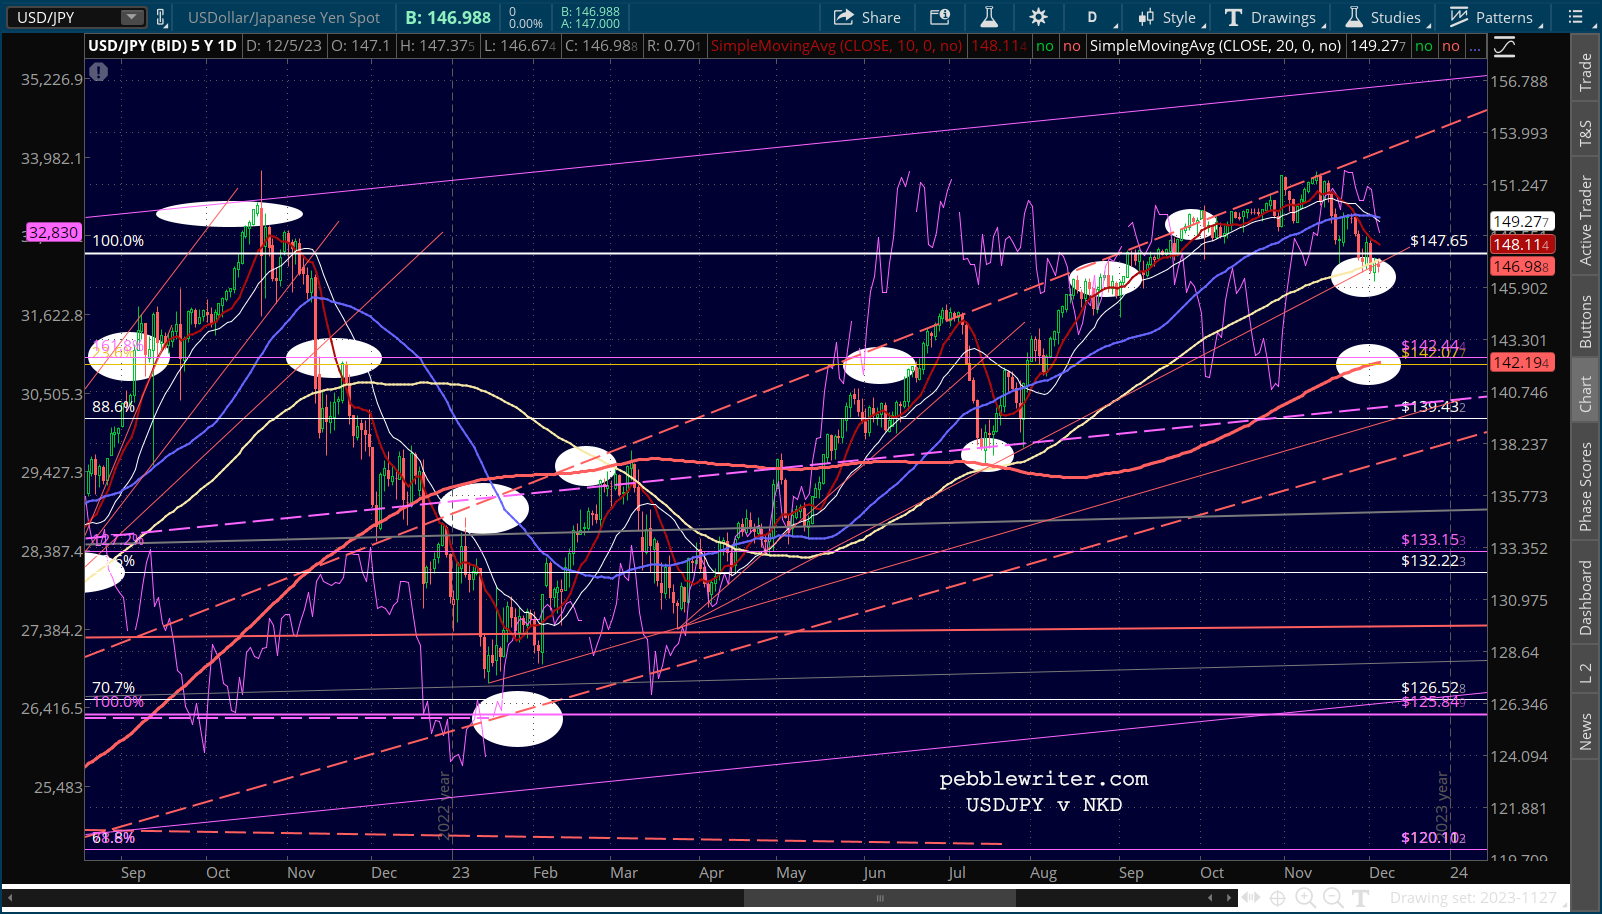 The net USD strength is nudging the DXY back above its SMA200, a net negative for stocks and for gold and silver.
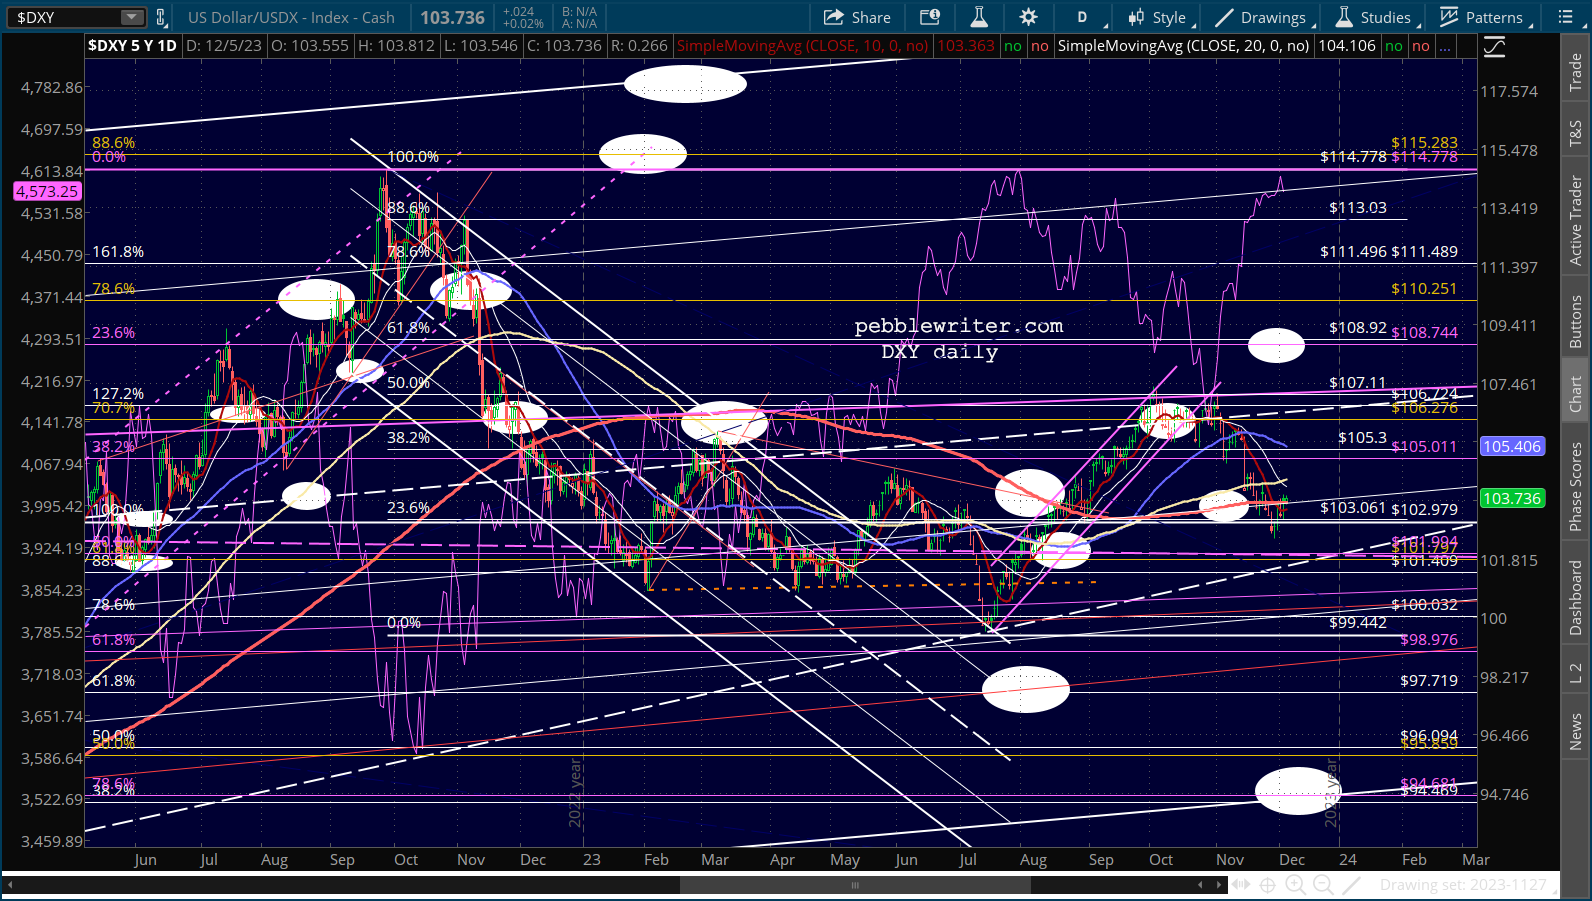 When it comes to gold and silver, there’s a legitimate case to be made for higher prices due to global uncertainty and high inflation alone. Yet, it took quite some time for the effects of those inputs to be felt. And, the impact was and has been underwhelming.
Both are only now back to the vicinity of their post-Ukraine invasion prices – arguably equating the geopolitical risk of the Israel-Hamas war with the Russia-Ukraine war. And CPI is well below the June 2022 highs, at which time both GC and SI were plumbing new 2-year lows.
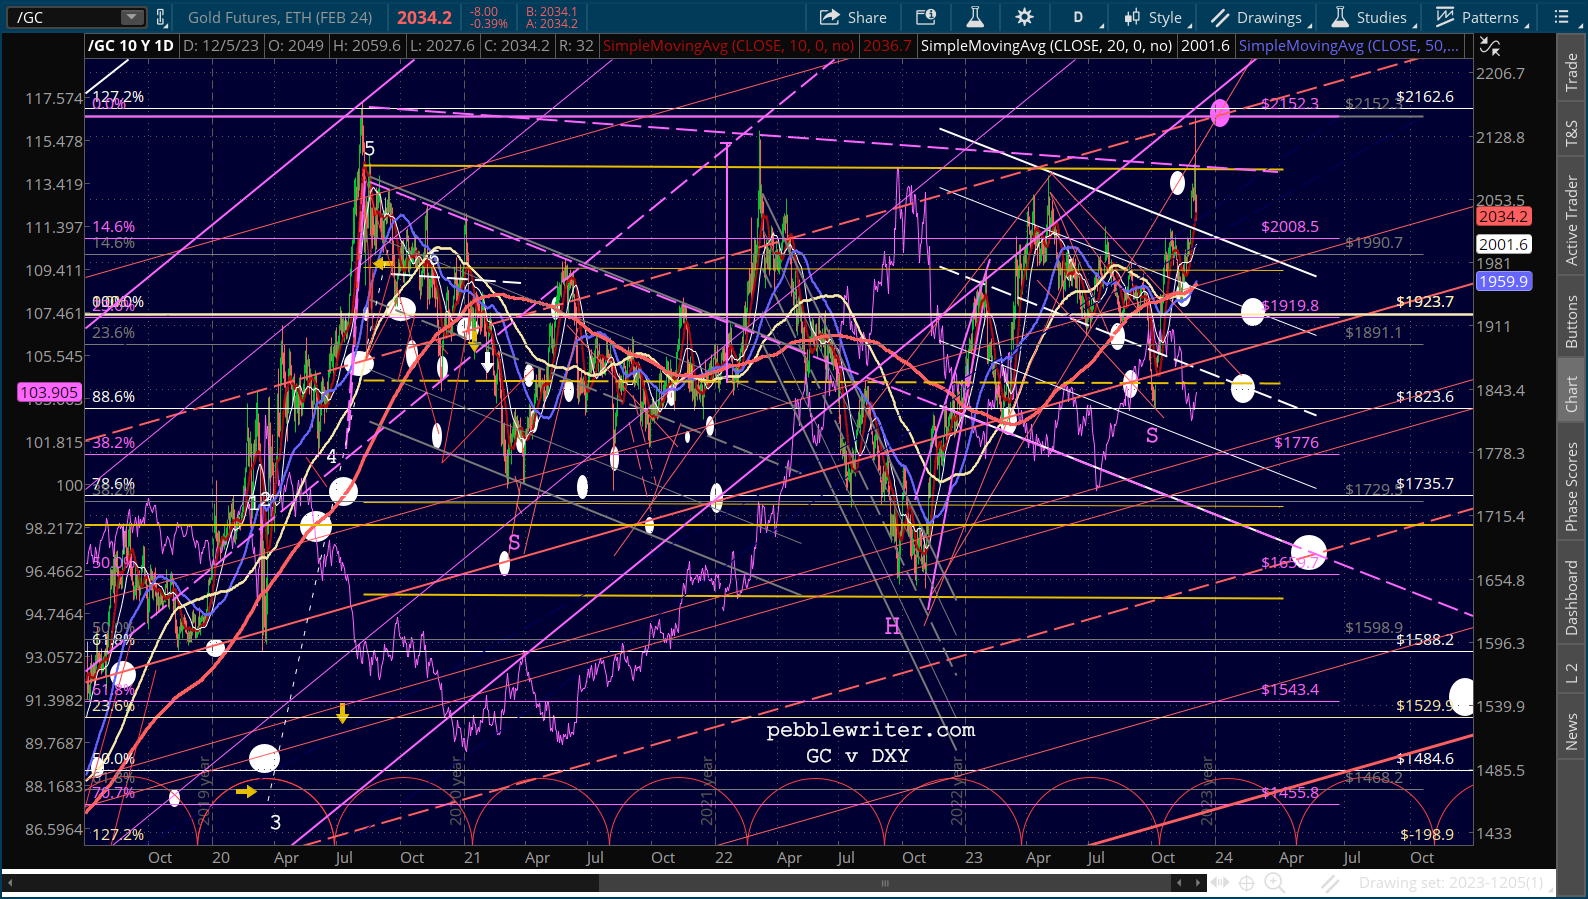
So, we’re left with the impact of a fluctuating DXY as a primary driver – with a close corollary being the importance to central banks of maintaining the primacy of fiat currency. We can see from the weekly GC chart that it has moved reliably counter to DXY’s moves.
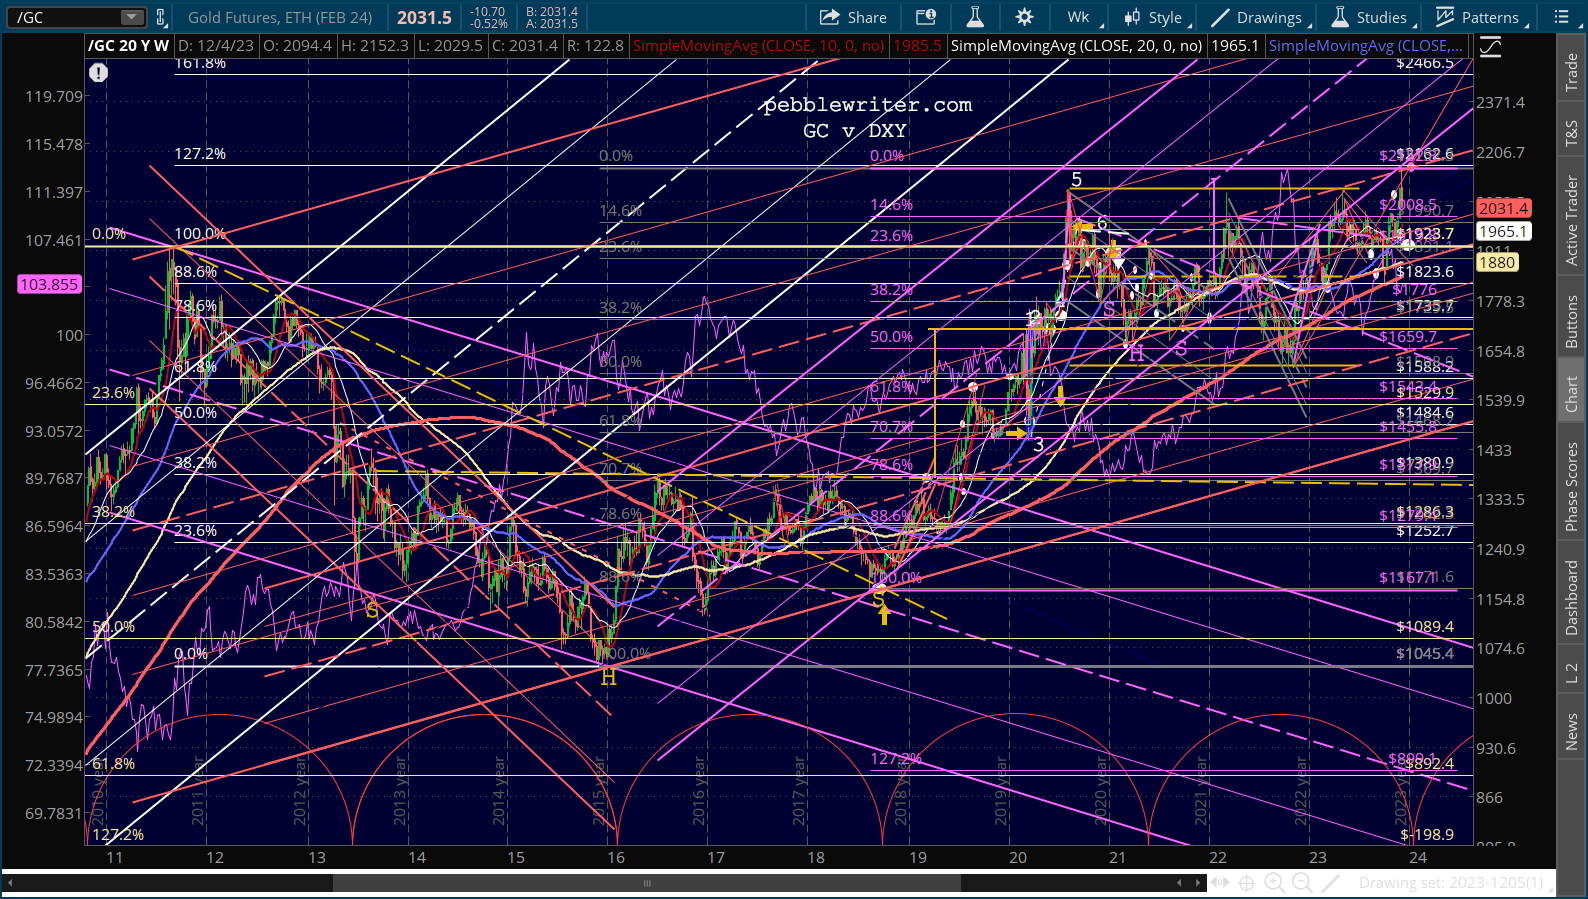 We can also see that it has spent long periods with a lid on prices – notably the period from 2013-2019 when it was hard pressed to top 1380, and most recently with recent highs being tested four times since August 2020.
The most recent test of the Aug 2020 highs backtested the broken purple channel (an echo of the rising white channel which broke down in Sep 2014.) A closeup shows that the pattern since Aug 2020 has constituted a very flat flag pattern (in yellow.)
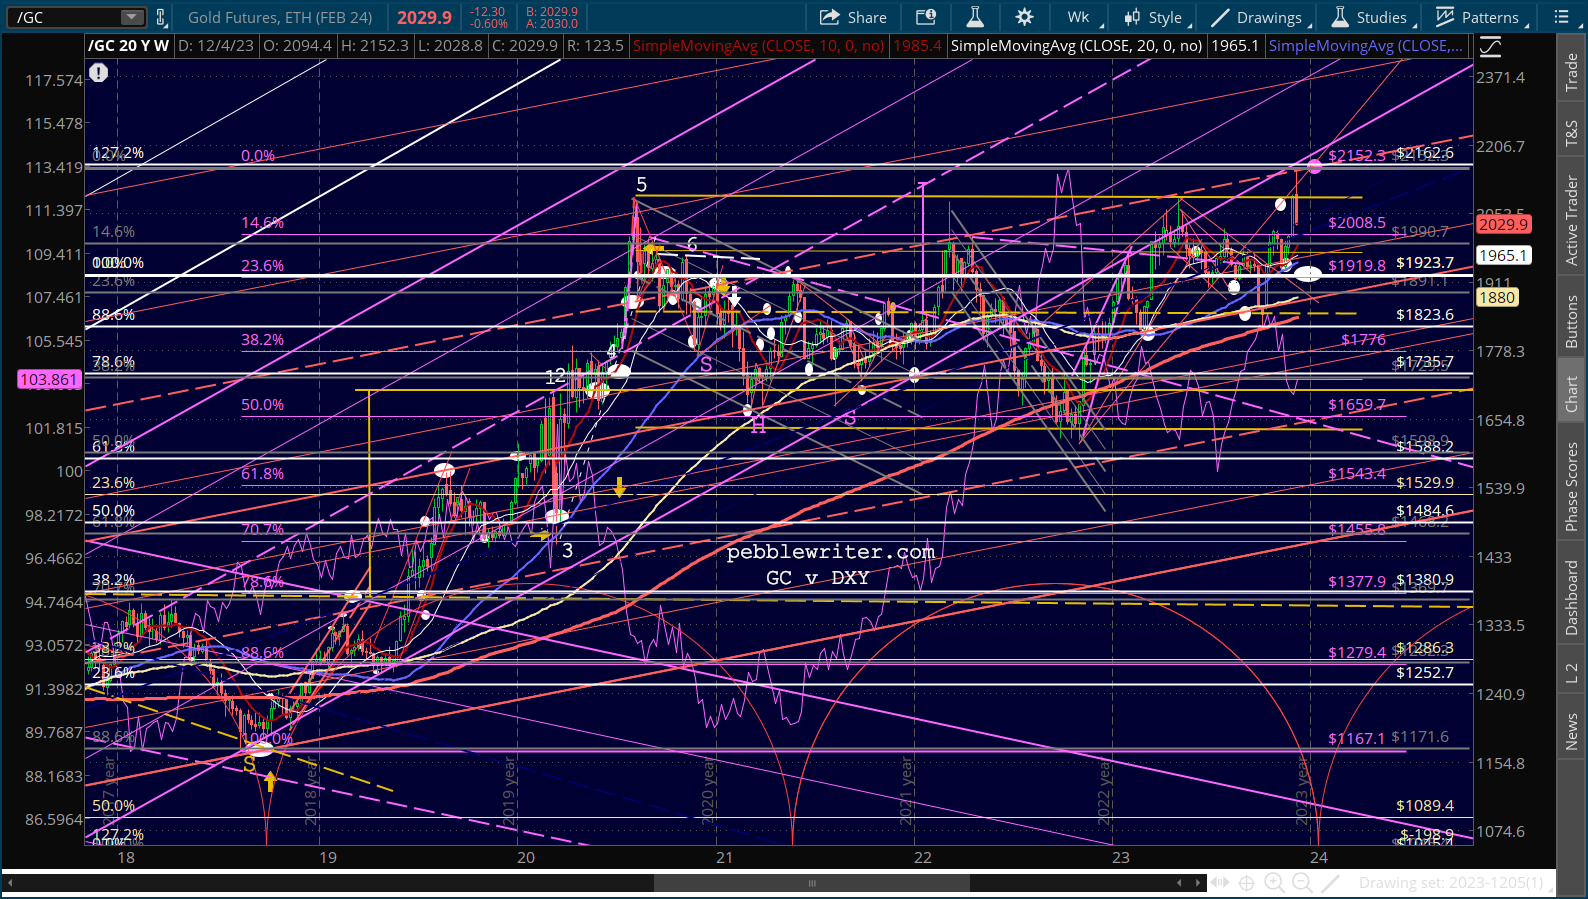 But, it also constitutes an inverted H&S pattern that would target 2550 (below, in purple.) If GC can hold 2090, the IH&S is in play. Otherwise, our base case remains that GC will remain under pressure. Downside targets include the SMA200 at 1953, the yellow flag midline at around 1846, a channel intersection at 1678, and the purple .618 where it intersects the red channel bottom at 1543.
 This is obviously a forecast which would suggest inflation is dead and global conflicts subside – an iffy outlook, to say the least. But, it also reflects what I believe will be a growing urgency on the part of central banks to minimize the flow of funds out of paper currencies (which are more easily tracked and taxed.)
The pressure applied to SI when it tested 1980 levels in 2011 was significant and systematic. The falling purple channel lasted for five years and saw SI drop by over 70%. 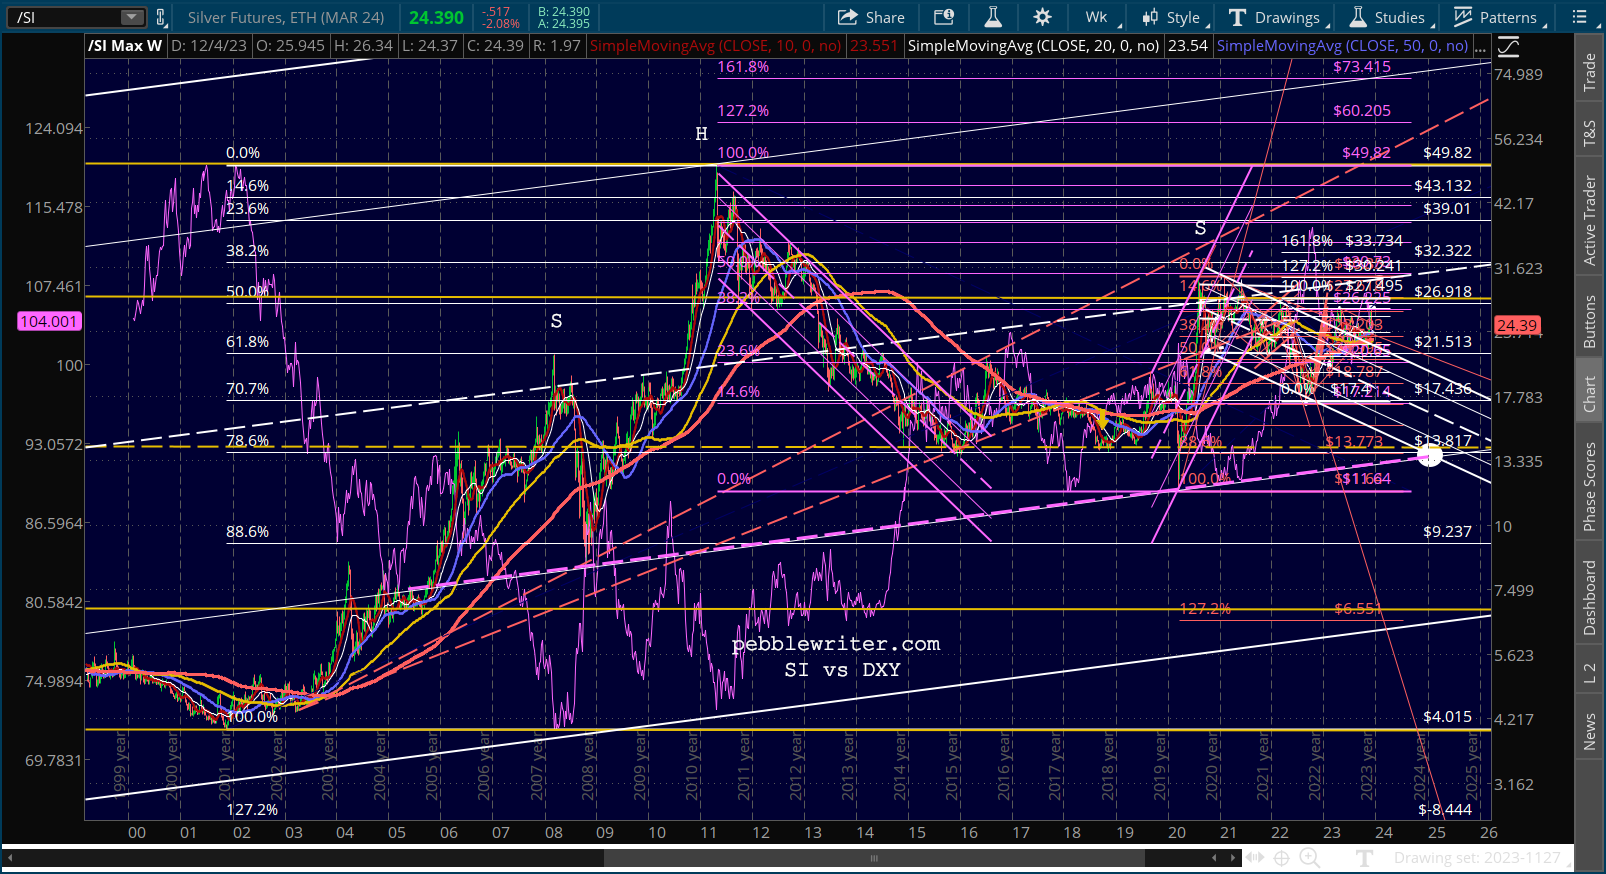 When it finally played out in 2016, SI was held below 20 for over four years until Aug 2020 when it ran into resistance at 30 – a hurdle which remains to this day.
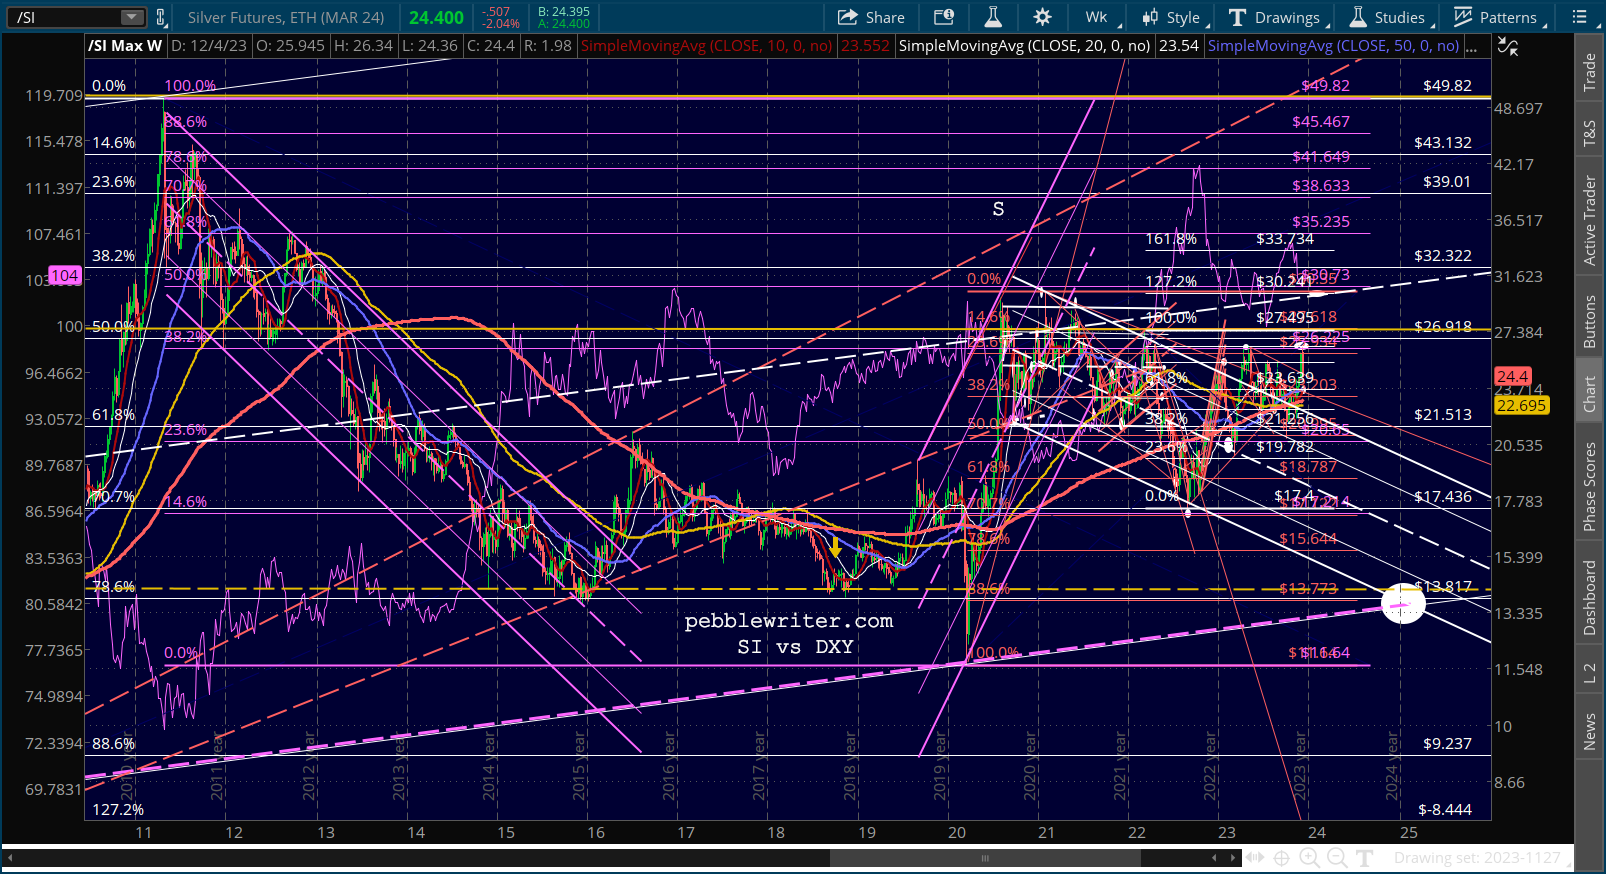 The decline from the Aug 2020 highs was also quite systematic – smacking of a coordinated take down.
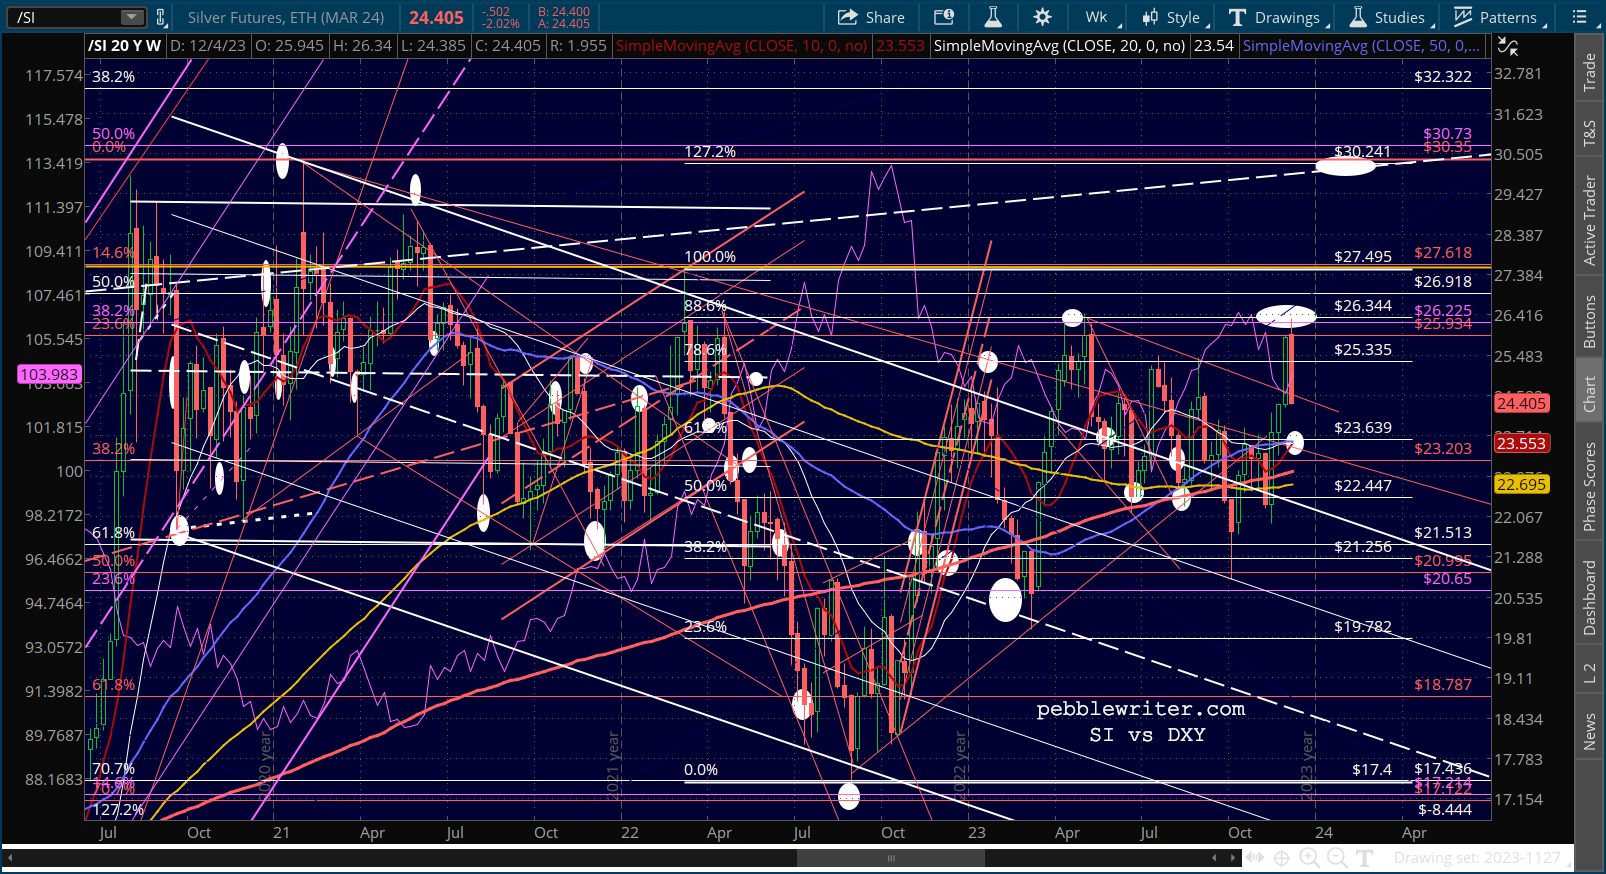 Like GC, SI completed an inverted H&S pattern yesterday, with a neckline at 25.80ish and a target of 35.28. This means it would have to push above and hold 25.80 in order to play out. Otherwise, it is very likely to backtest the SMA200 and, should that fail to hold, channel/TL backtest at 22. If it drops back into the falling white channel, we’ll reassess the downside.
 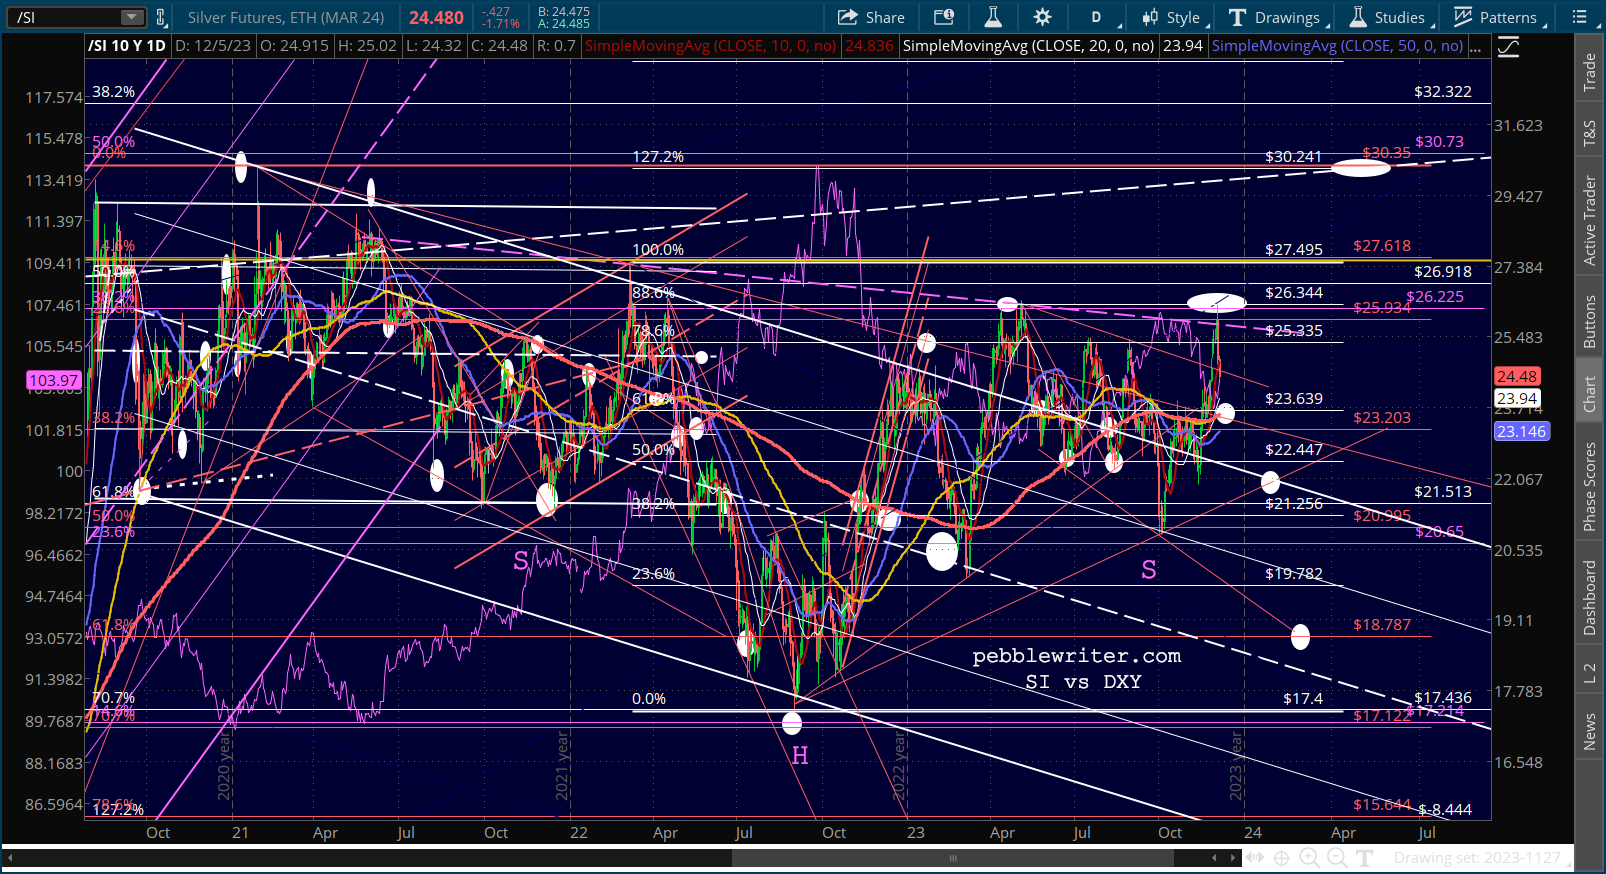 Stay tuned…