

EURUSD and DXY have officially tagged the targets we set for them several months ago. Recall that in the Mar 7 Update on Currencies, we noted that the Ukraine invasion could accelerate DXY’s next leg up.
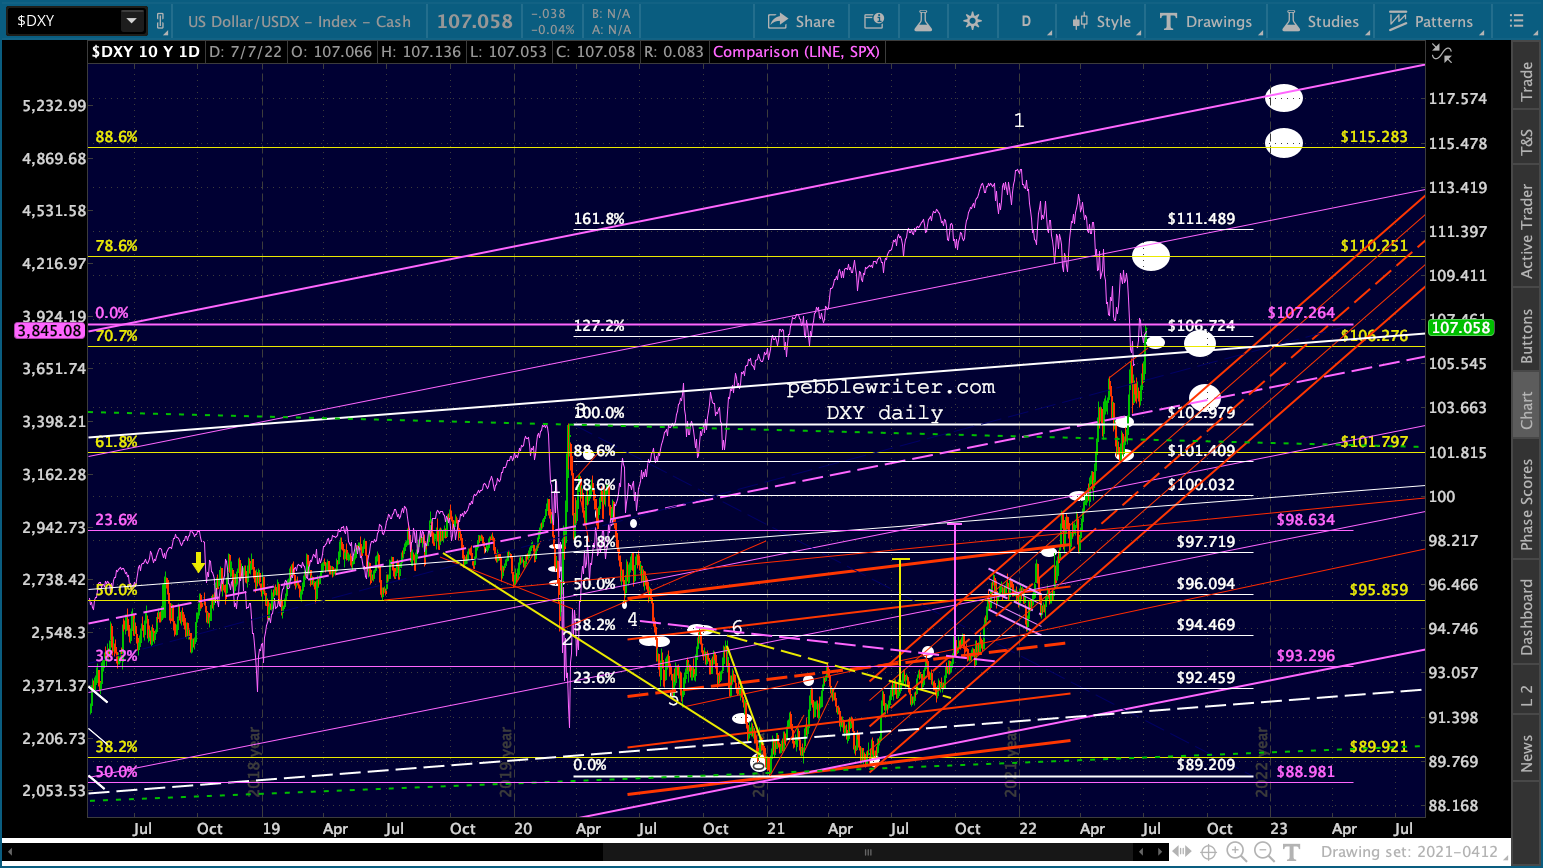
The yellow .707 at 106.276 and white 1.272 at 106.741 both intersect the white channel top in late 2022 – but it seems unlikely that DXY would wait that long to make its move given the fluidity of the Ukraine invasion.

We noted in April that DXY had broken out of its rising red channel and, based on our analog, was likely to reach the target in July – which is exactly what it did.
 The move was made possible, of course, by EURUSD crashing as we expected. From that same post:
There are many potential targets between here and the H&S target of .785. The first is the 1.06 lows from 2020, followed by the 1.03 lows from 2016. Once those break down, of course, the euro will face the 1.000 support, also the yellow .618, possibly as early as mid-March.

The ECB fought the breakdown as long as it could. With inflation and fragmentation both surging, the current plunge has caught many off guard. Then there’s the hapless BoJ, sitting quietly in the corner hoping that no one notices just how fundamentally broken it is. We’ll update all the big picture charts today, focusing on their connection to the plunge in equities over the next two weeks.
continued for members…We’ll start with EURUSD. The monthly picture says a lot. From a Fibonacci standpoint, this .618 tag has been a long time coming. It’s the 5th time since 2015 that EURUSD approached 1.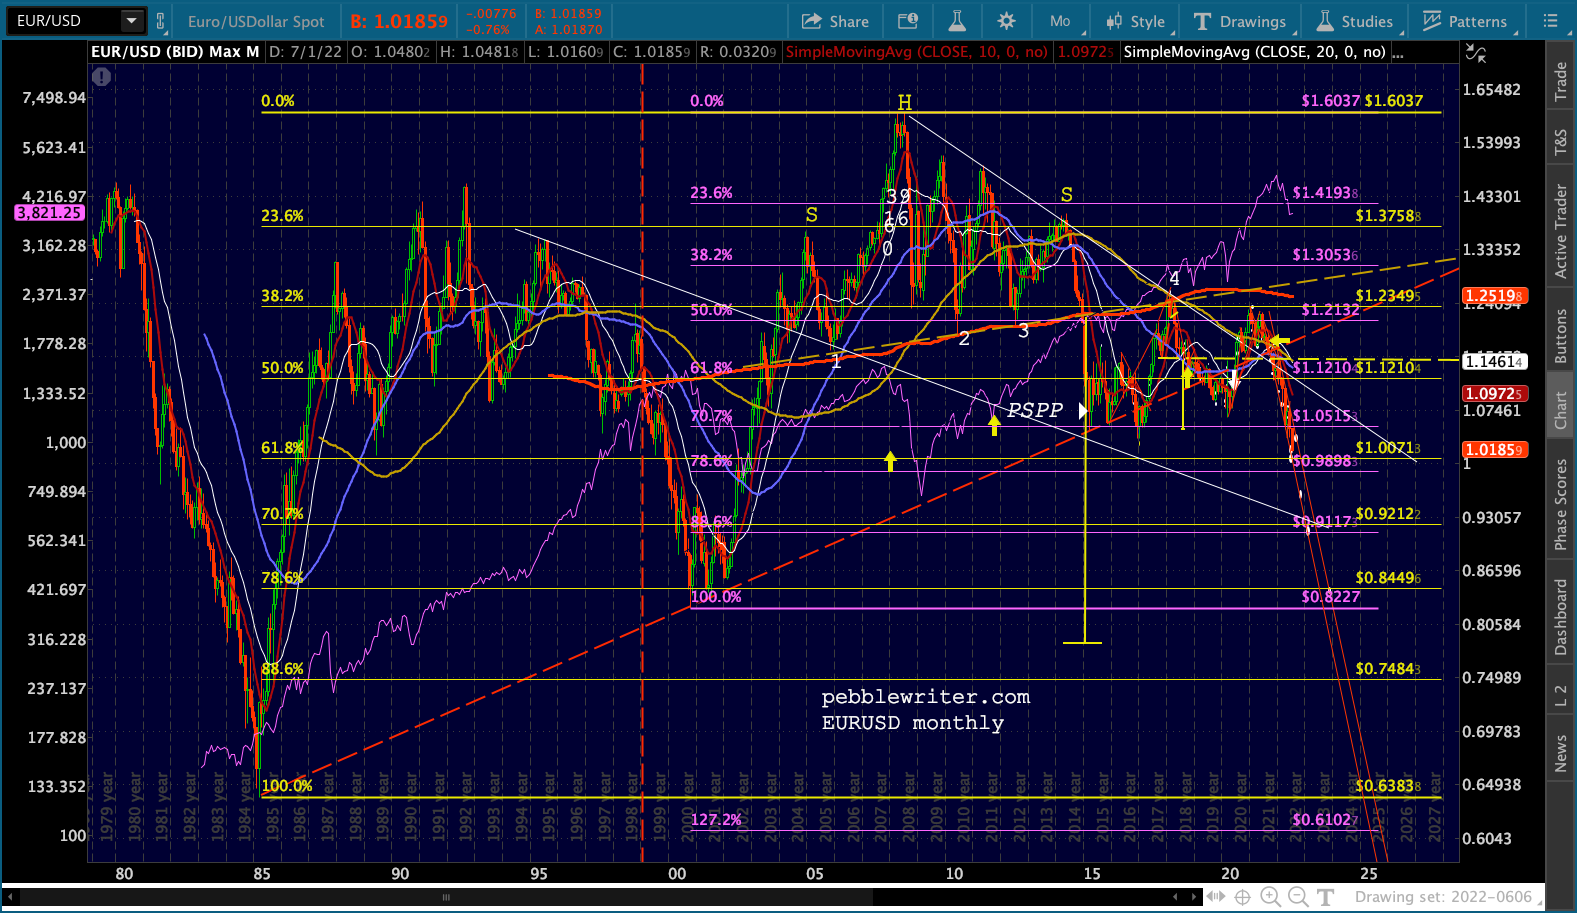 2015 was a pivotal year for EURUSD. Following Mario Draghi’s “whatever it takes” speech in July 2012 (point 3 on the chart above) the EURUSD made its second hard bounce in a row off the 200-month moving average.
The ECB is ready to do whatever it takes to preserve the euro. And, believe me, it will be enough.
It wasn’t enough. They got a nice bounce that lasted almost 2 1/2 years until December 2014, when EURUSD plunged through the 200-month MA and completed a long-simmering H&S Pattern.
It’s no coincidence that the PSPP was announced when EURUSD approached the dashed red trend line connecting the two previous lows and the yellow .618 Fib. The euro went sideways for 1 1/2 years, eventually dropping through the trend line and reaching 1.034 before bouncing up to backtest the H&S neckline at 1.2554 in Jan 2018.
Since then, it’s put in 3 waves lower, with the latest exceeding a simple C=A extension in an apparent bid to finally reach the .618 at 1.0071. Why? How? And, most importantly, what then?
It might be tempting to believe that, with inflation just as high in the euro zone as in the US…
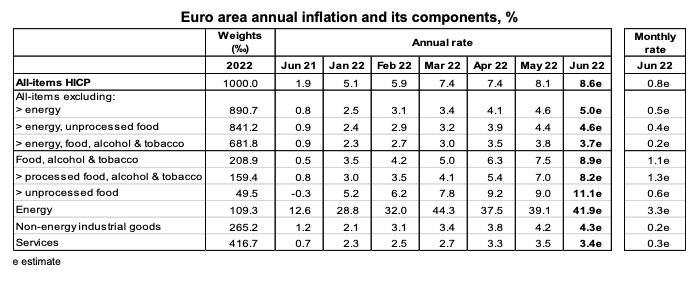
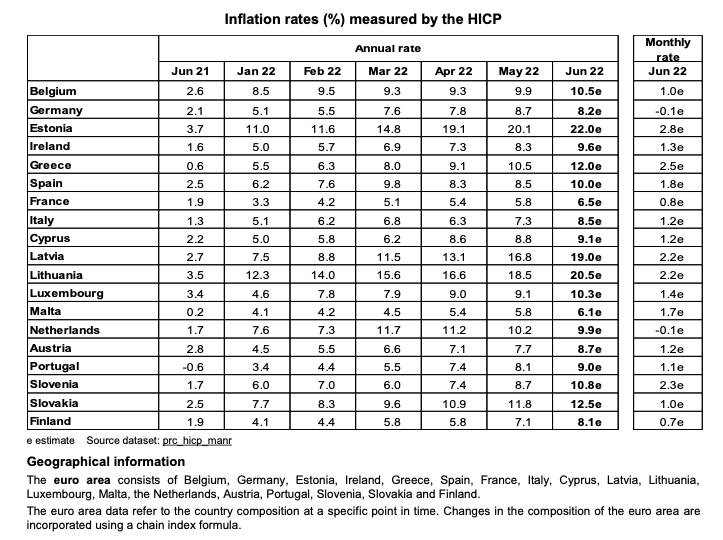 …interest rates would be rising just as quickly. The problem is one of credibility. No one really believes that the ECB will raise rates very substantially in the midst of what is almost certain to be a recession – or, at least, one which is worse than the US experiences.
With inflation currently at 8.6%, they’re just now talking about raising rates by a quarter point – well behind the US which has already seen. How can you take them seriously?
In the absence of a Russian withdrawal from Ukraine, which hardly seems likely at this point, we shouldn’t be surprised if EURUSD plunges right through the .618 this time – especially between now and July 19 when stocks are expected to bottom at -30%.
If so, there are several likely downside targets that could see some action in very short order:
(1) the intersection of the red 1.272 and purple .786 at .9898
(2) the intersection of the red 1.618, yellow .707 and purple .886 at .9117-.9245
the yellow .786 at .8449
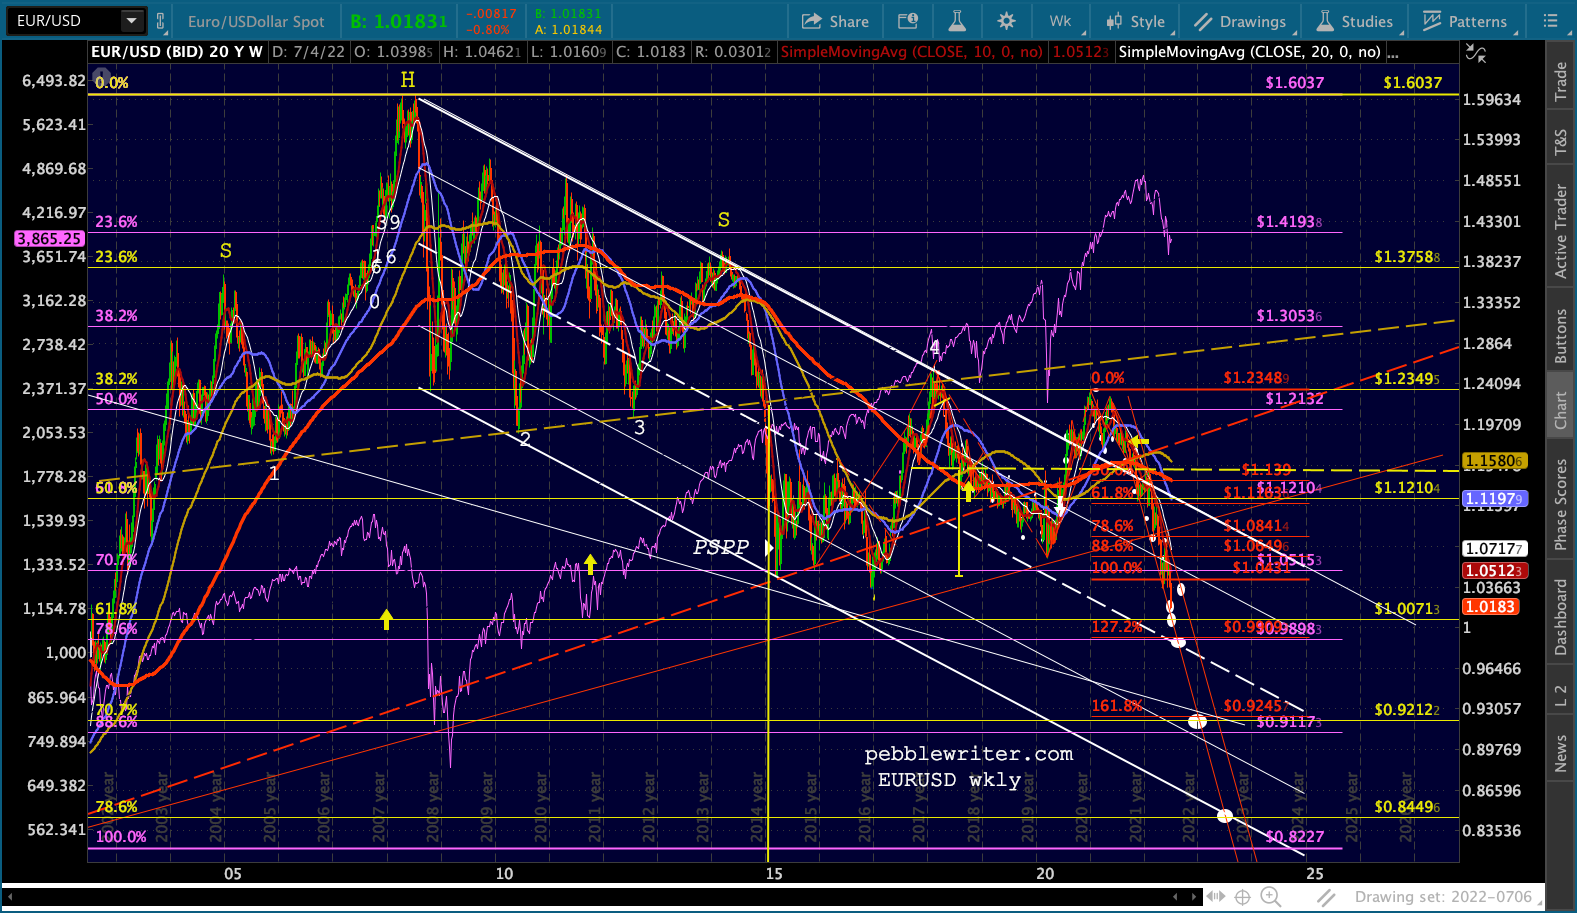 Taking our analog into account, the most likely path is a bounce at 1.0071 or .9898 between now and July 19, a strong backtest bounce into September, then an even bigger dump into January 2023. If we get a bounce at 1.0071, then maybe something like this.
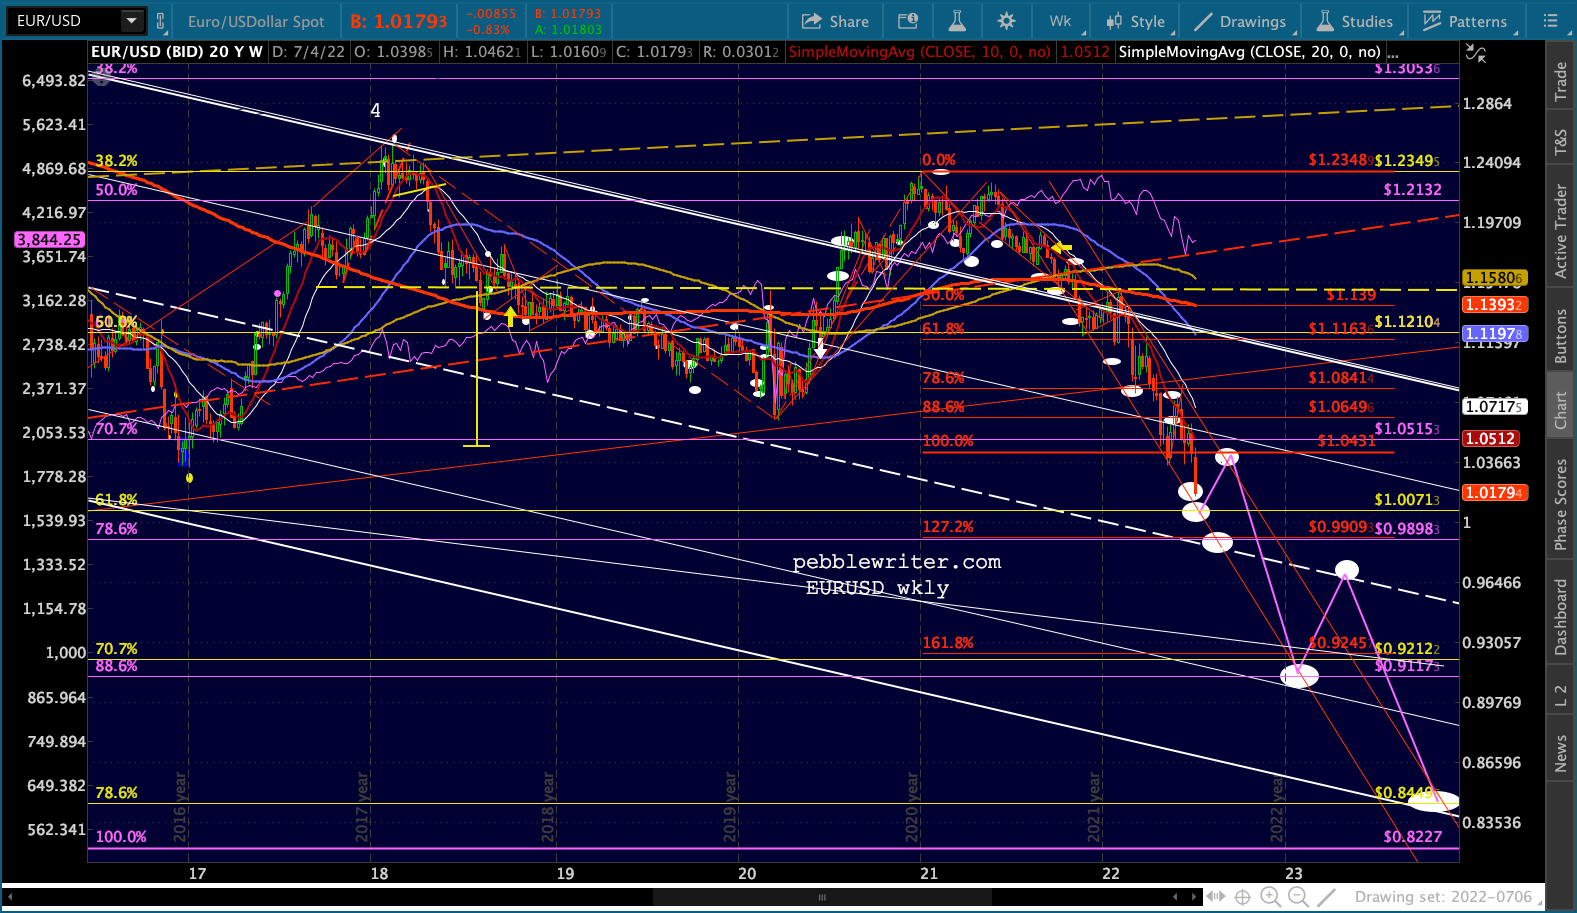 If it doesn’t bounce, then .9909 would be the next potential bounce spot.
We’ll take a look at DXY and see if it agrees. We’ll start with the big picture and the channels we’ve seen many time before. The reason today’s highs might hold is that the top of the white channel from 2003 is also a neckline of a gigantic Inverted H&S Pattern that targets 130ish.
The pattern actually completed in late 2016, breaking above the white channel top (and the yellow .618 Fib), but then had second thoughts. It dove back down to the channel midline and didn’t break out of the channel again until today.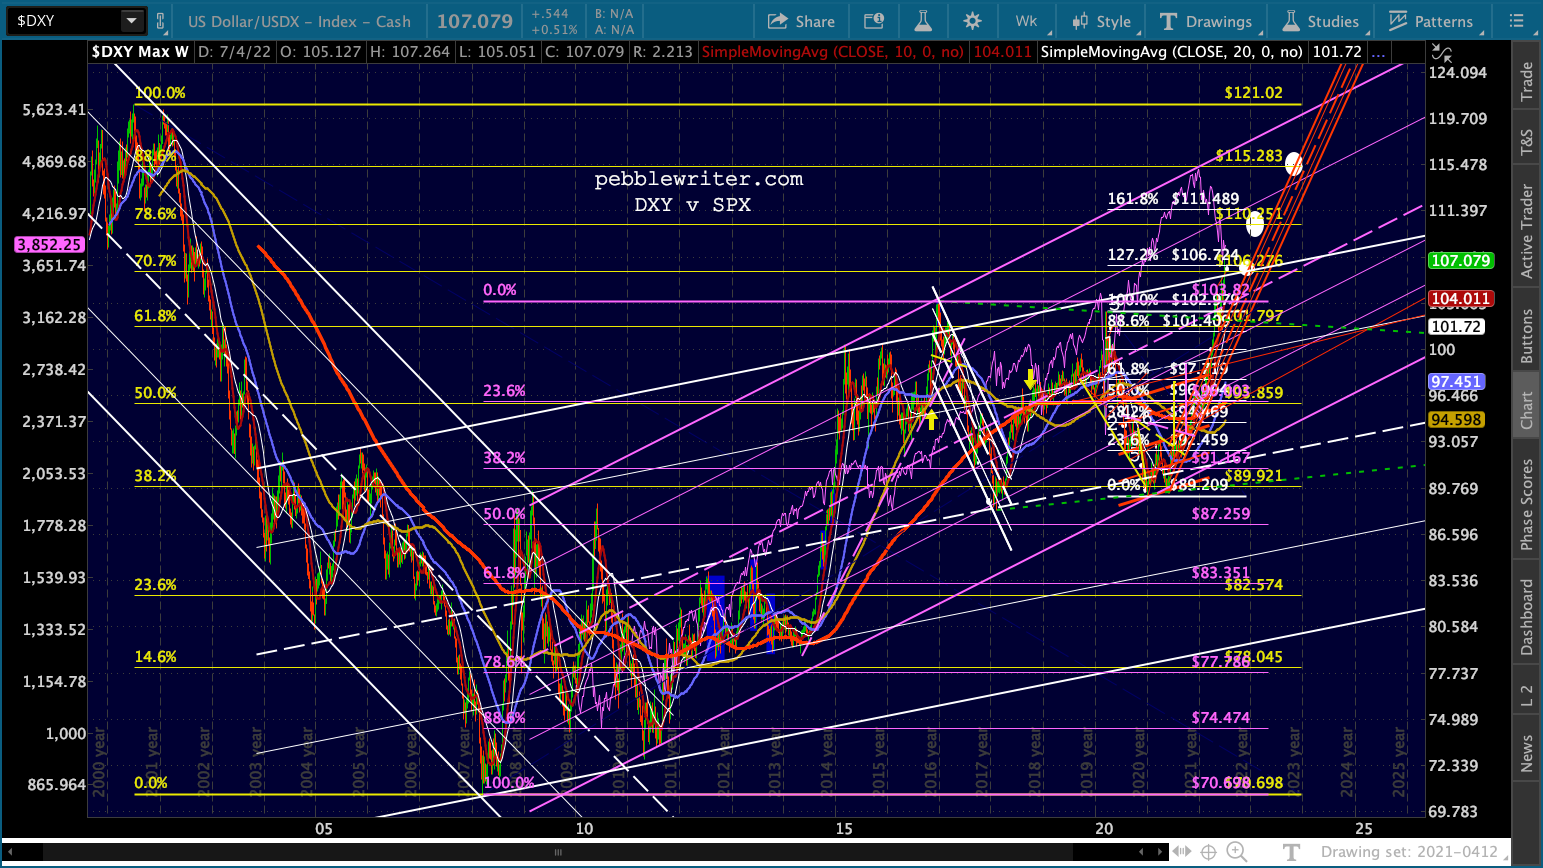 If it remains above the white channel top this time, it suggests that the rising purple channel has taken the reins with respect to future moves. If it doesn’t, then the white channel could continue to guide future prices.
Operating under the assumption that our analog is correct and should remain so for the next six months, we would expect that DXY is going higher over the next two weeks, then correcting sharply until mid-September, then spiking much higher into January 2023.
The Fib picture might go something like the chart below, though it is admittedly looks iffy with regard to channel intersections. Unfortunately, there are no Fib levels that intersect with channel lines at logical places. So, we are left to pick one or the other – as long as DXY has actually broken out, meaning today’s move isn’t a head fake.
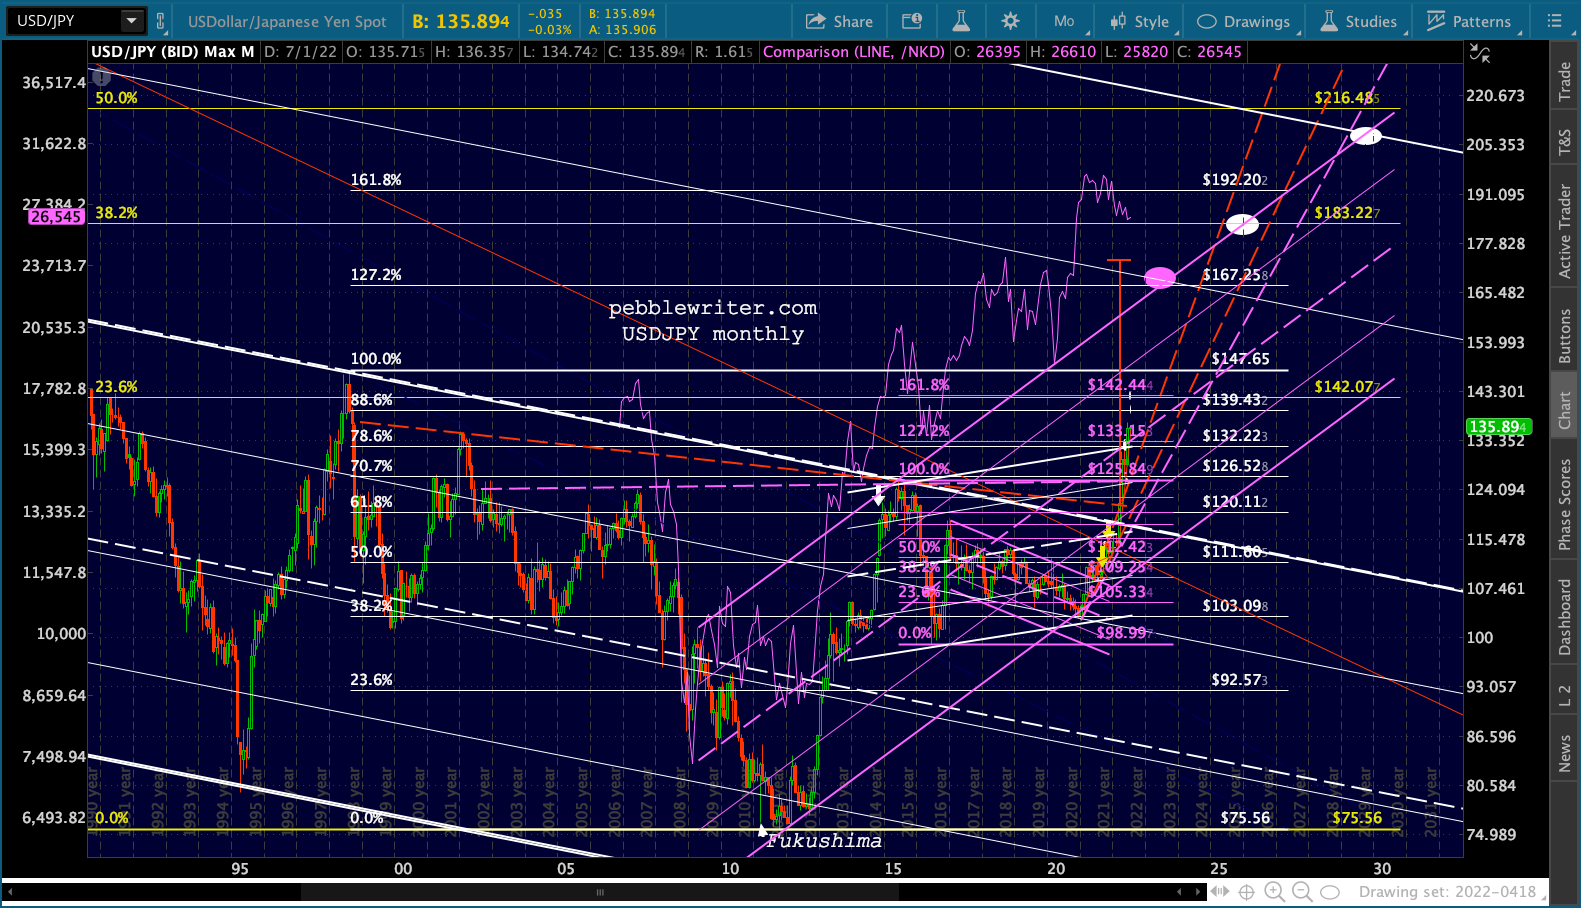
 Let’s see if USDJPY sheds any light. In past charts, we’ve focused on the falling white channel, the rising purple channel, and the Fib levels.
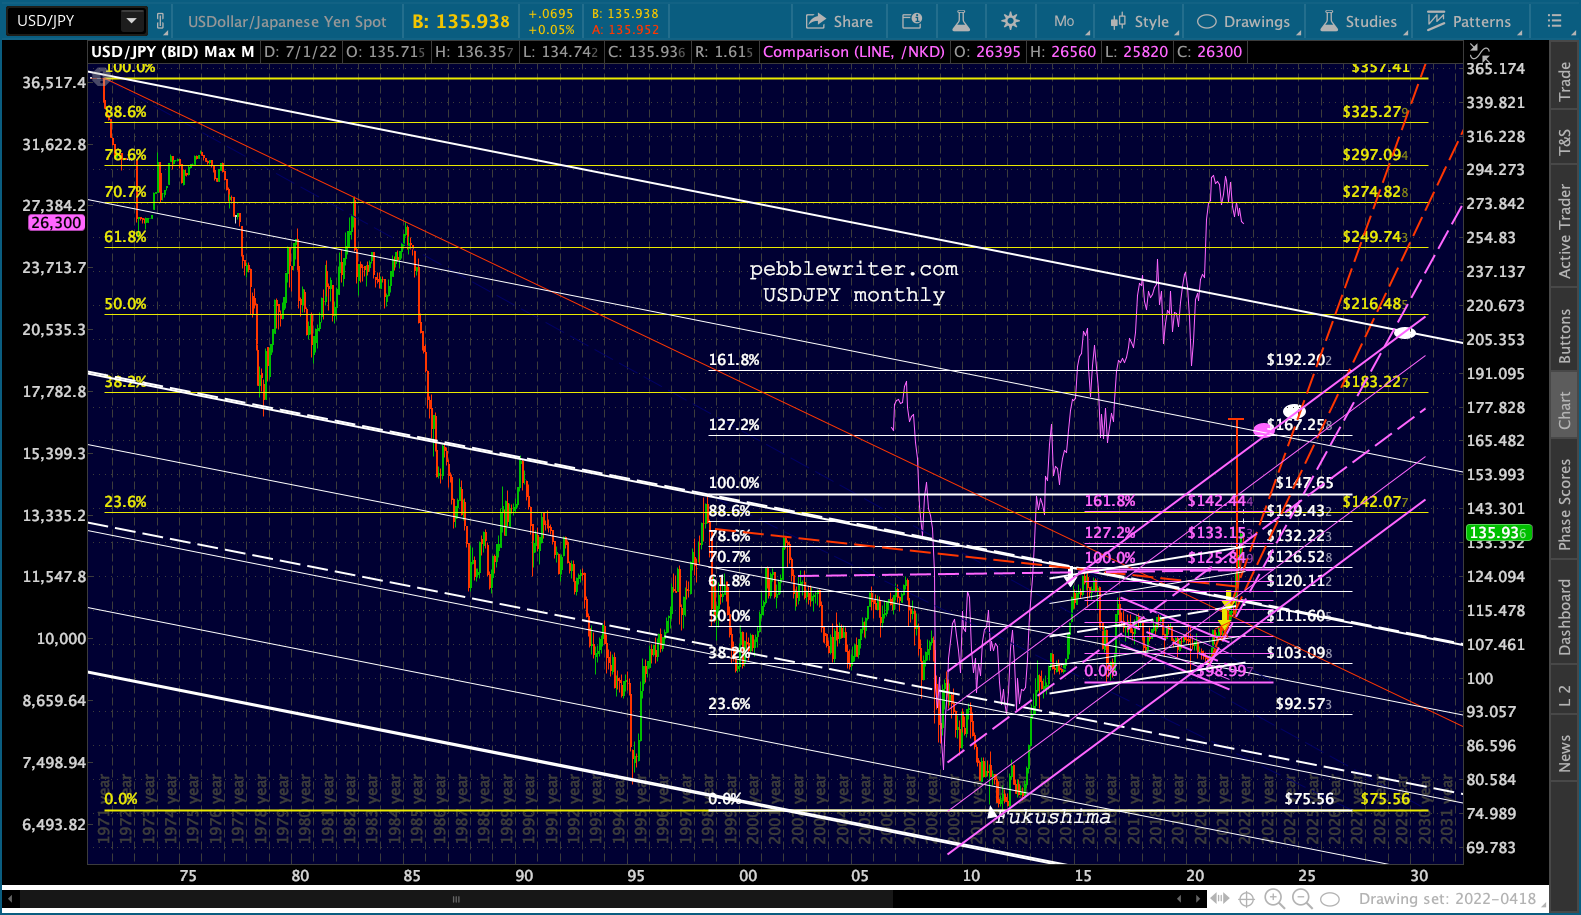 Zooming in, we cam see two IH&S patterns that completed in Mar and Apr. They both point to about the same level – around 173 – not far from the white 1.272 extension at 167.25 and the yellow .382 retracement at 183.22.
The rising purple channel reaches the 1.272 in May 2023, which our analog says will be a cycle top. So, we put a big purple target there and move the white target to the .382 in late 2025.
 If we zoom in a little closer, we can see two Fib levels which potential stand in the way: the white .886 at 139.43 and the yellow 23.6/purple 1.618 combination at 142.44. Either of these should provide at least some resistance and potentially a turning point for a backtest of the purple midline, the red TL or the white flag pattern top in the range of 132-133.
Even a pause would be bearish for stocks as it would represent a big departure from the steady daily rise we’ve been seeing. 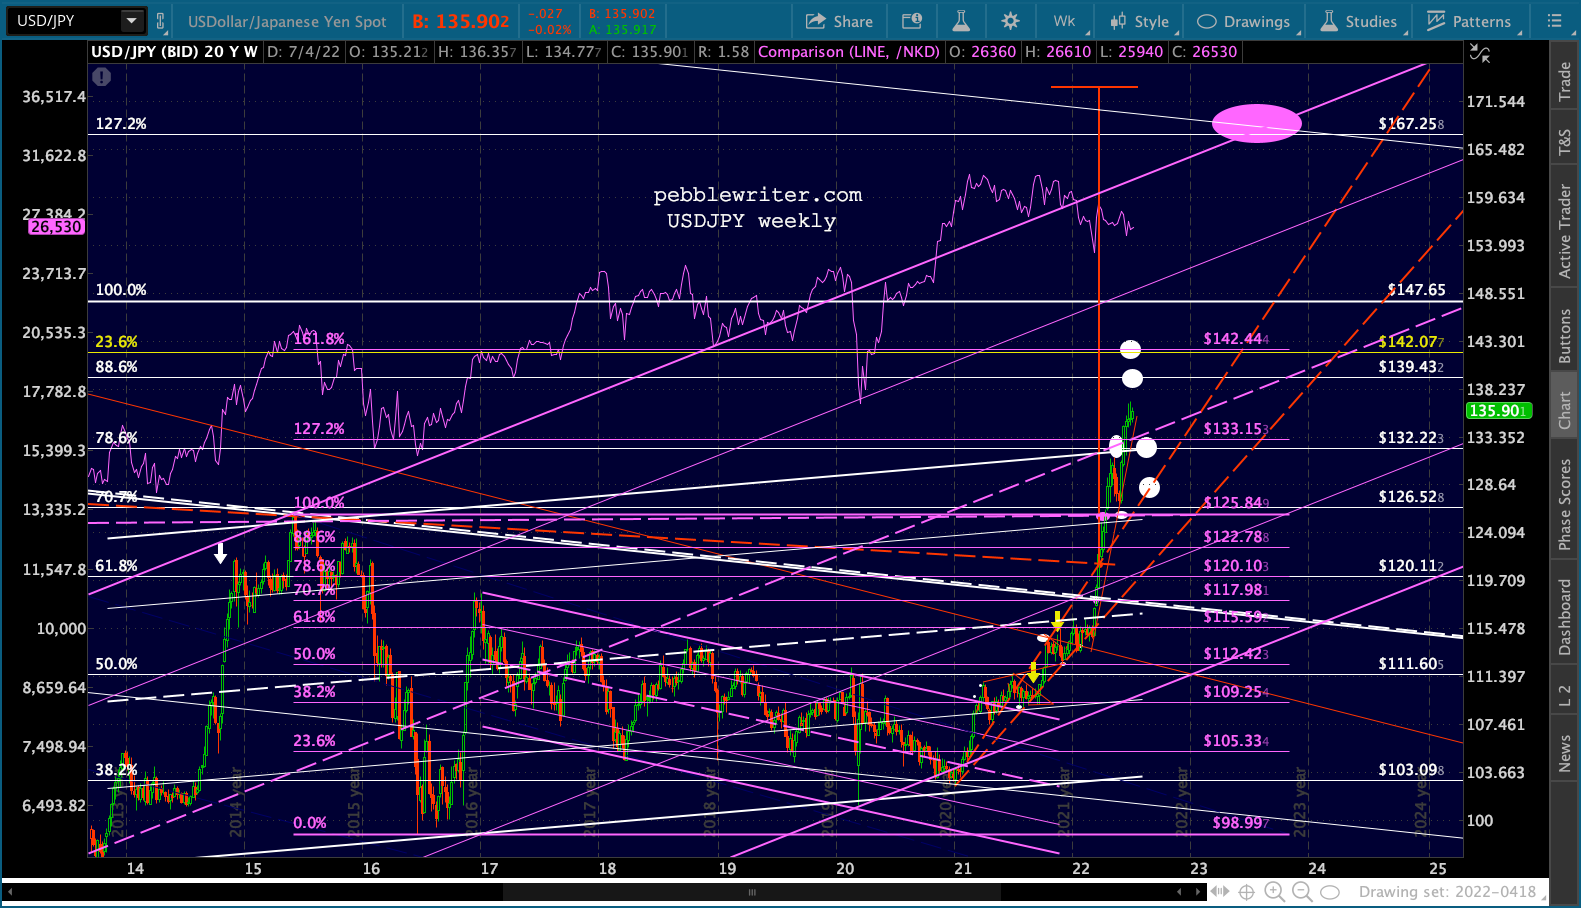 Bottom line, continuing strength of the USDJPY (yen weakness, dollar strength) multiplies the benefit to DXY of the EURUSD’s continuing decline (euro weakness, dollar strength.) So any big declines in DXY would come as a bit of a surprise and would, as we’ve seen of late, be bearish for stocks.
GLTA.