

Like most Mondays (the white arrows), we’ve seen another sharp spike in VIX which was subsequently smacked back down the opening bell… …this one producing an 87-pt bounce off the overnight lows.
 Today’s post will pick up where we left off on Friday. This morning, EURUSD reached our 1.0829 target set last June.
 continued for members…A quick roundup of the usual charts…

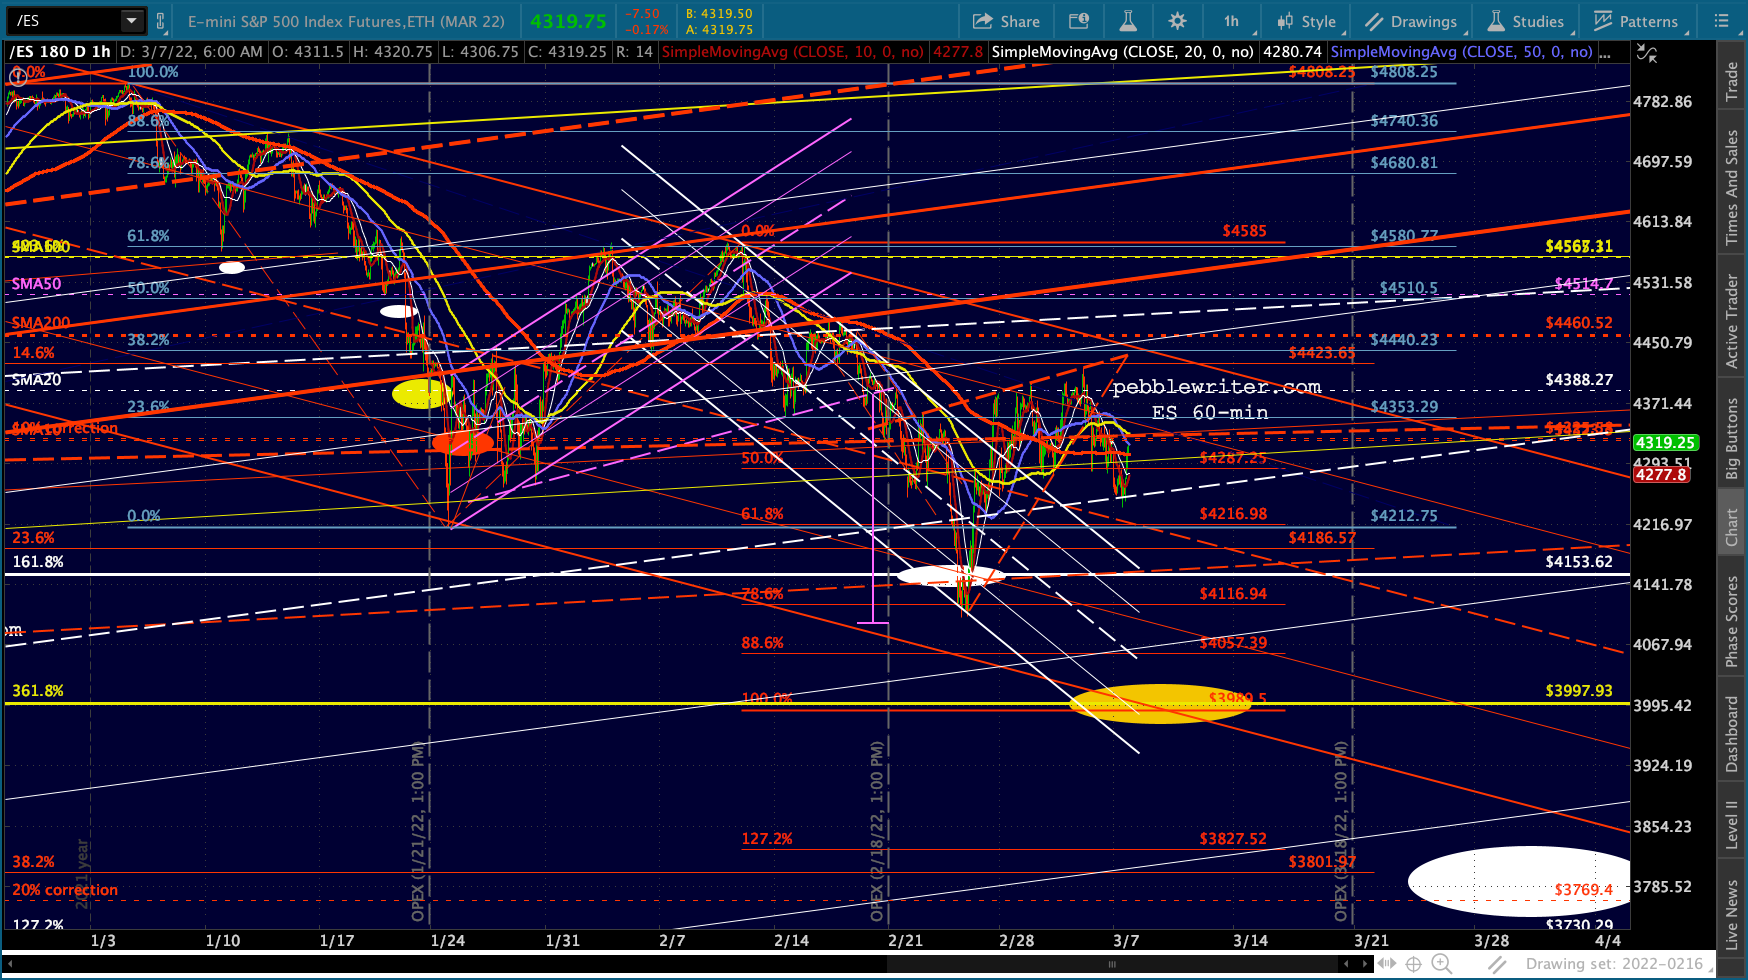

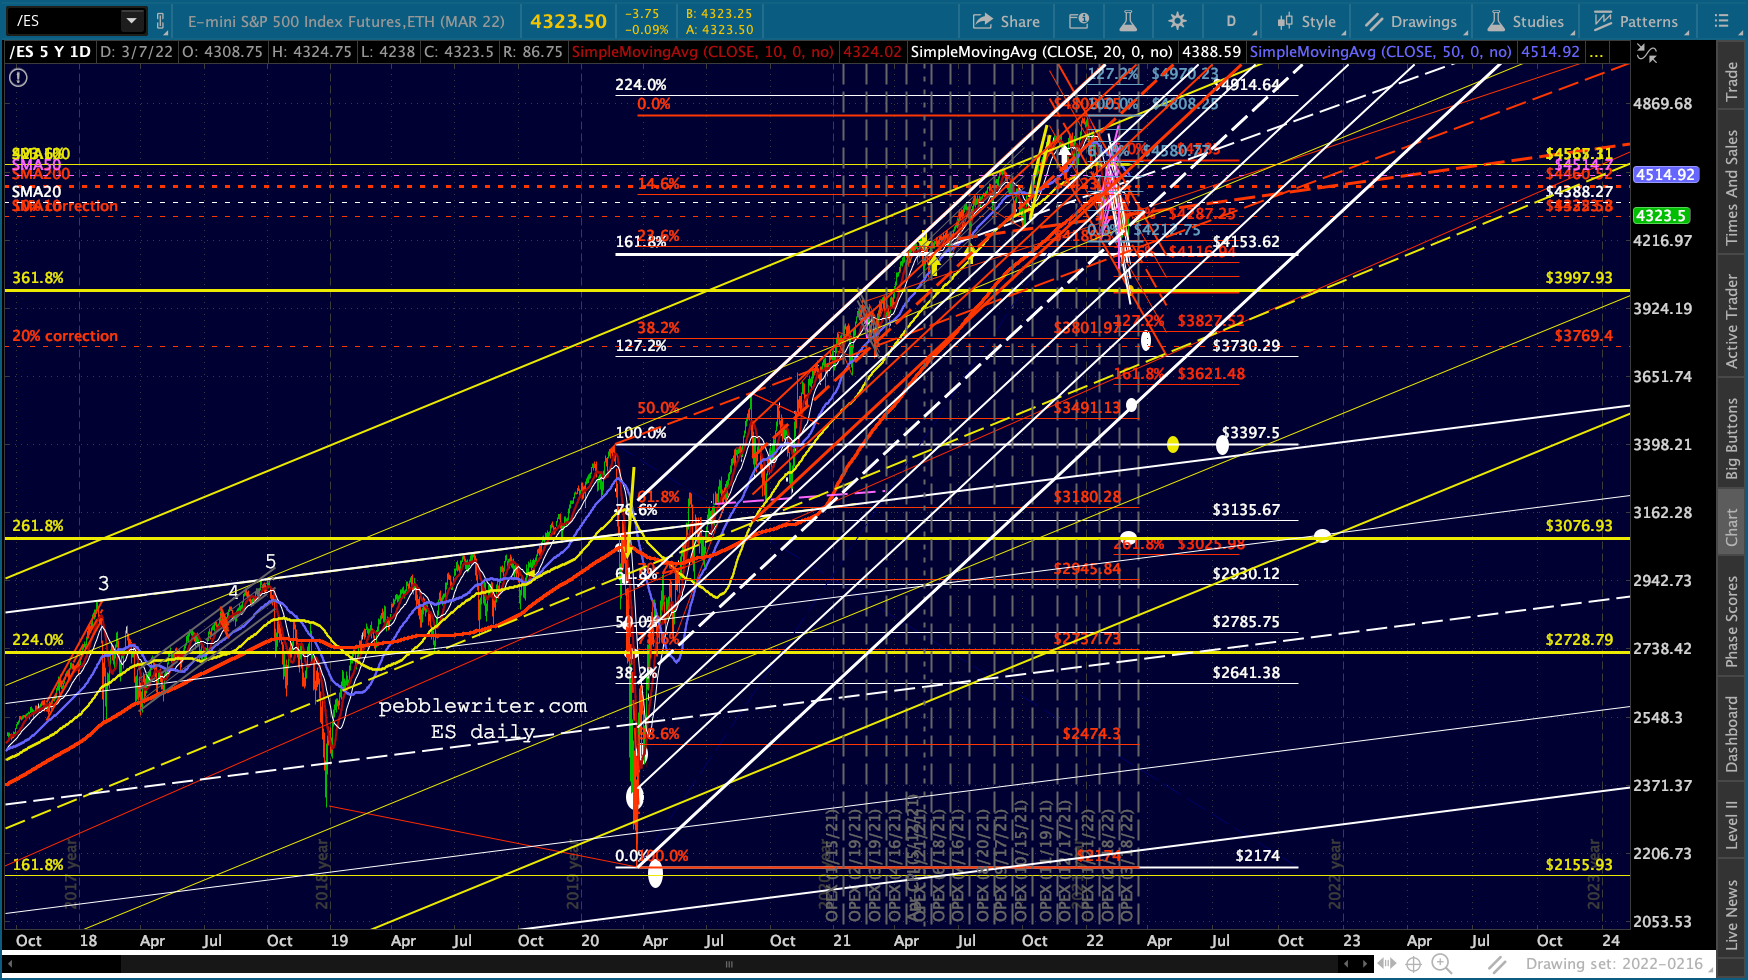 Remember that SPX’s chart shows it could reach 4000 as soon as today.
 And, VIX’s chart shows potential to easily reach or exceed 41.36 today.
 CL has popped up above its .786 and nearly reached its .886.
 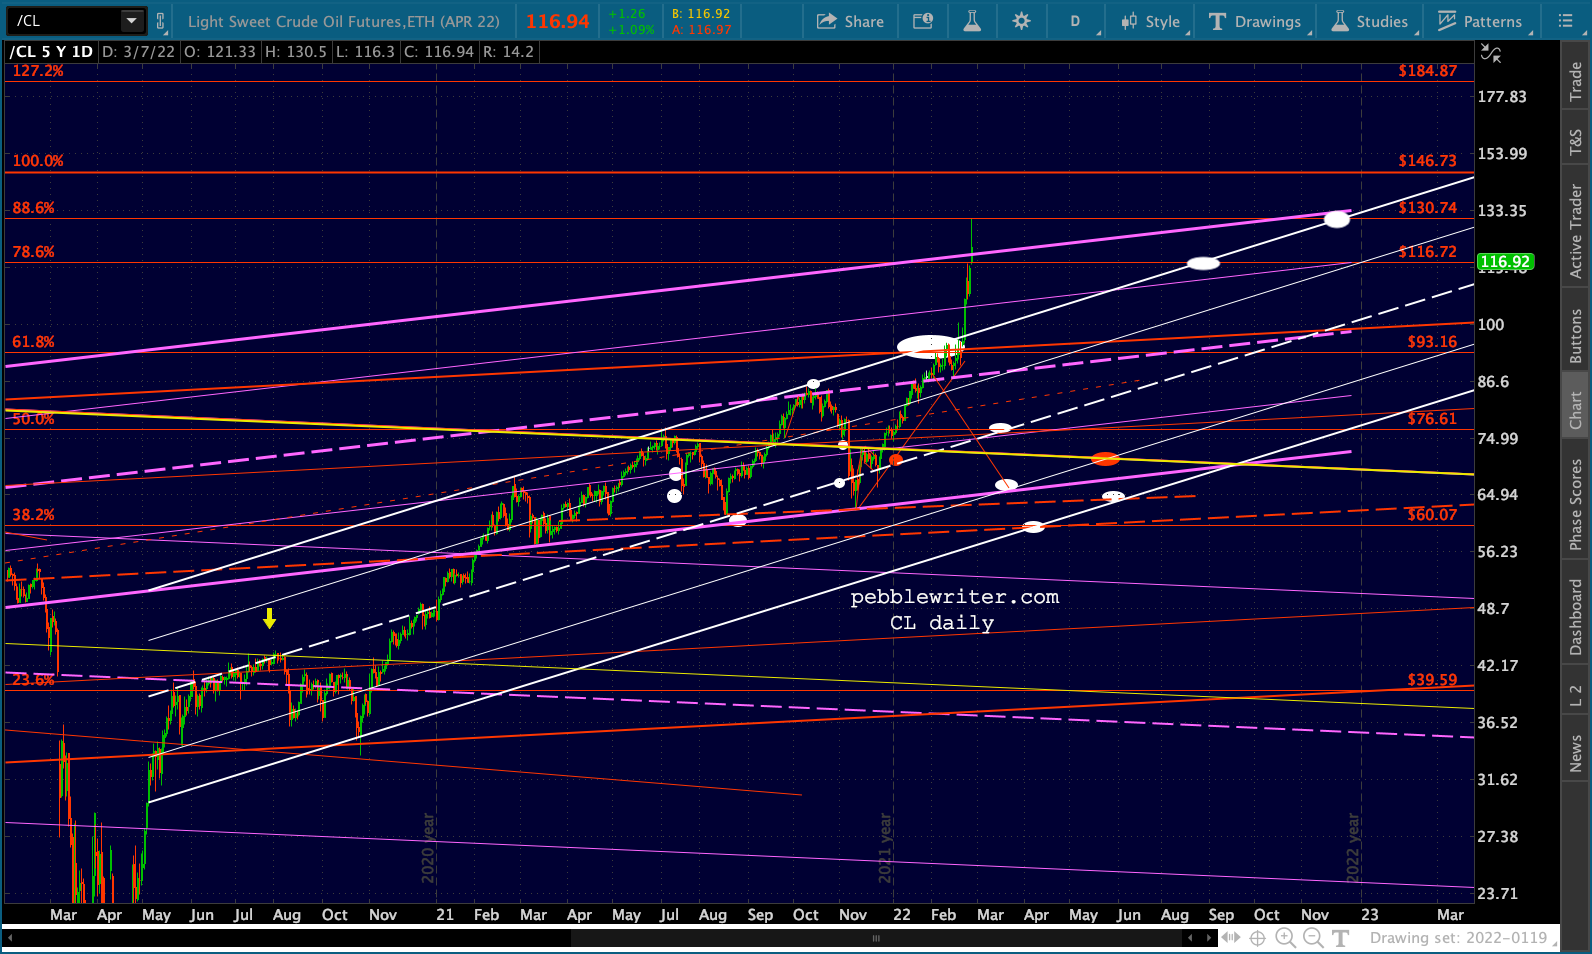 Easier to see on the wkly chart.
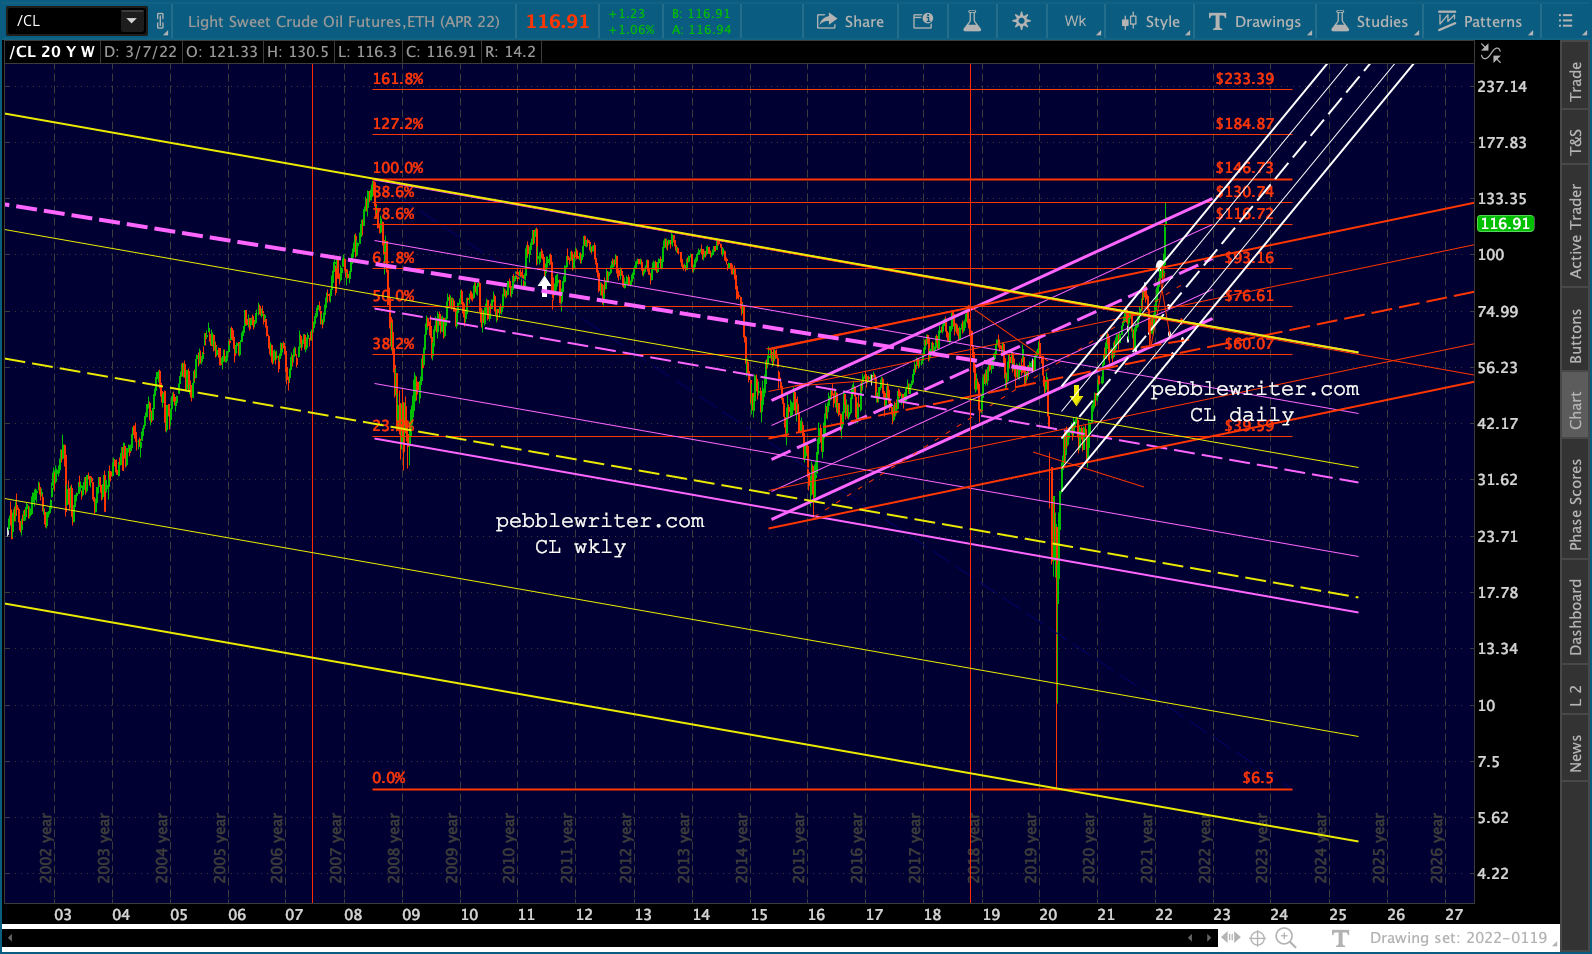 And RB has easily topped its 1.618 extension.
 Thankfully (said the Fed) interest rates have broken off their engagement with higher oil/gas prices.
  Back to currencies…
We left off on Friday with the DXY picture. Recall that DXY broke down from the large purple channel in July 2020. Having already tested the top and the midline of the rising white channel in 2015-2018, it seemed as though DXY could potentially drop below the midline.
 It dipped below the red .886 and the midline itself before rebounding. It has since backtested the purple channel and pushed above the .618. In the process, it has backtested the white channel .786 line that it spent nearly two years (Aug 2018-Jun 2020) criss-crossing.
 It it breaks above today’s high of 99.418, it will have reentered the purple channel and has little overhead resistance all the way up to the white channel top currently around 105.6. The yellow .707 at 106.276 and white 1.272 at 106.741 both intersect the white channel top in late 2022 – but it seems unlikely that DXY would wait that long to make its move given the fluidity of the Ukraine invasion.
Note also that DXY has made both lower highs and higher lows since Jan 2017. In other words, it is forming a consolidating triangle – shown by the dotted green TLs below.
 If DXY breaks back into the purple channel as I believe it will, it is likely to slightly overshoot the white .886 at 101.421 and tag the green triangle top. If it happens quickly, that would mean 102.25. Only it it took until a year or so would it indicate 101.80.
Bottom line, a long position is perfectly justified here at 99. But, tight stops are warranted as the purple channel bottom and white channel .786 could at least pause the rally. on the way to 102.25ish. I would expect that triangle to break out there and for DXY to rally up to 106.28ish – but, again, it would likely require some stop-warranting consolidation first.
We now turn our attention to USDJPY. Remember, it has one purpose compared to which all others barely matter: to prop up the Nikkei.
 In so doing, USDJPY has been quietly gaining ground for the past 14 months with a long period of consolidation from Mar-Sep 2021.
 This was a function of trying to break out of the falling purple channel from Dec 2016.
 The purple channel guided prices following the at the top of the much larger falling white channel that was in place since June 1986.
 Obviously, the falling white channel doesn’t do much to explain the pre-1986 goings on. But, if we expand it, essentially doubling it, it does a very good job.
 Note also that we’ve added a dashed red trendline that runs fairly close to the midline of the combined channels. This is a neckline of a large Inverted H&S pattern that targets 173.35 – about where the rising purple channel currently is. If we insert a Fib grid, we can see that it’s reasonably close to the white 1.272 extension at 167.25. It’s also within a point of the alternative IH&S whose neckline is shown in purple.
 We’re left with two targets at 167.25 and 173.35.
 The close-up, then, focuses on the big white channel midline at 117.98, the red neckline at 121.27, the former high and purple neckline at 125.84, and the white .786 and purple 1.272 at 132.22-133.15.
  USDJPY is currently being supported by its SMA100. But, I keep thinking it might break down and test the SMA200 – perhaps in a backtest of the red trend line from the 70s at around 113.31 in the next few weeks. If it should ever drop through the SMA200, then we can talk about a backtest of the purple channel bottom at, say, 109.25.
 GLTA.
GLTA.