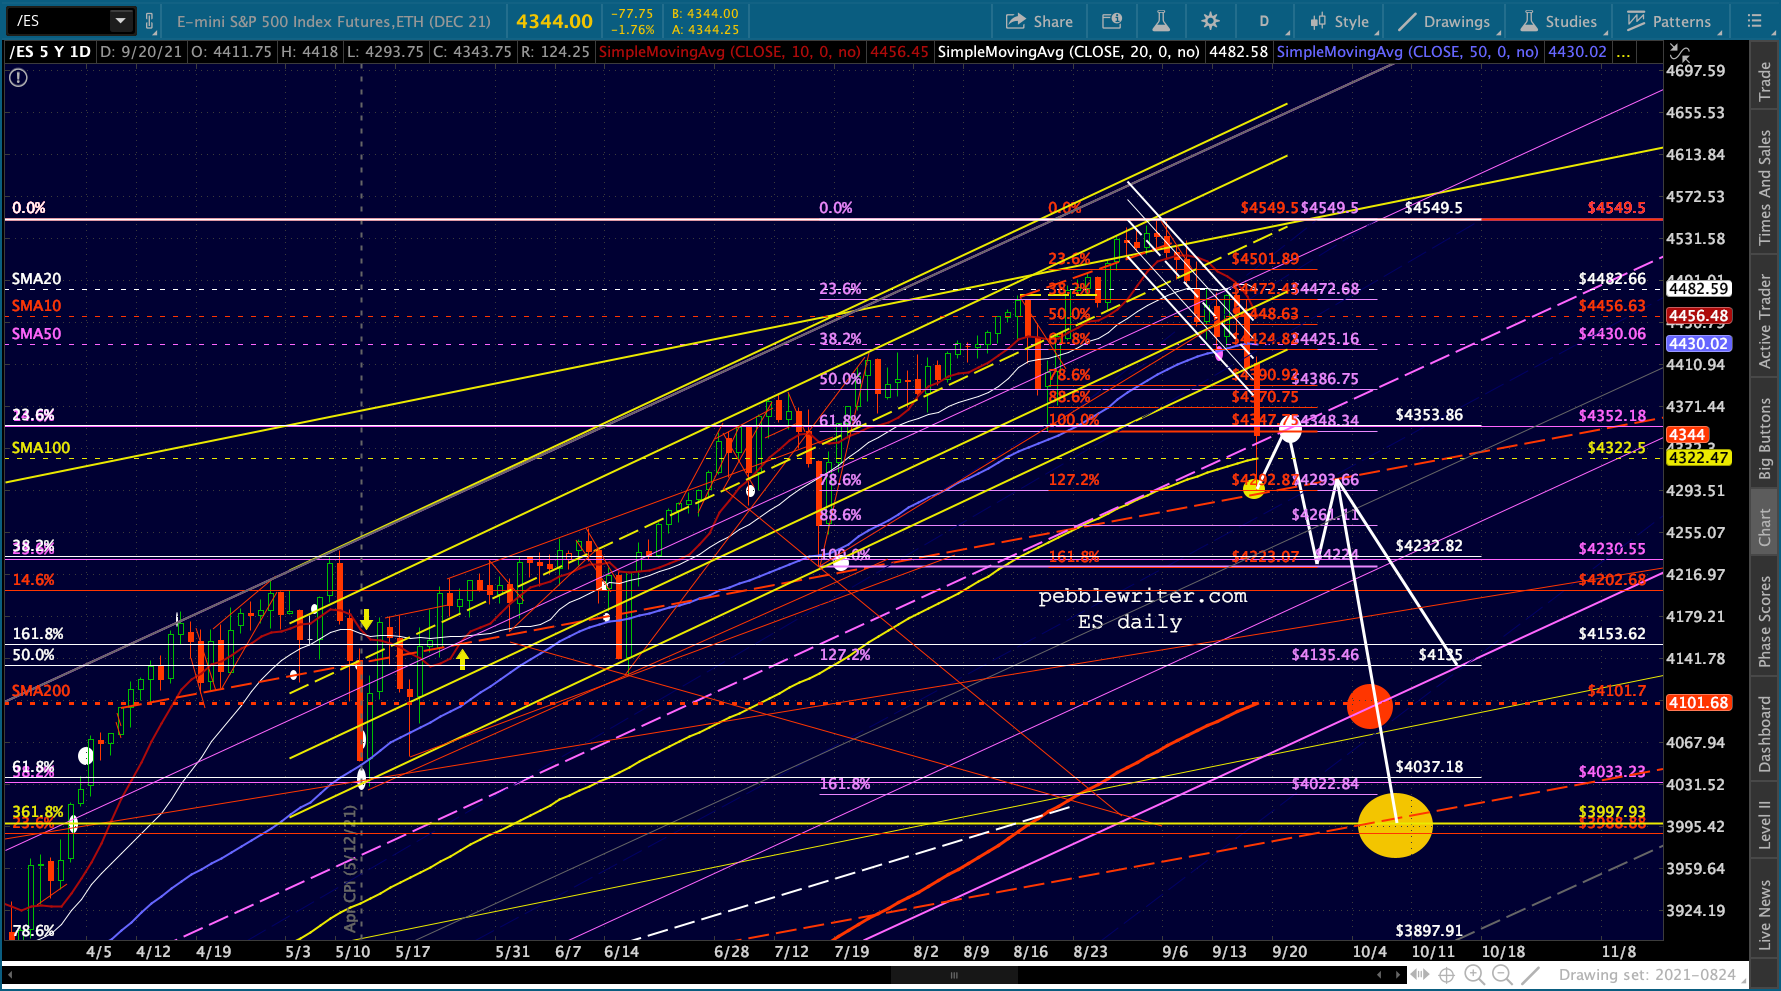
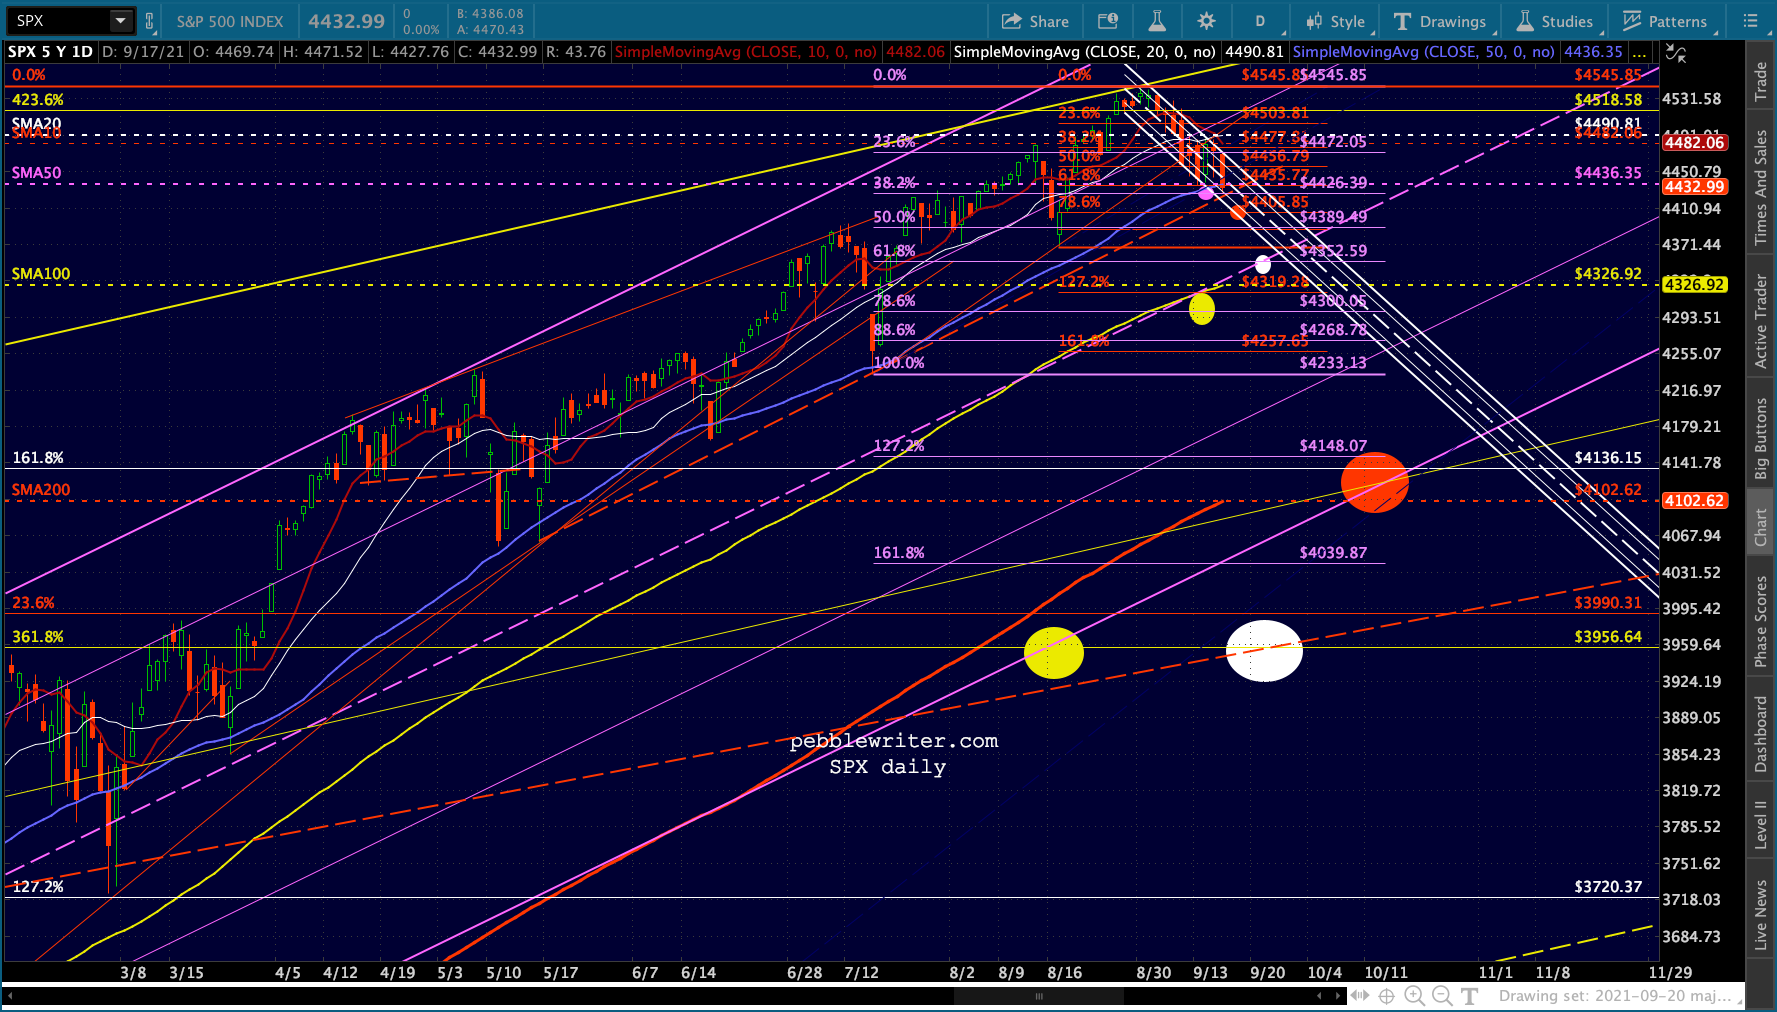
Futures reached our next downside target earlier this morning, the Fibonacci retracement at 4348 we added on Sep 9 [see: Just Don’t Call it a Taper.] ES is now off 4.6% since recent highs and 4% since our Correction Watch on Sep 8.
 The algo factors, which have propped up stocks for months, are positioned for further losses following their realization that a bounce at the 50-DMA is not guaranteed.
continued for members…This drop puts ES very close to the purple channel midline, with the red TL and .786/1.272 Fib combo just below at 4292.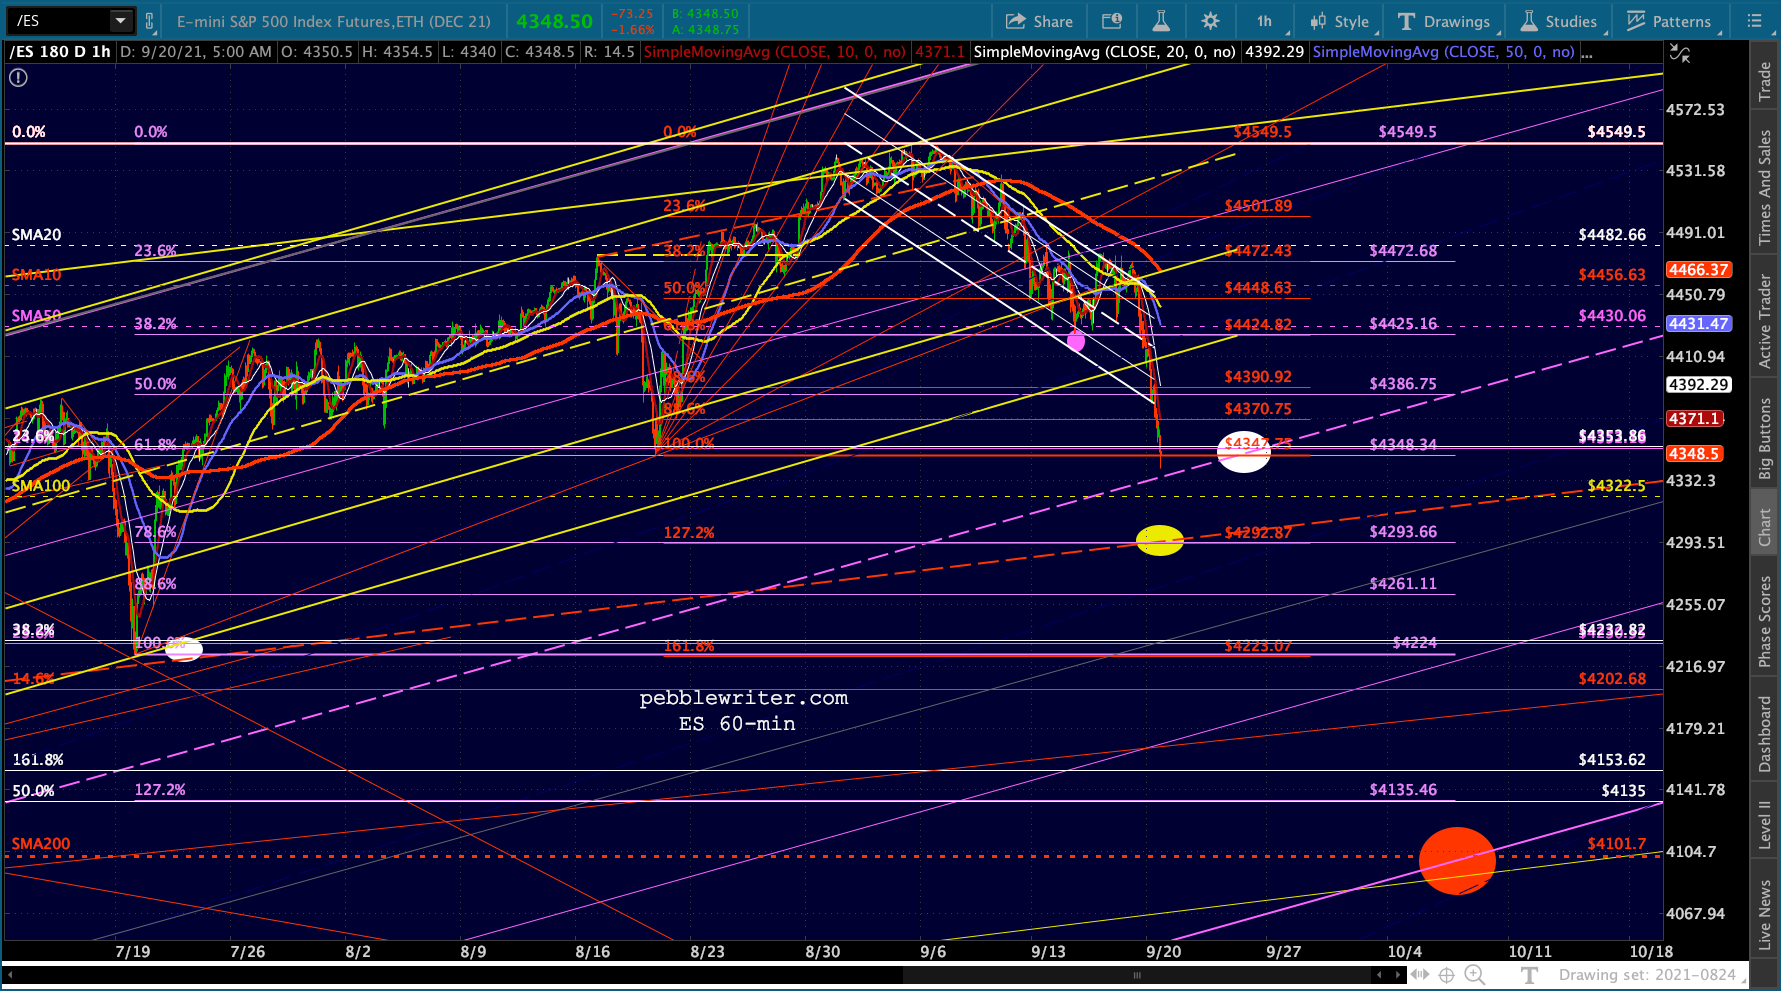 But, a more interesting prize remains the SMA200, now at 4101. If that doesn’t hold, the downside would be very significant.
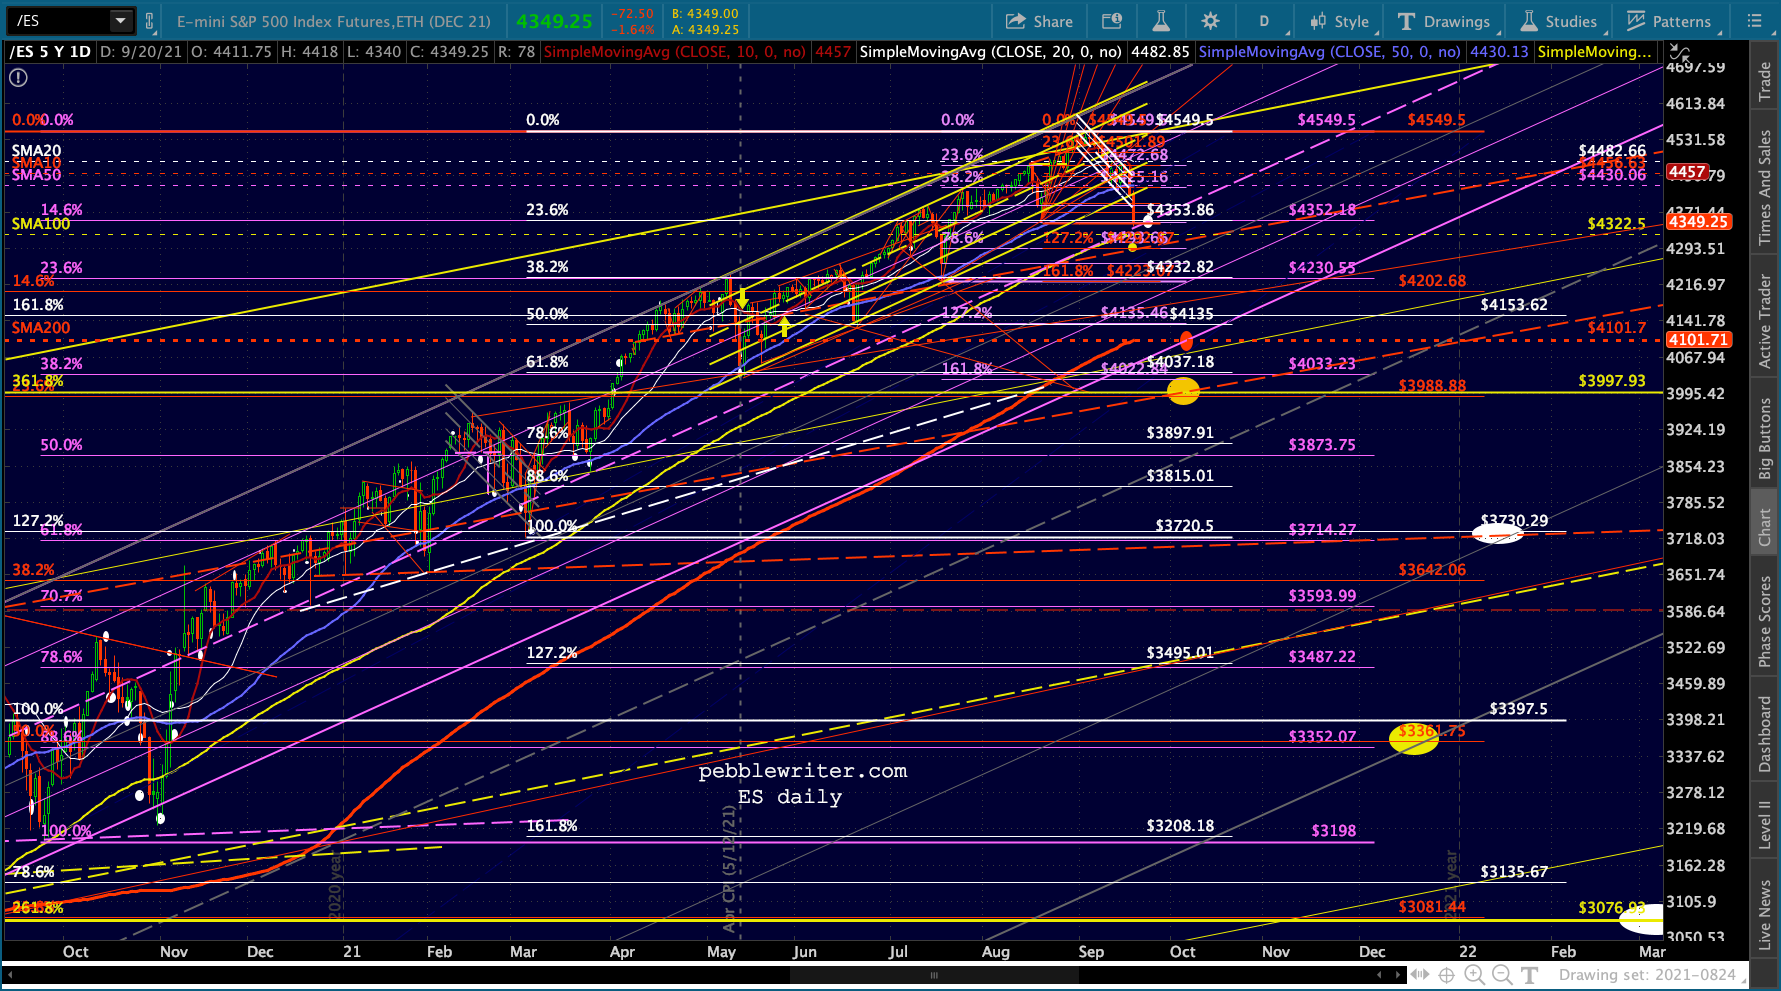
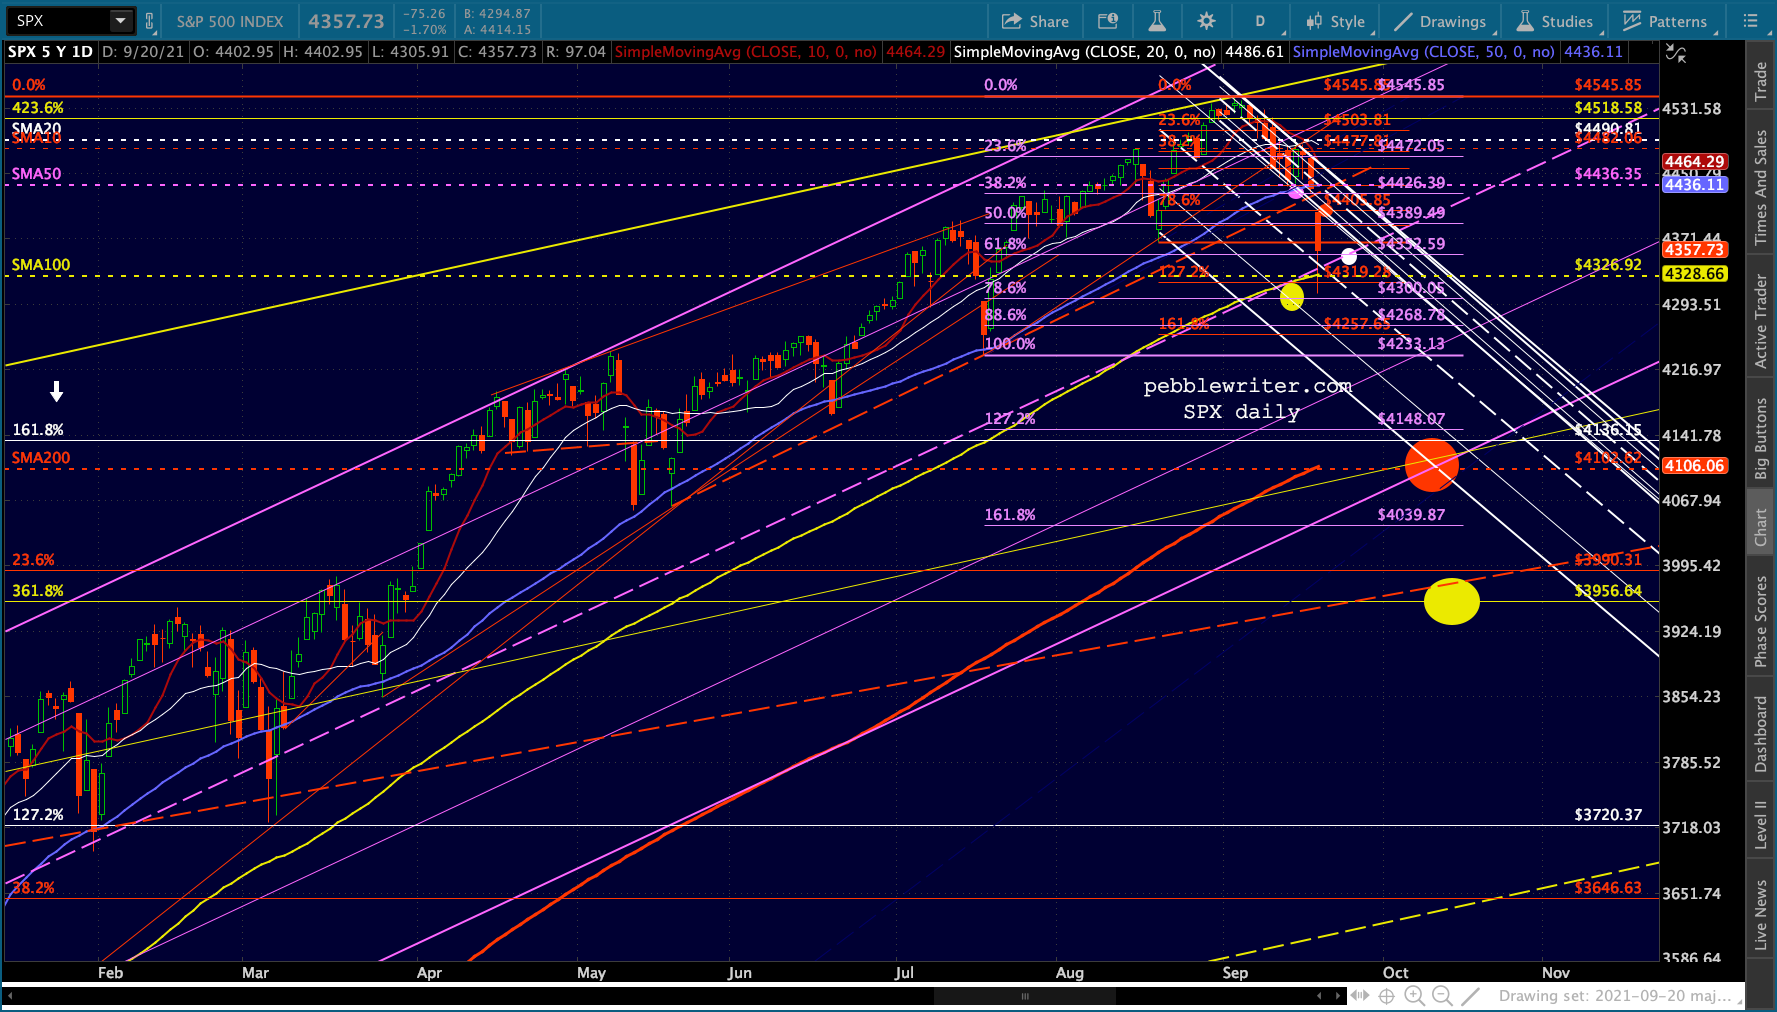
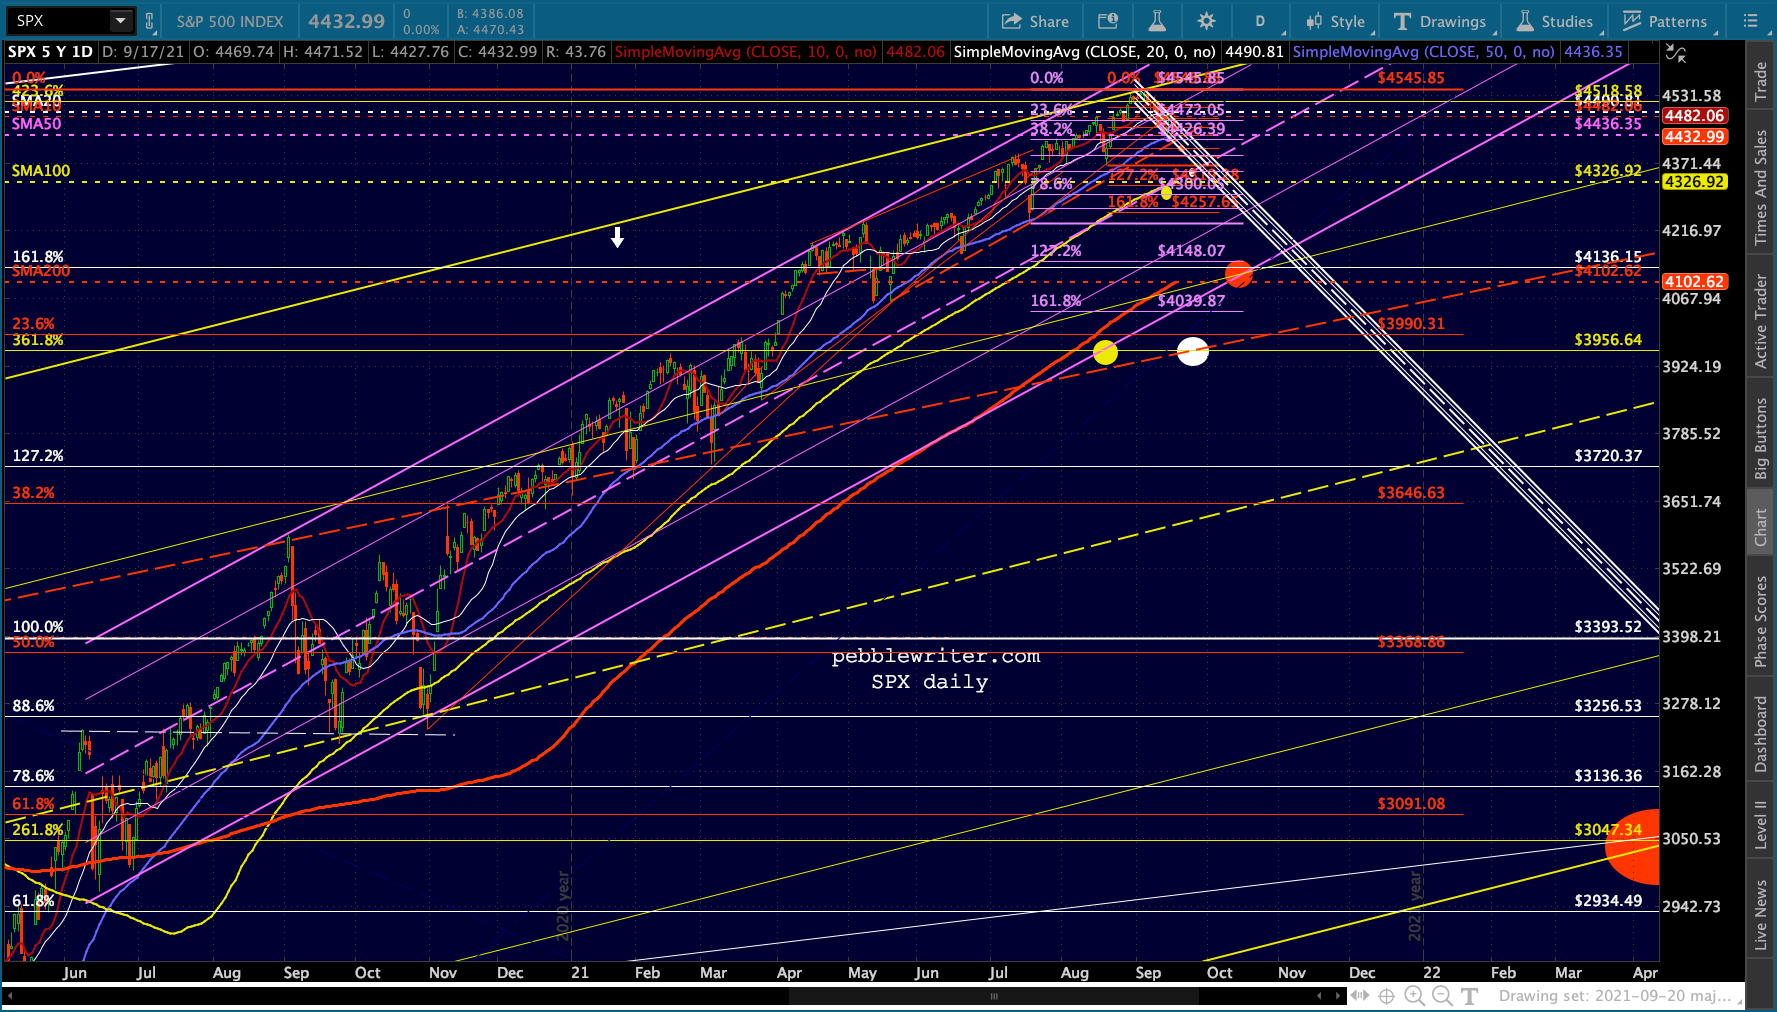
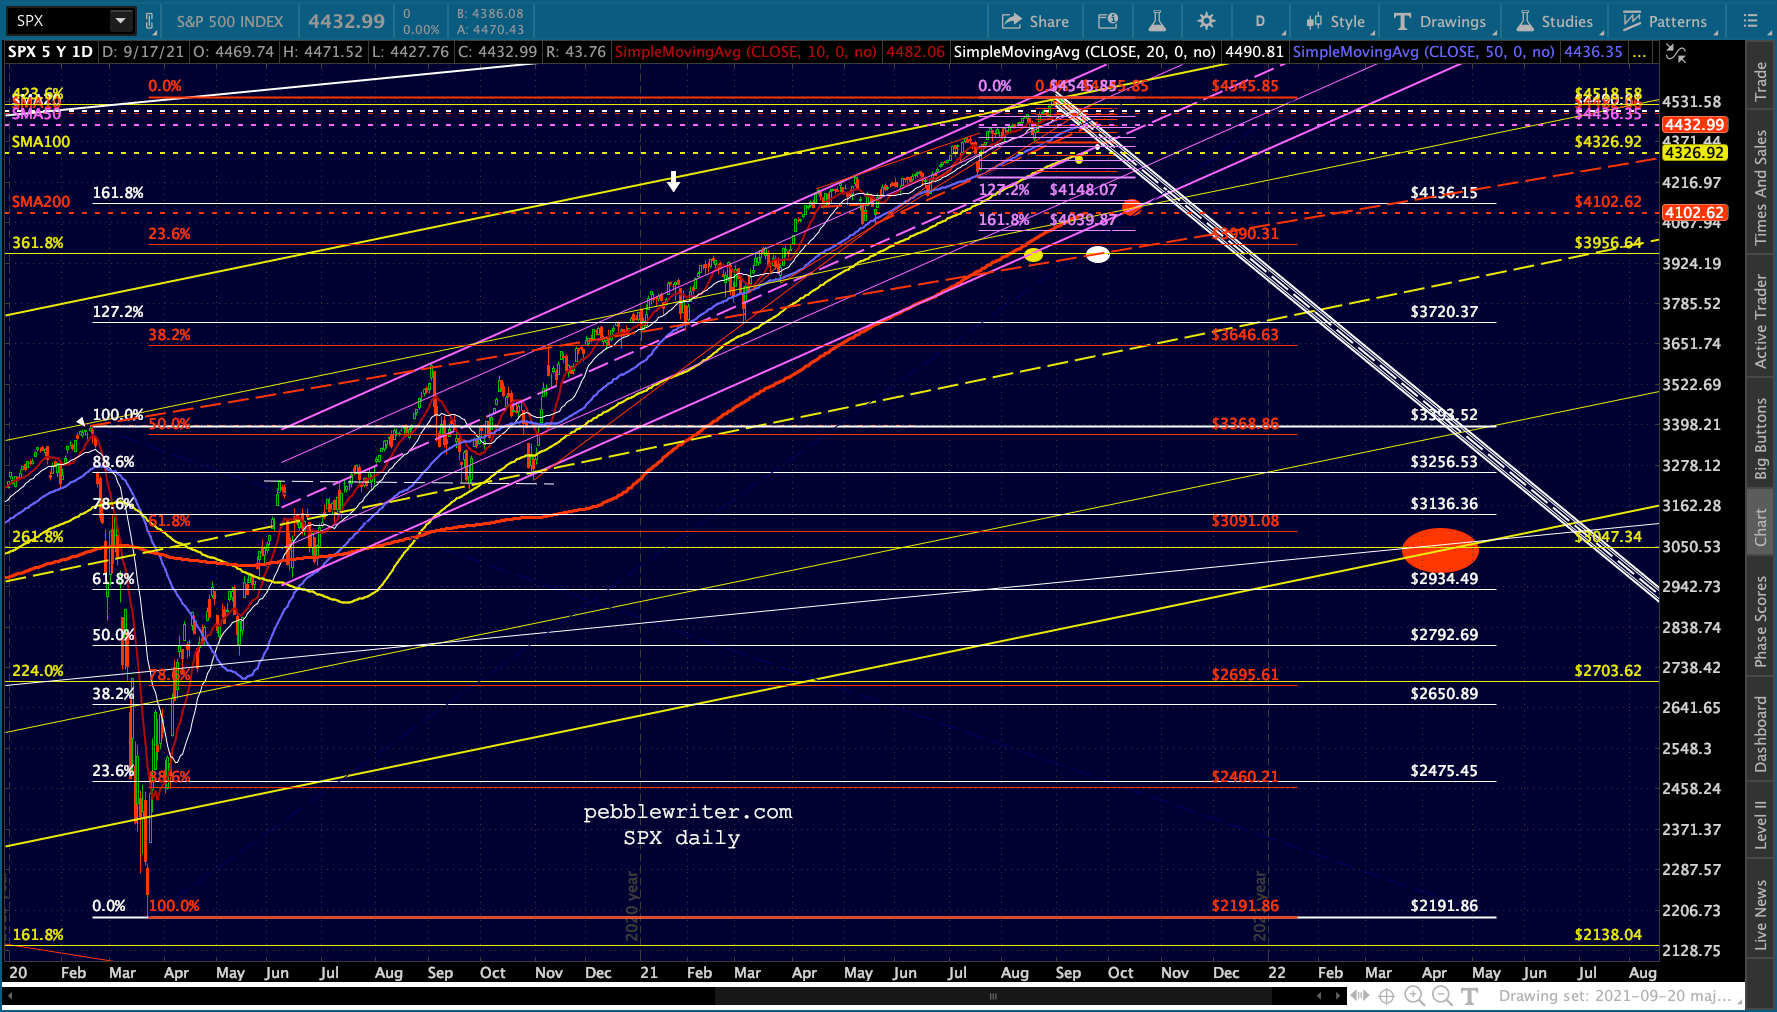
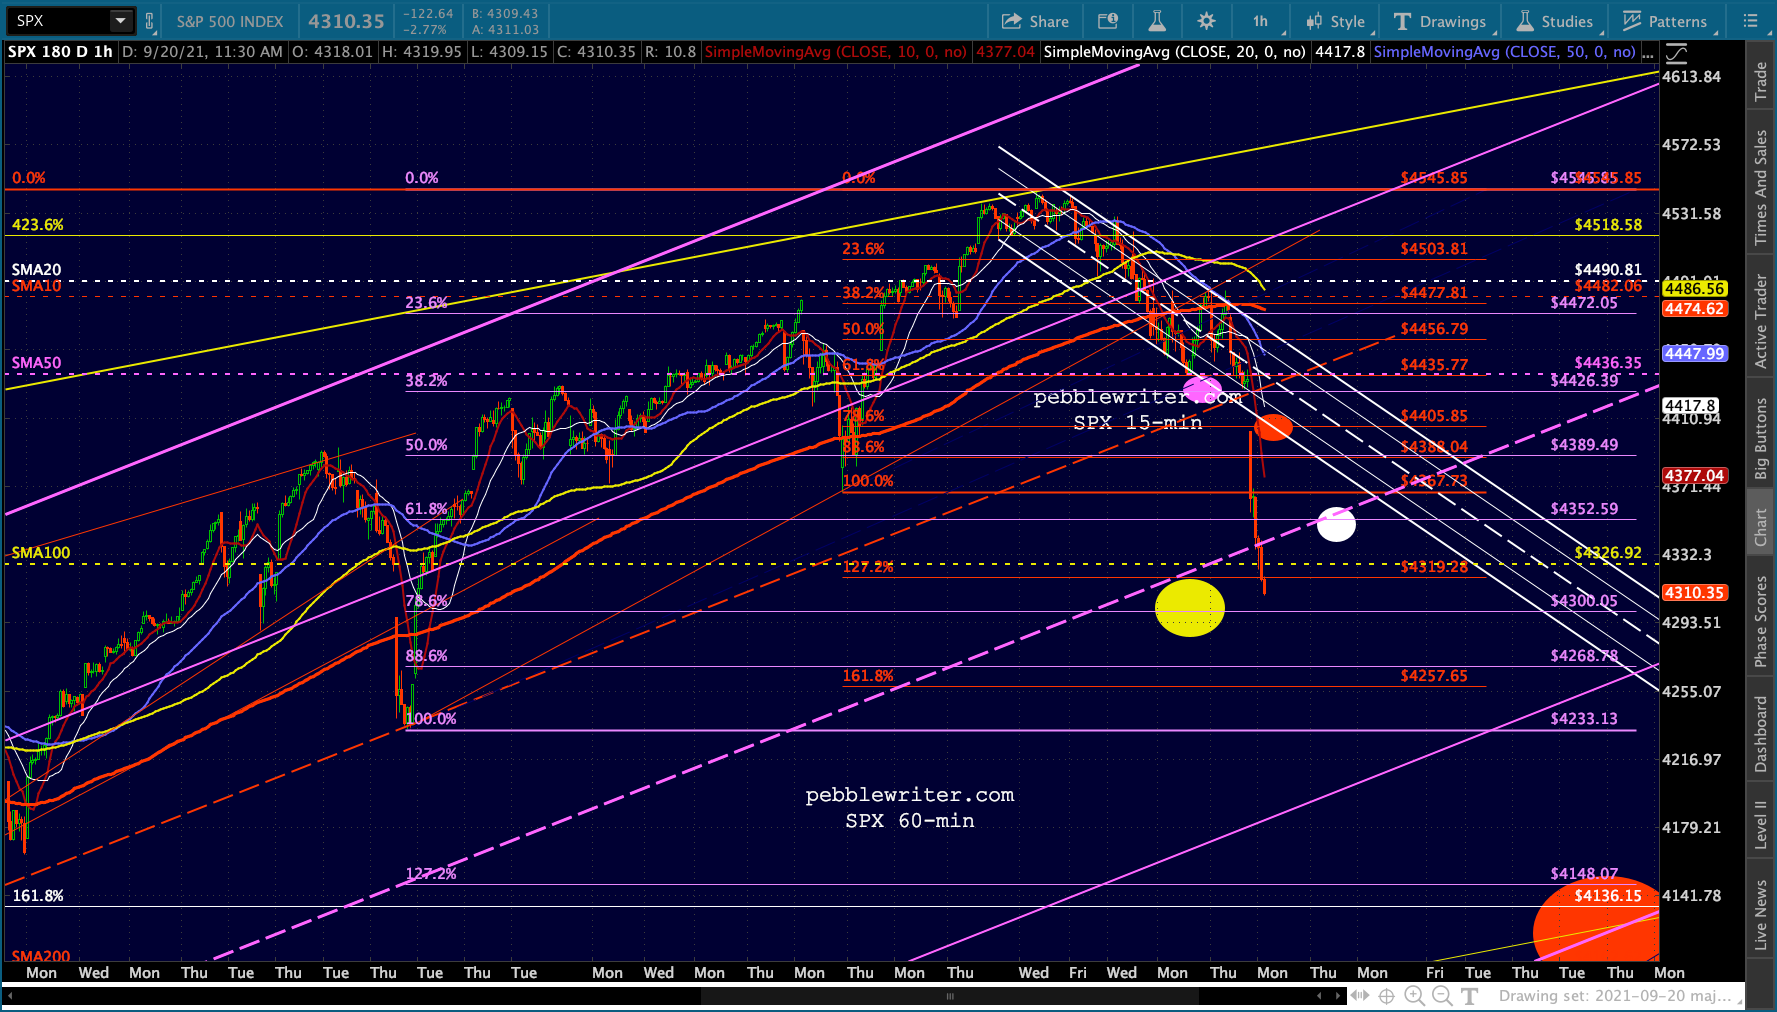
 The SPX version…
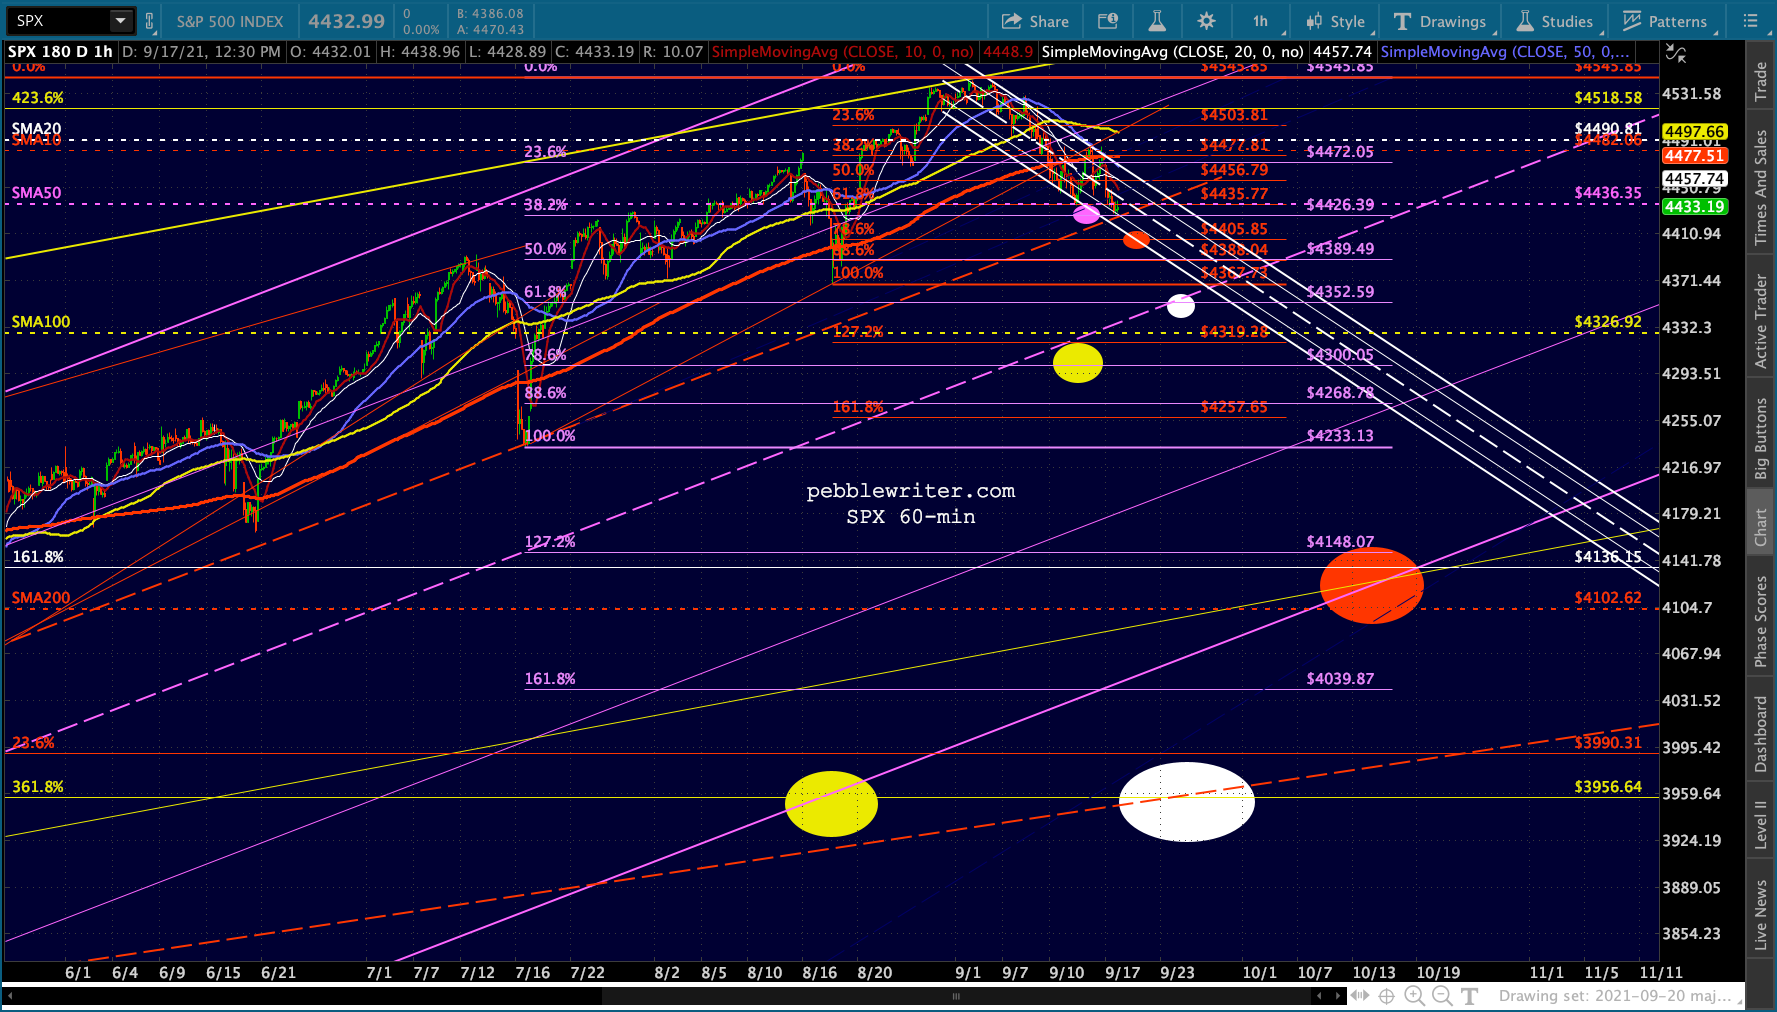
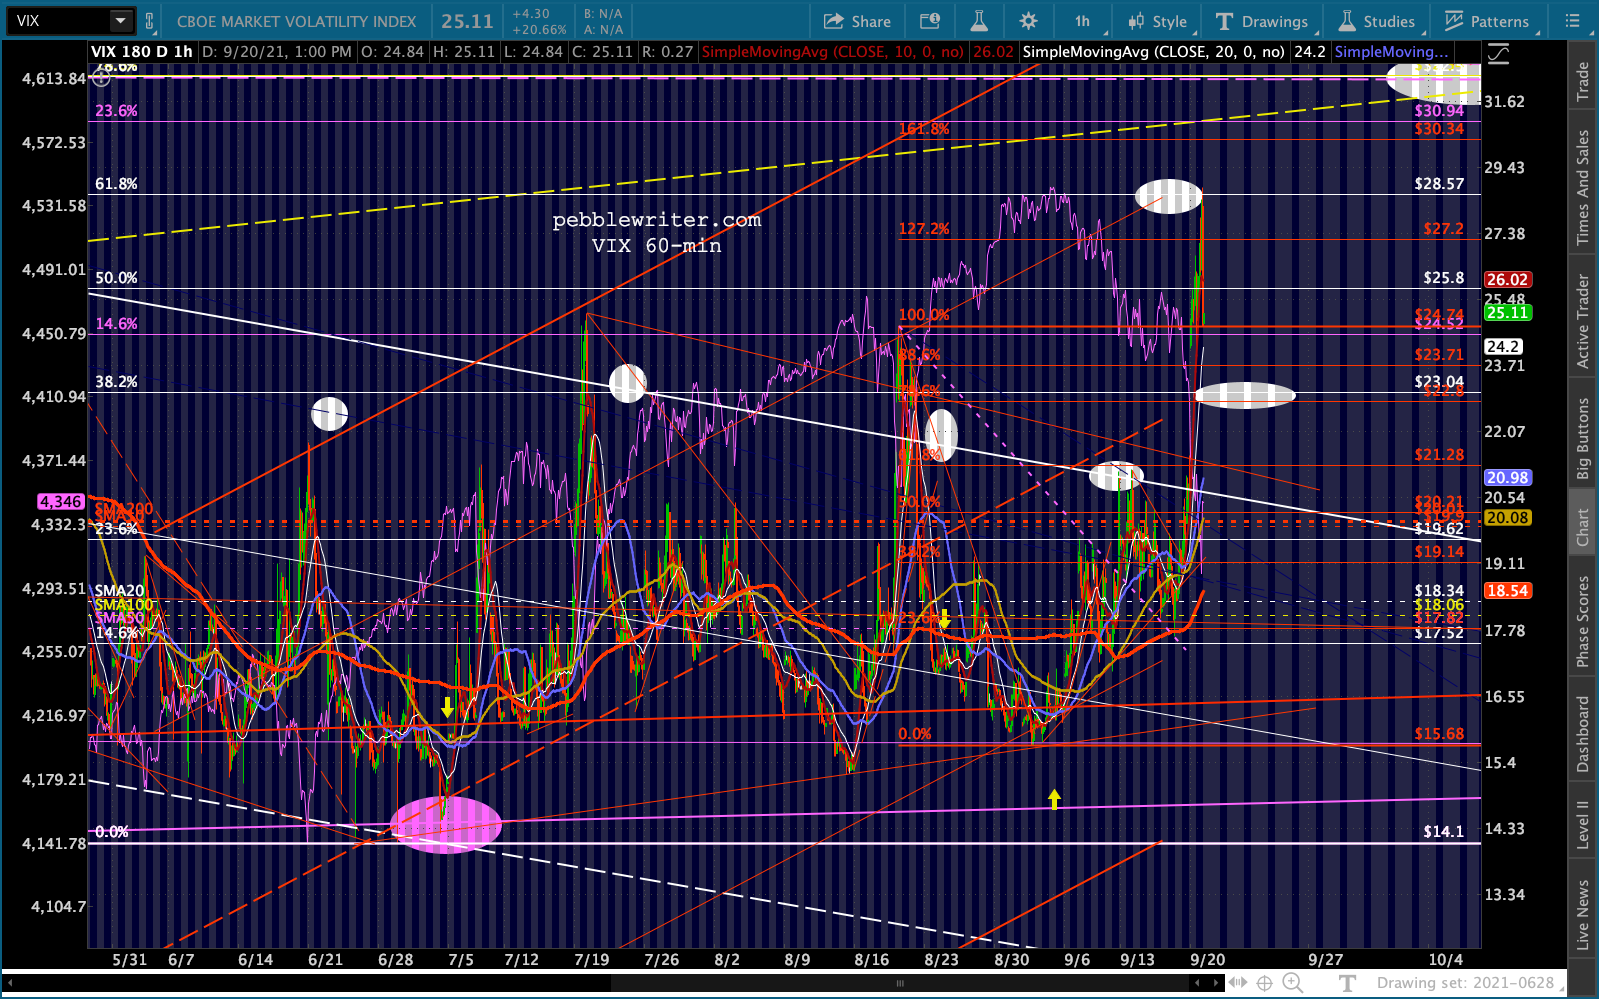
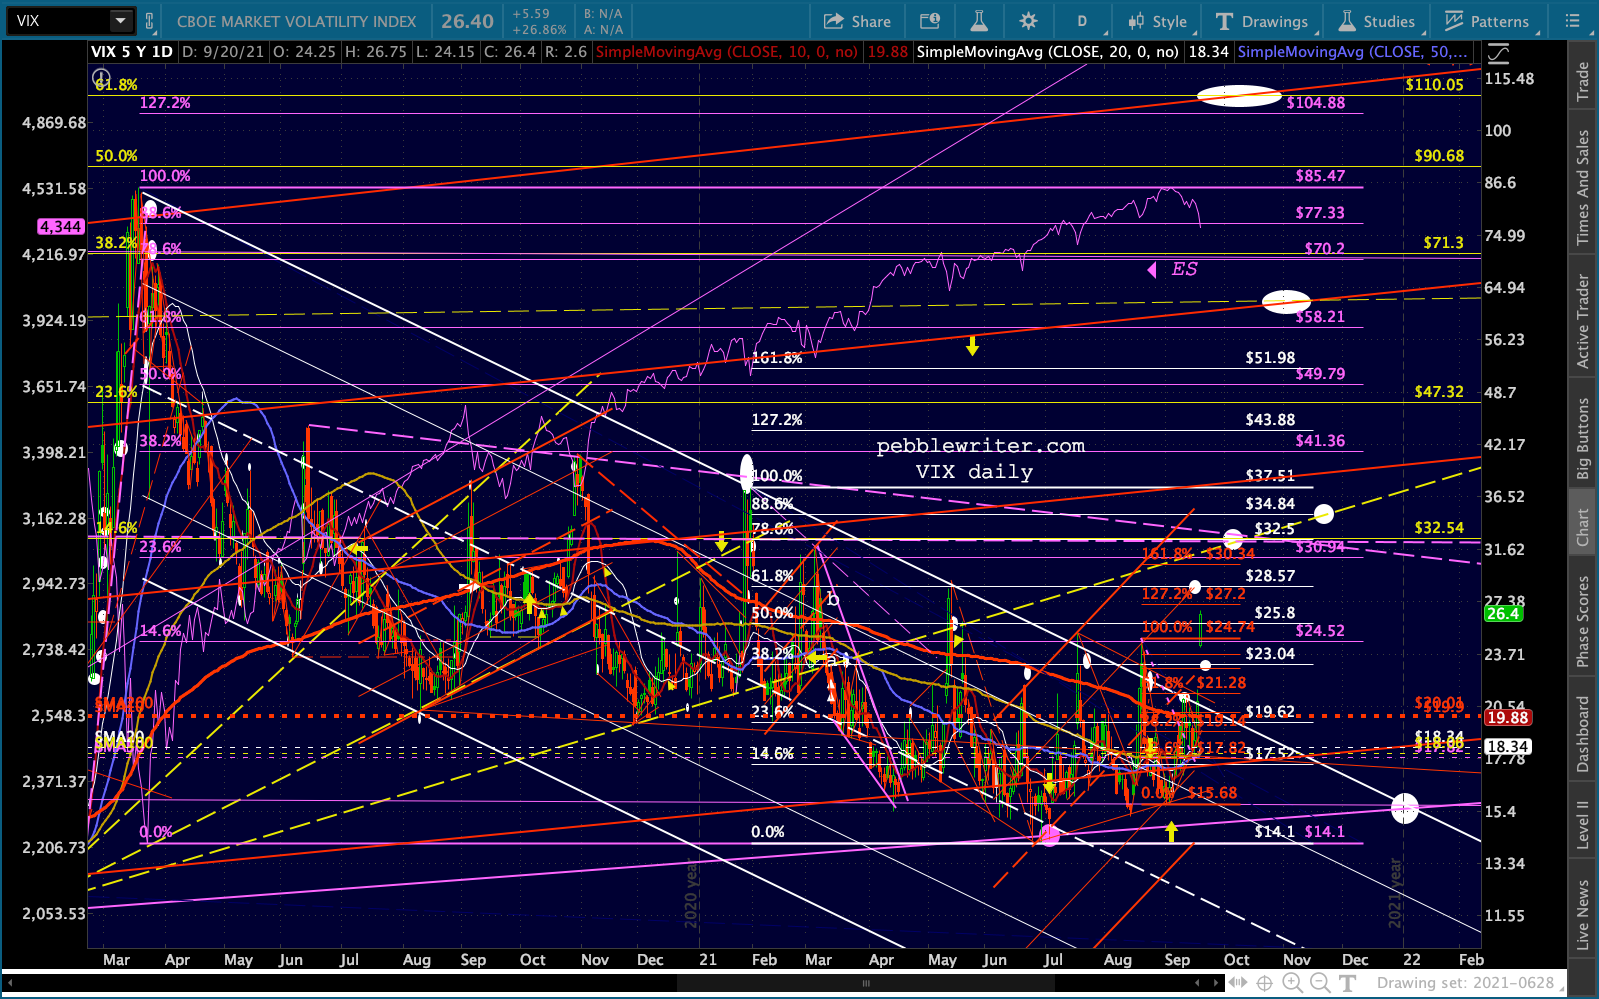
 Why now? As we’ve discussed over and over, VIX’s breakout is a major problem for stocks. And, it’s clearly broken out of the falling white channel which is down at 20.40.
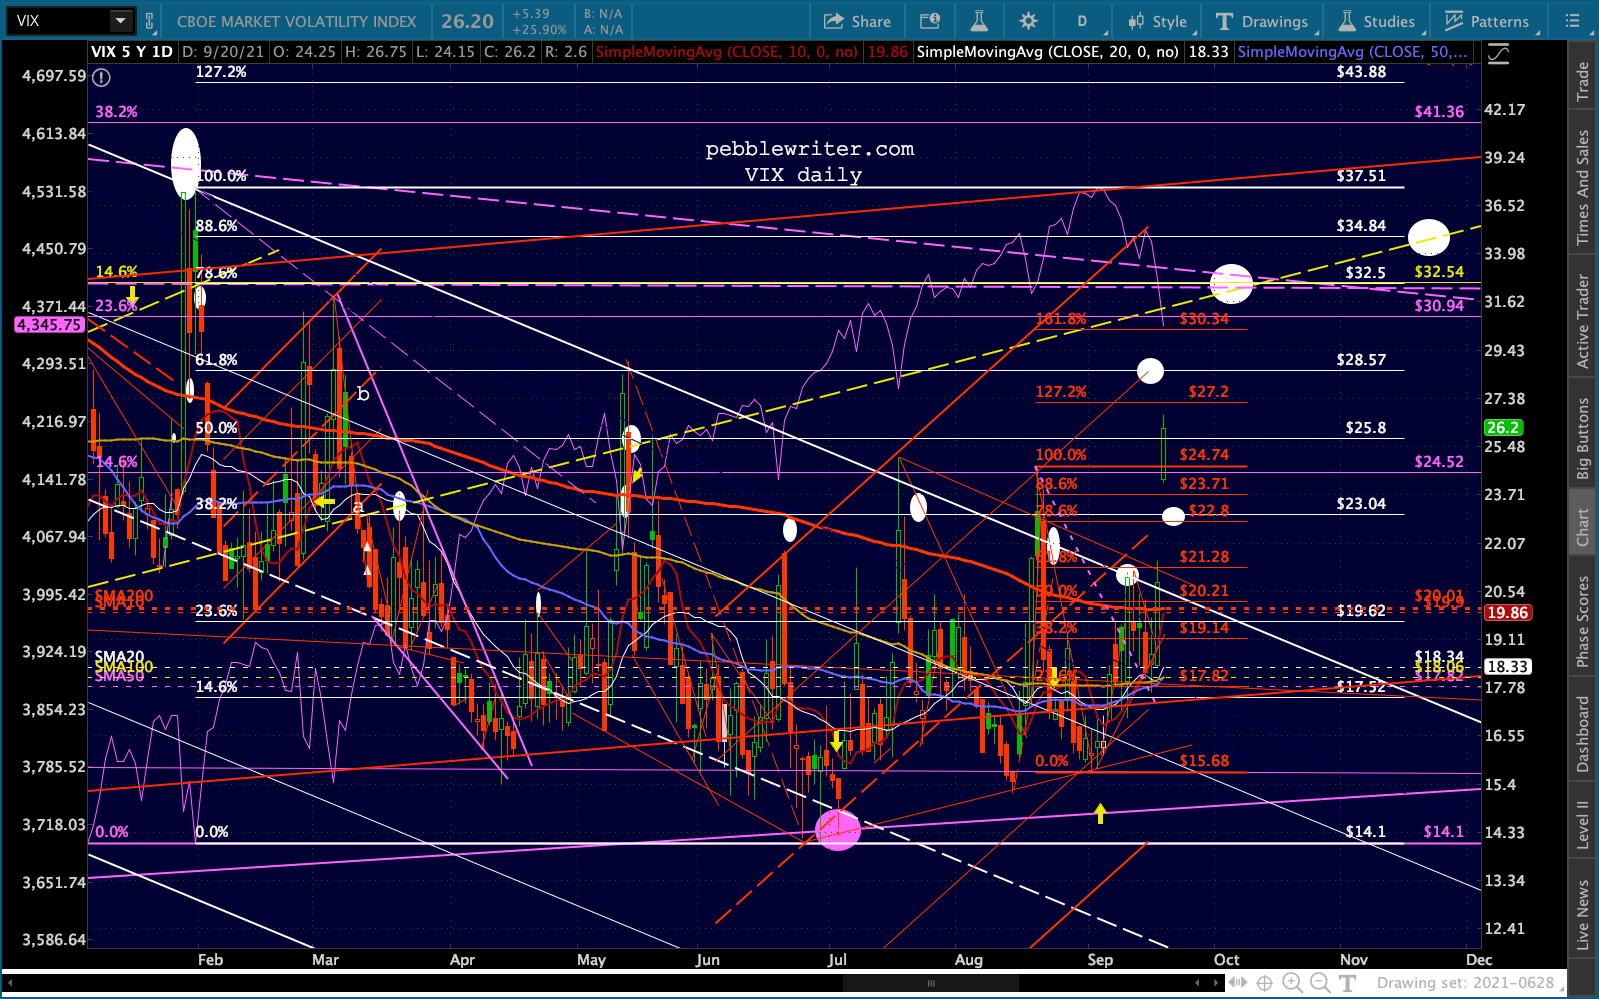
 And, USDJPY, which broke down last week, failed to break out instead of backtest.
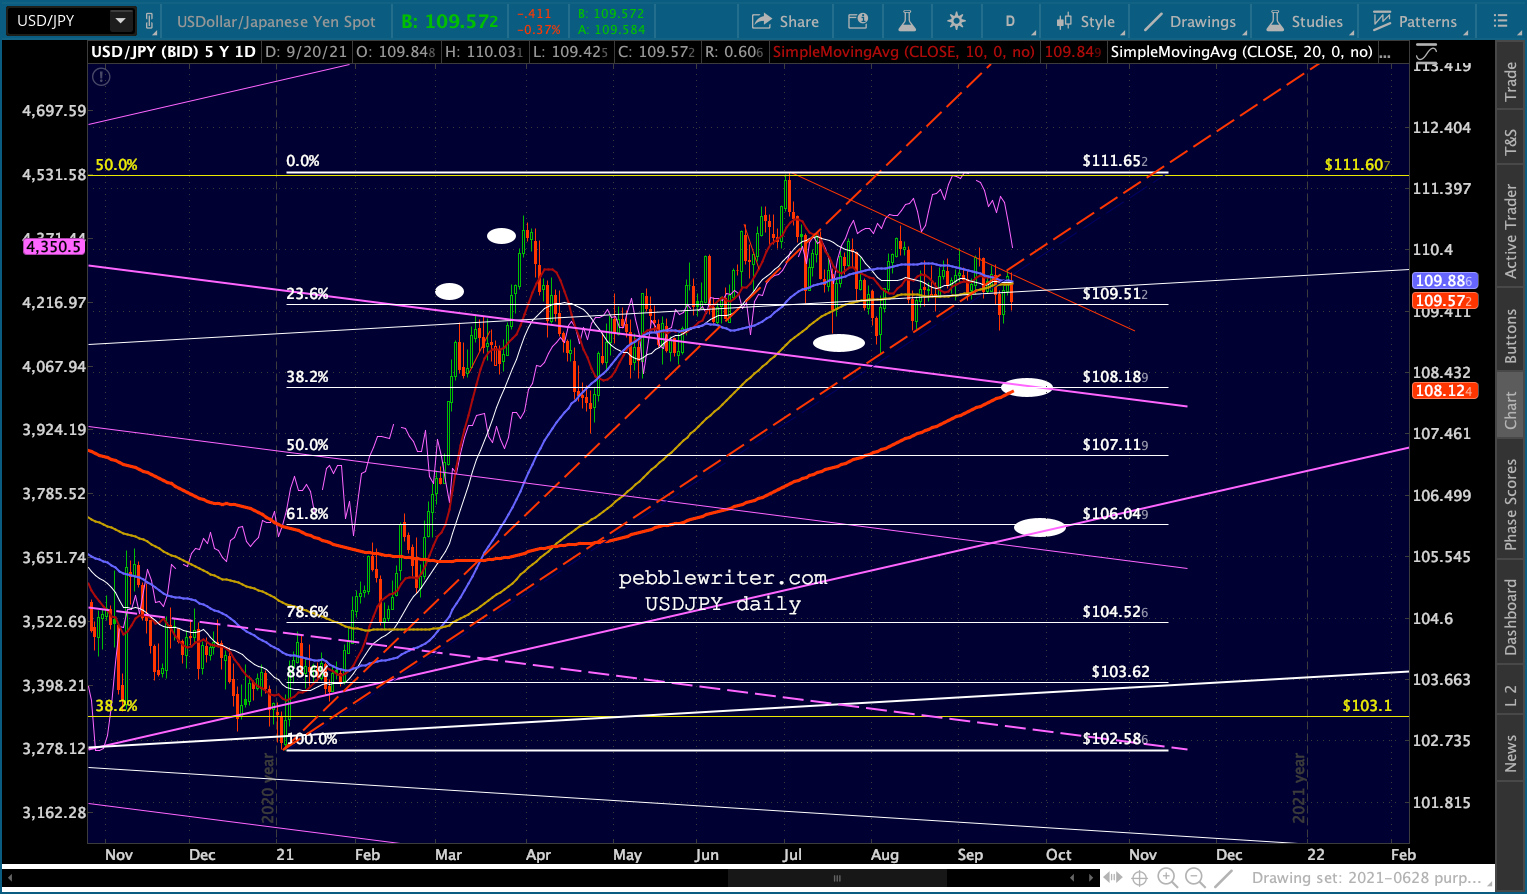 As EURUSD continued its slump…
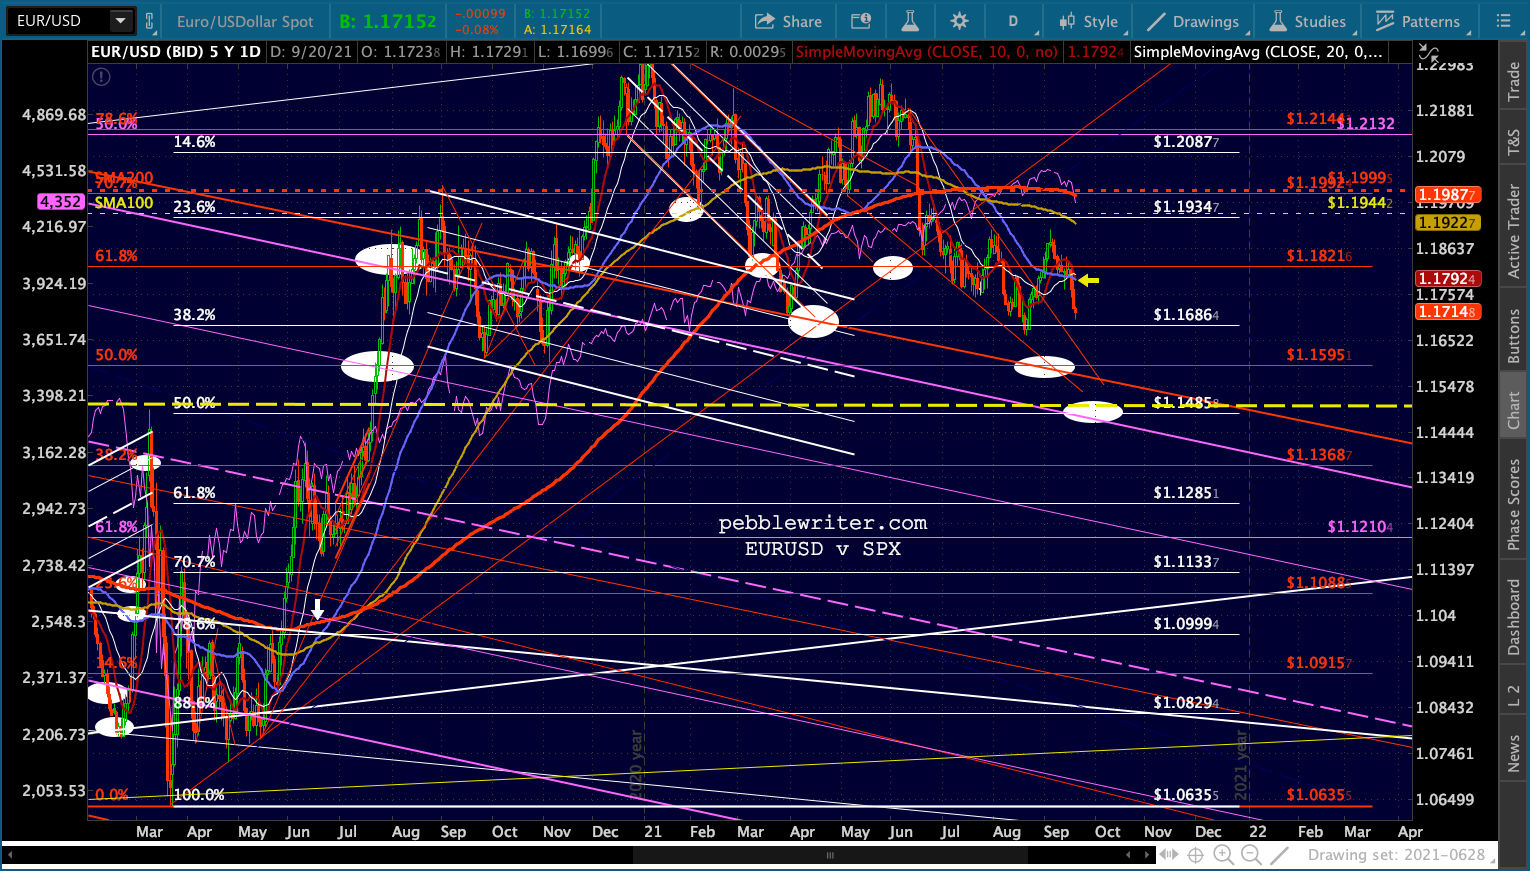 …driving DXY that much closer to a breakout.
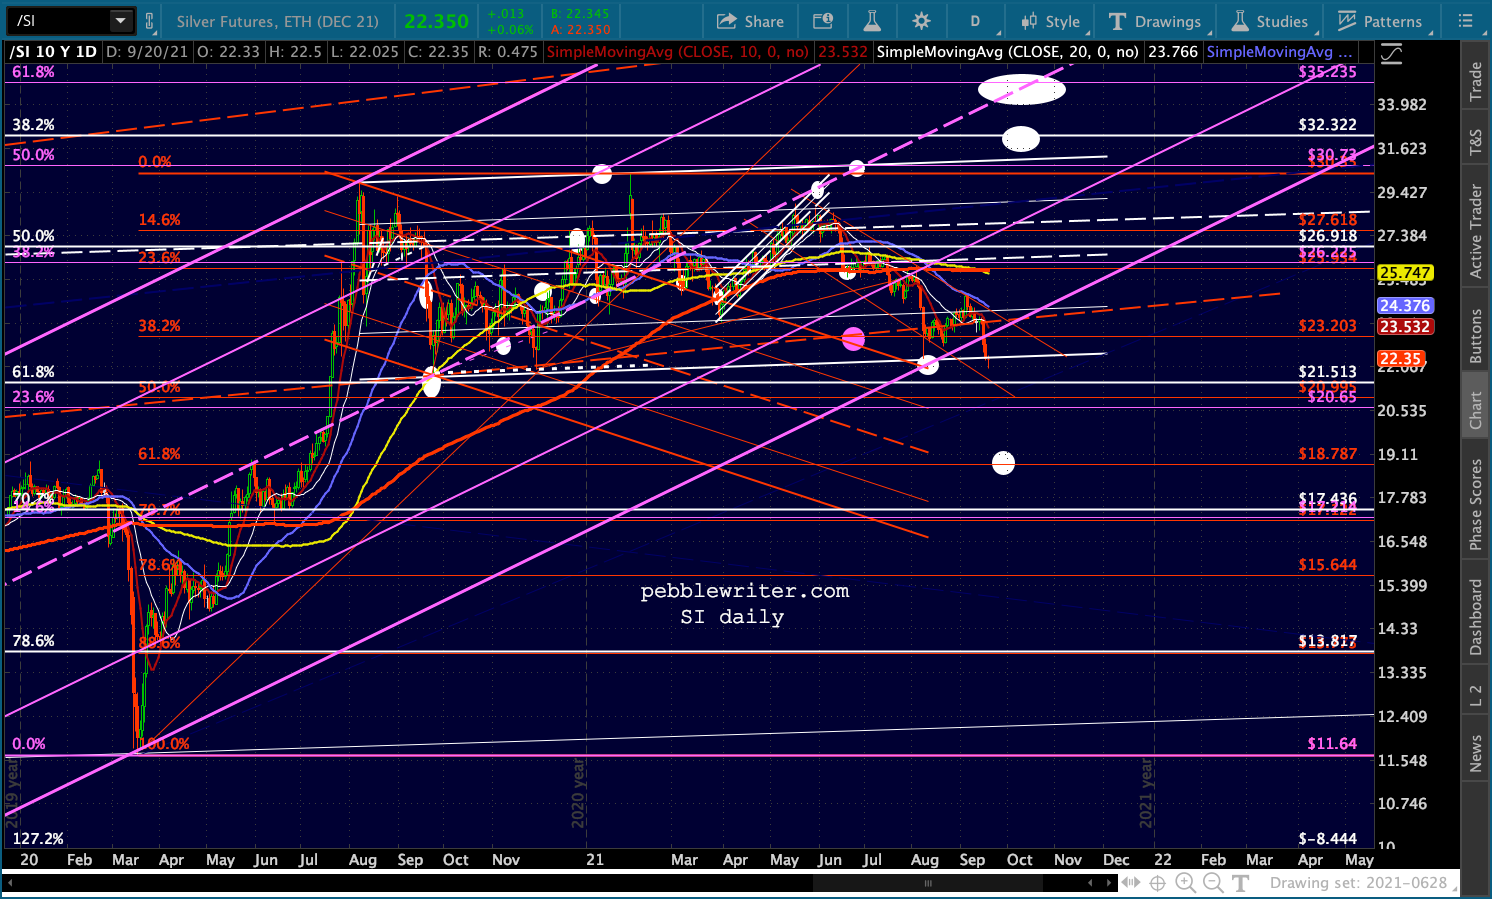
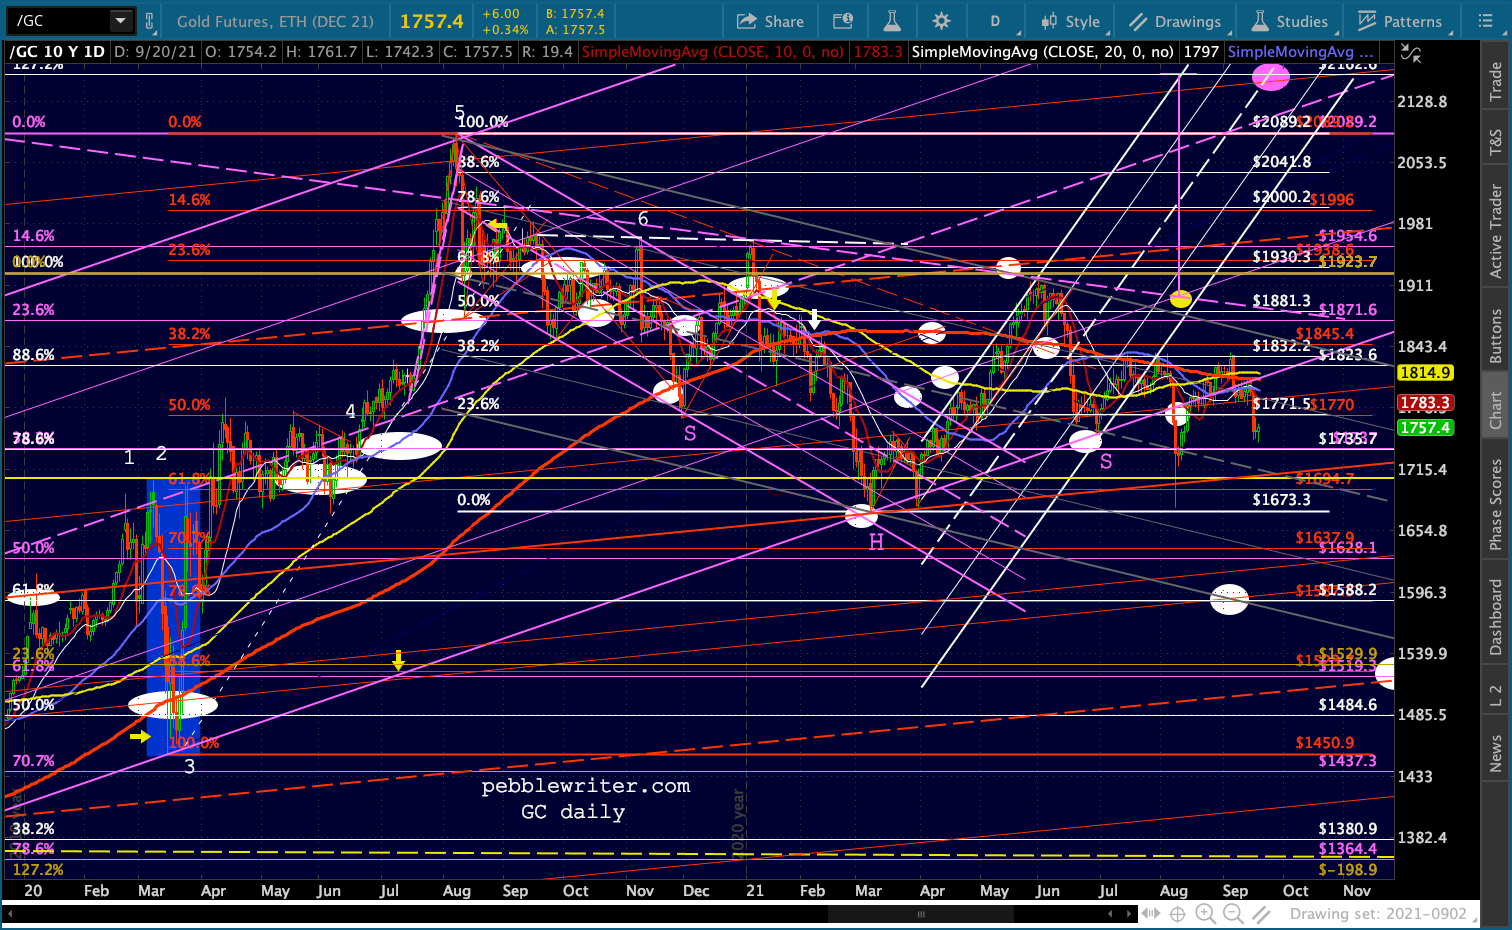
 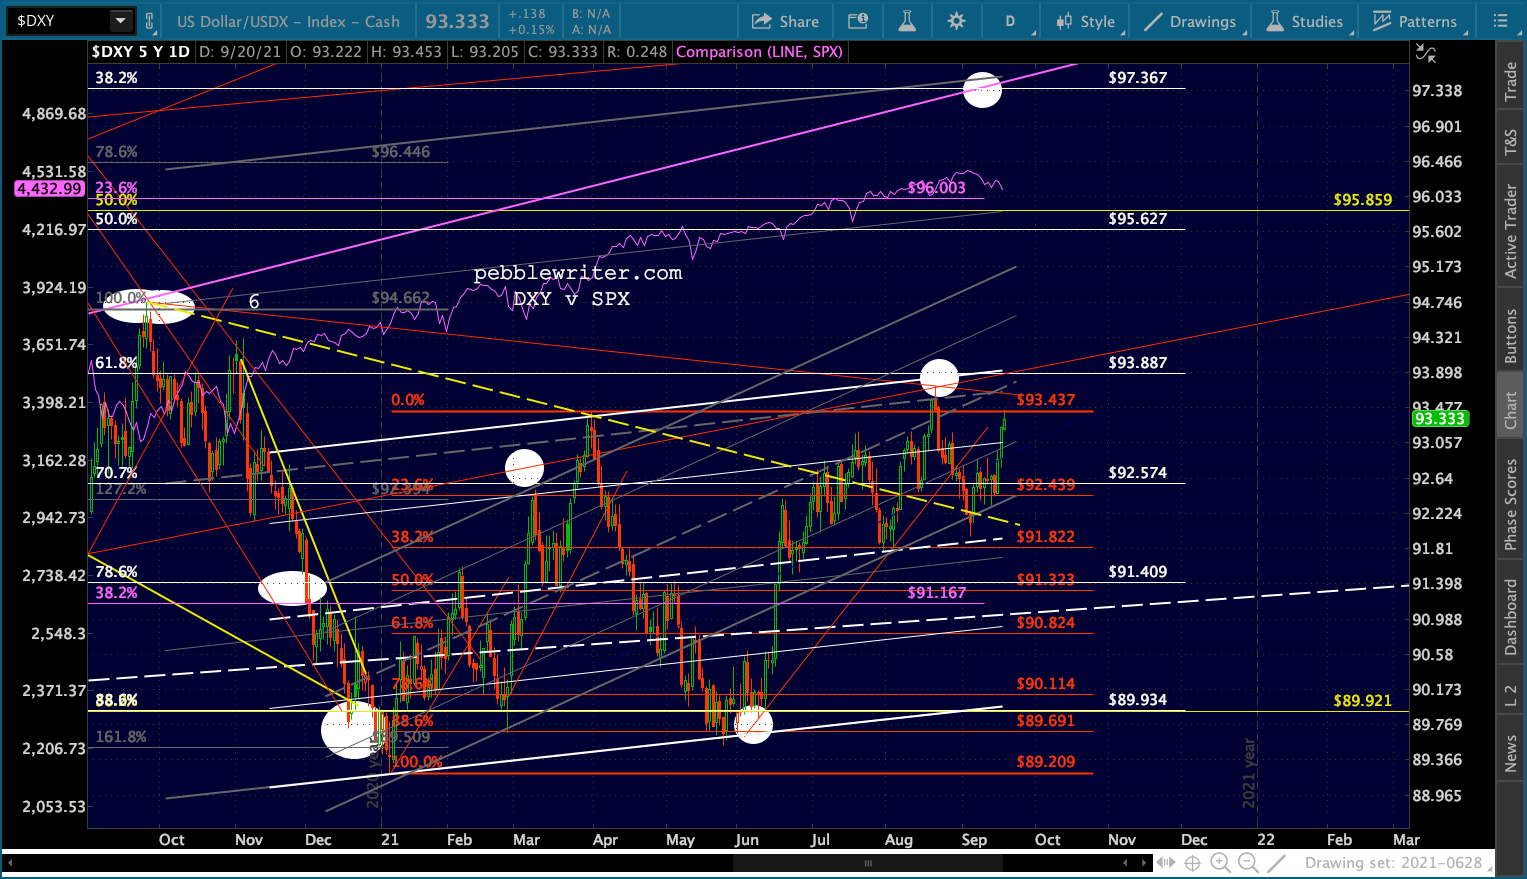 GC and SI are making an effort to hold up, but still look quite vulnerable here.
 And, BTC has reentered its cloud and is testing its black channel midline.
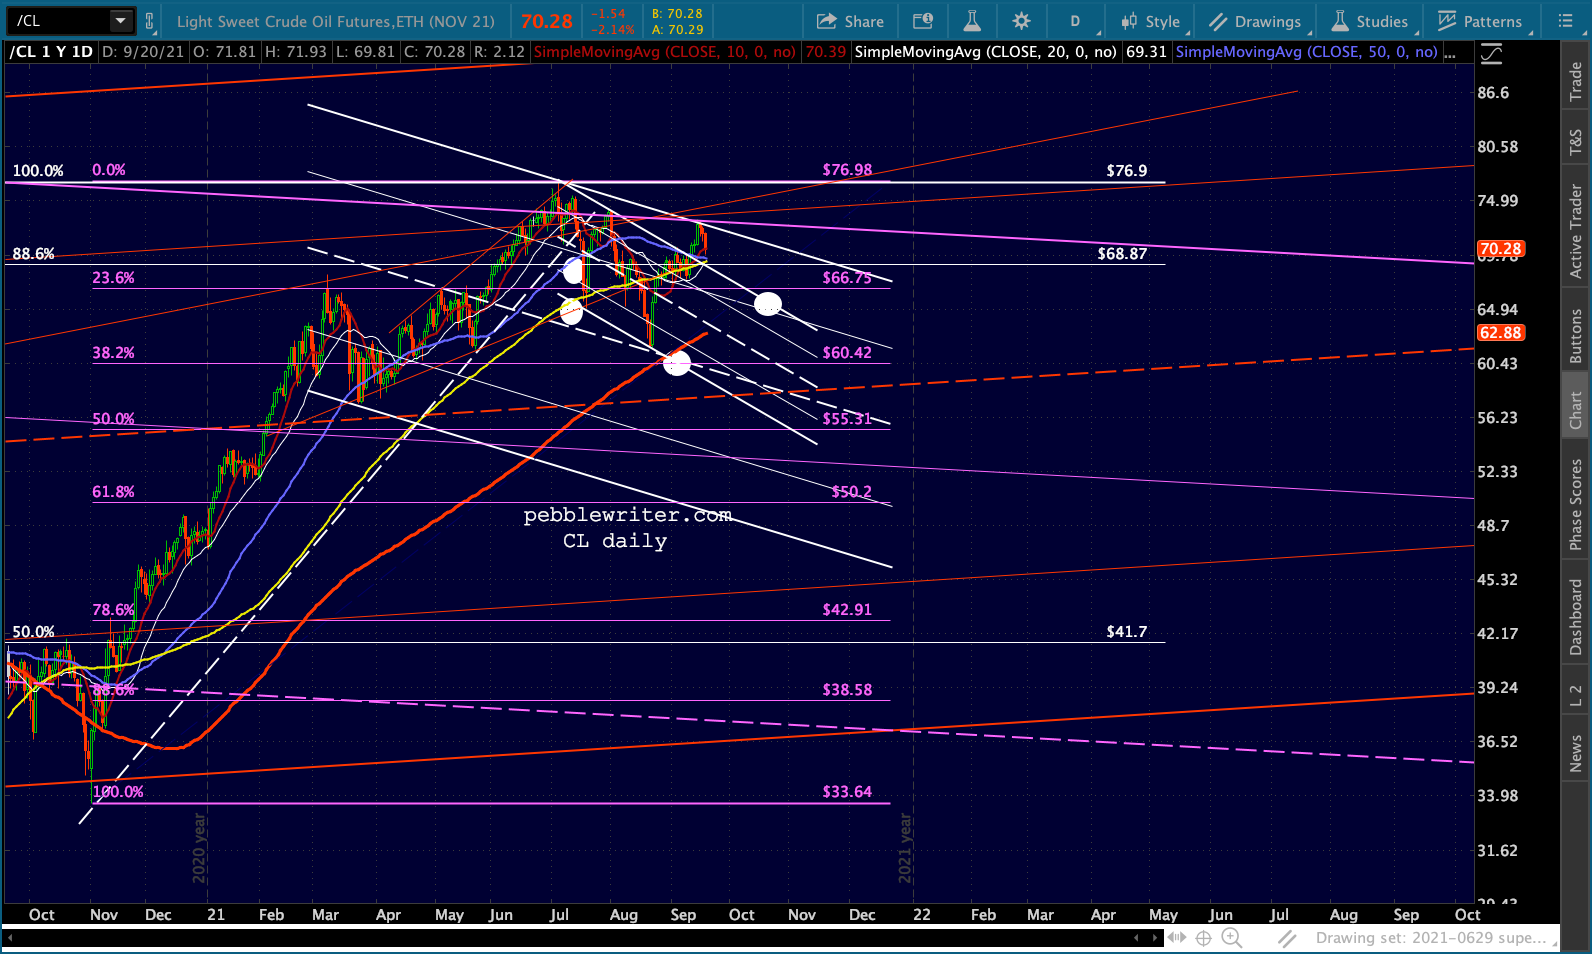
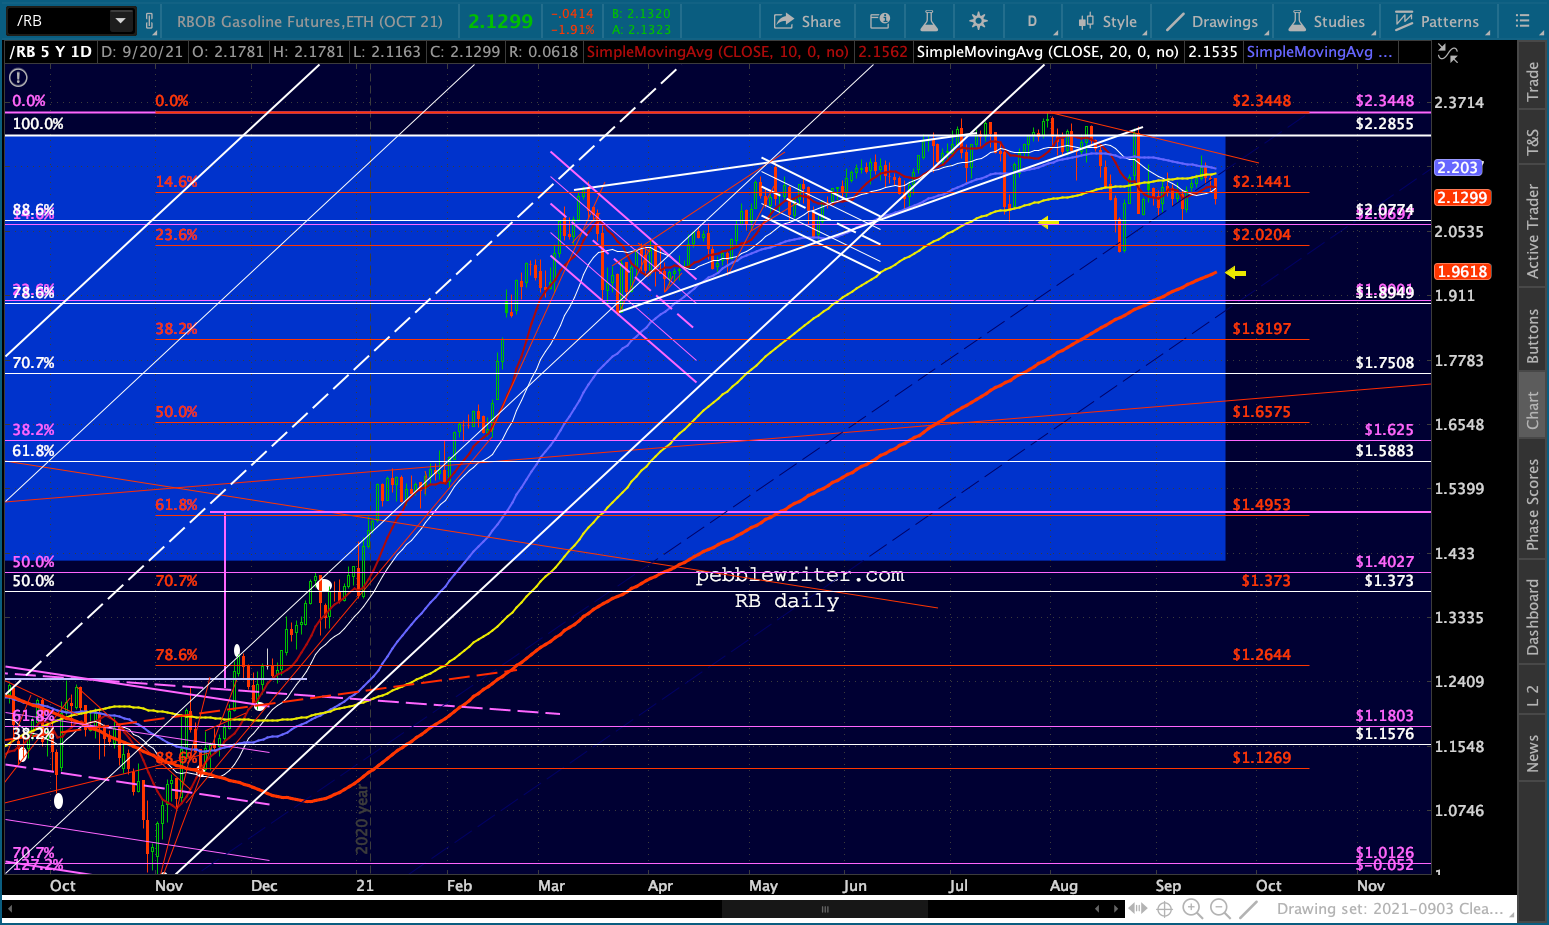
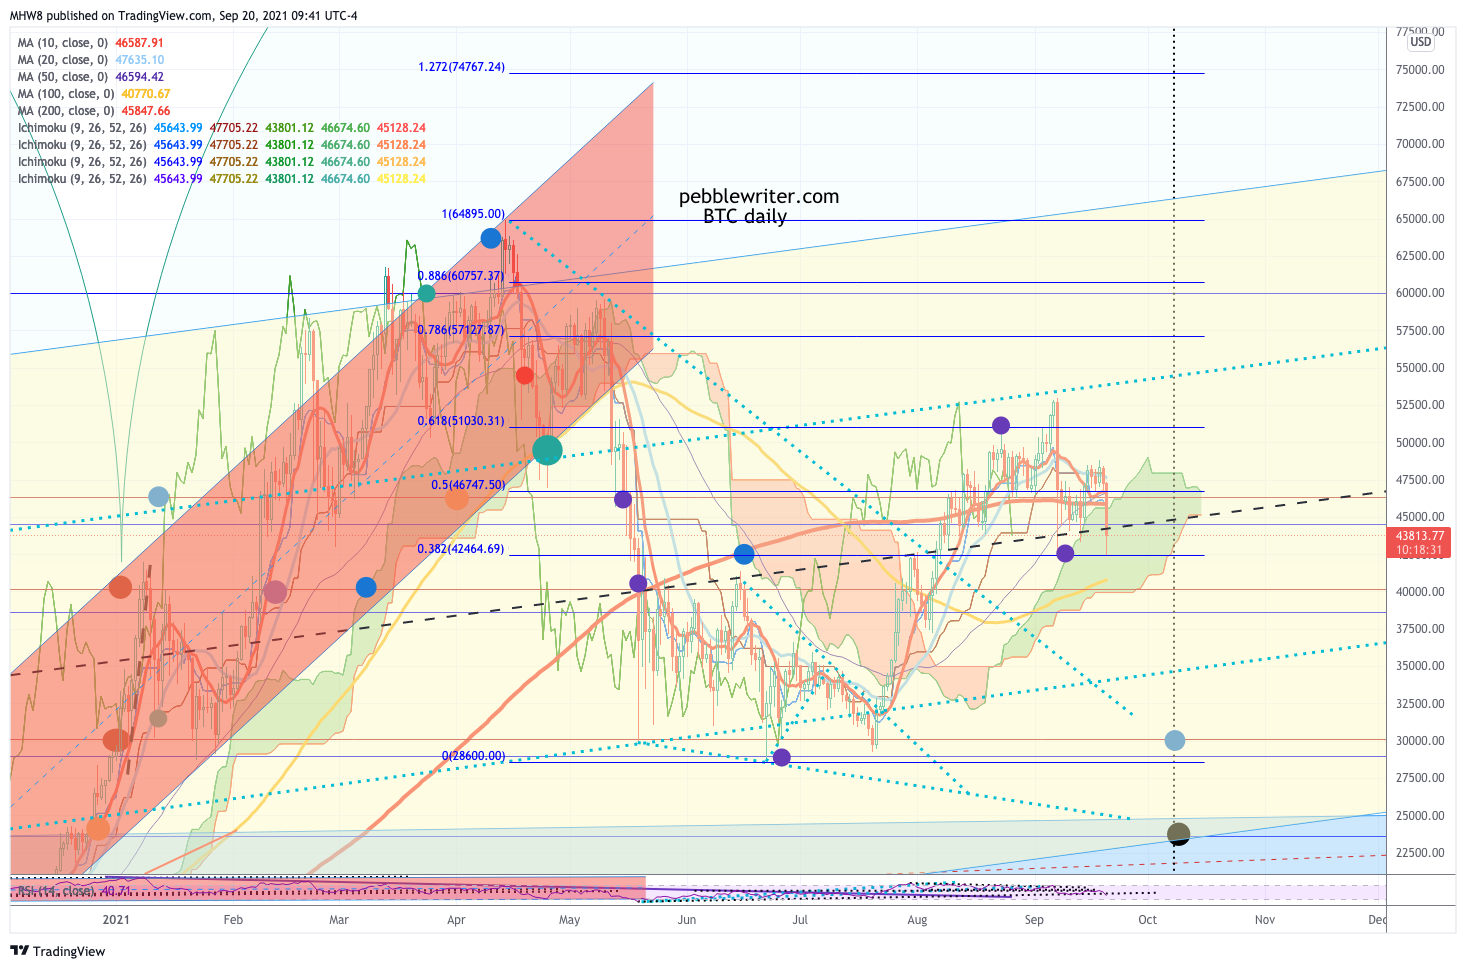 And oil/gas have also continued to decline as expected.
 Keep an eye on VIX, the best indicator of how committed TPTB are to moderating this selloff.
Last, I saw a chart on a popular website emphasizing how commodity prices were about to break out. I understand the sentiment behind this thinking, as I started sounding the alarm about spiking inflation over a year ago.
As logical as a breakout in inflation might seem, the fact that oil prices have likely topped out should act to moderate headline CPI data. And, we know from past experience that the Fed will do what it can/must to avoid losing control of inflation. I think they are very familiar with charts like the one below and will move heaven and earth to prevent a breakout.
 UPDATE: 3:13 PM
Getting pretty darned close… We should at least get a bounce here, ideally to backtest something significant like the purple midline at 4335 or the former low at 4347.
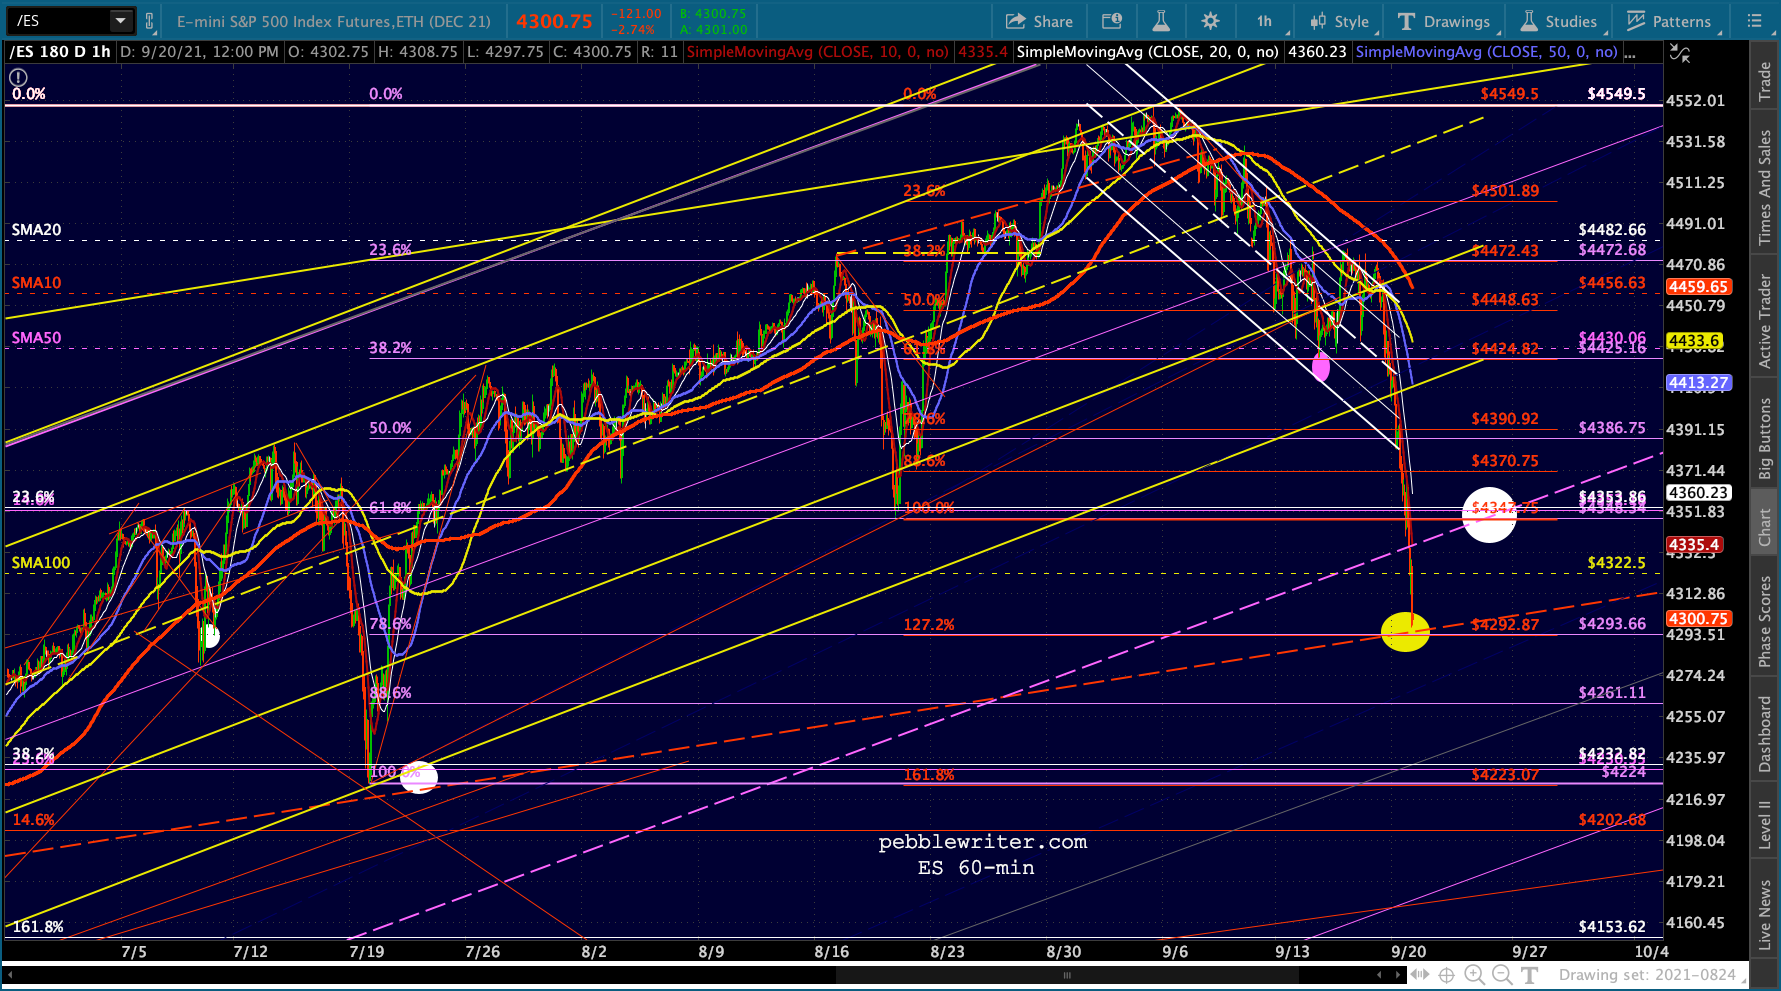
 Remember, a butterfly or crab pattern involves a bounce at the .786 Fib and ultimately extends to the 1.272 or 1.618 extension. In ES’ case, the purple 1.272 would be 4135.46, which is where the SMA200 should be in mid-October (probably right after OPEX.)
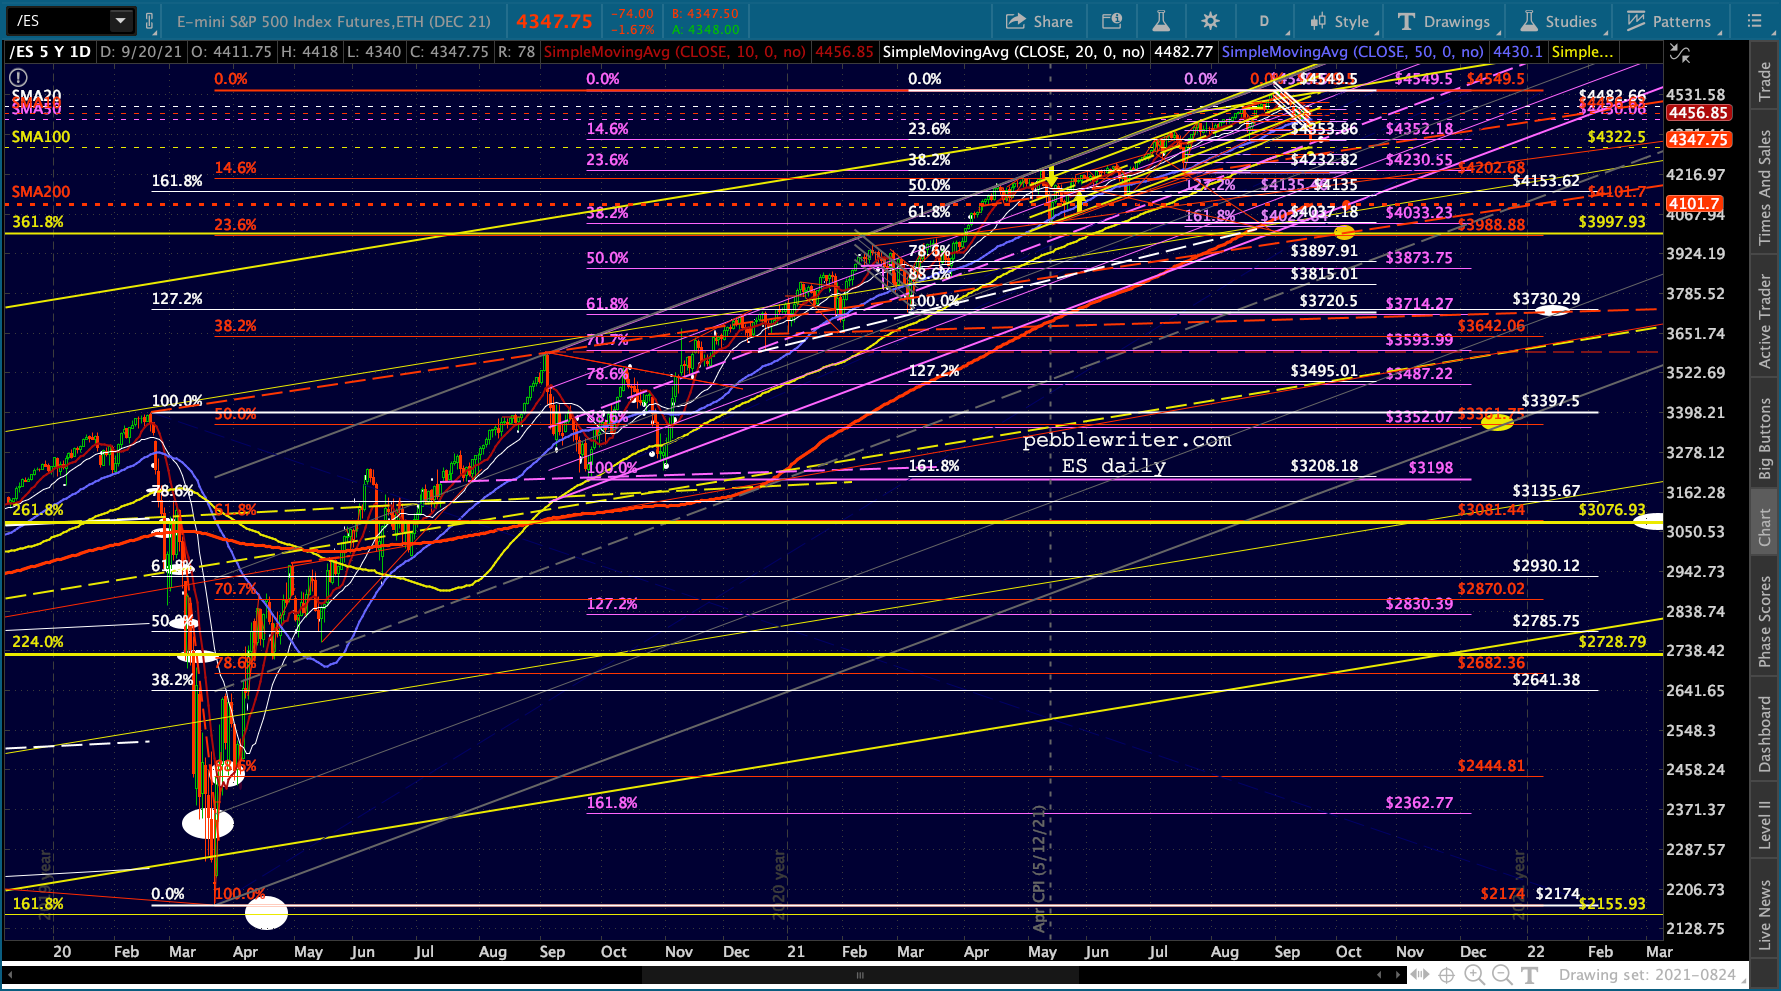
UPDATE: EOD
Two possible paths…