

The ECB will reduce its purchases of bonds under its $2 trillion Pandemic Emergency Purchase Programme (PEPP) enacted last year. There’s no word on exactly how much it will reduce its purchases, nor any word on whether the slowdown will continue past the initial stage.
But, it was very entertaining listening to CNBC’s Steve Liesman trip all over his tongue while trying to avoid the word “taper,” delving into semantics when Joe Kernen pointedly asked how this wasn’t a taper.
The euro barely rallied on the “news.” ES, which had already bounced off its 20-DMA hours earlier, essentially yawned.
 Given that they’re one of the most important elements of central banks’ algo signaling, this seems like a good time to do a deep dive on currency pairs.
continued for members…
First, the bigger picture for equities this morning…
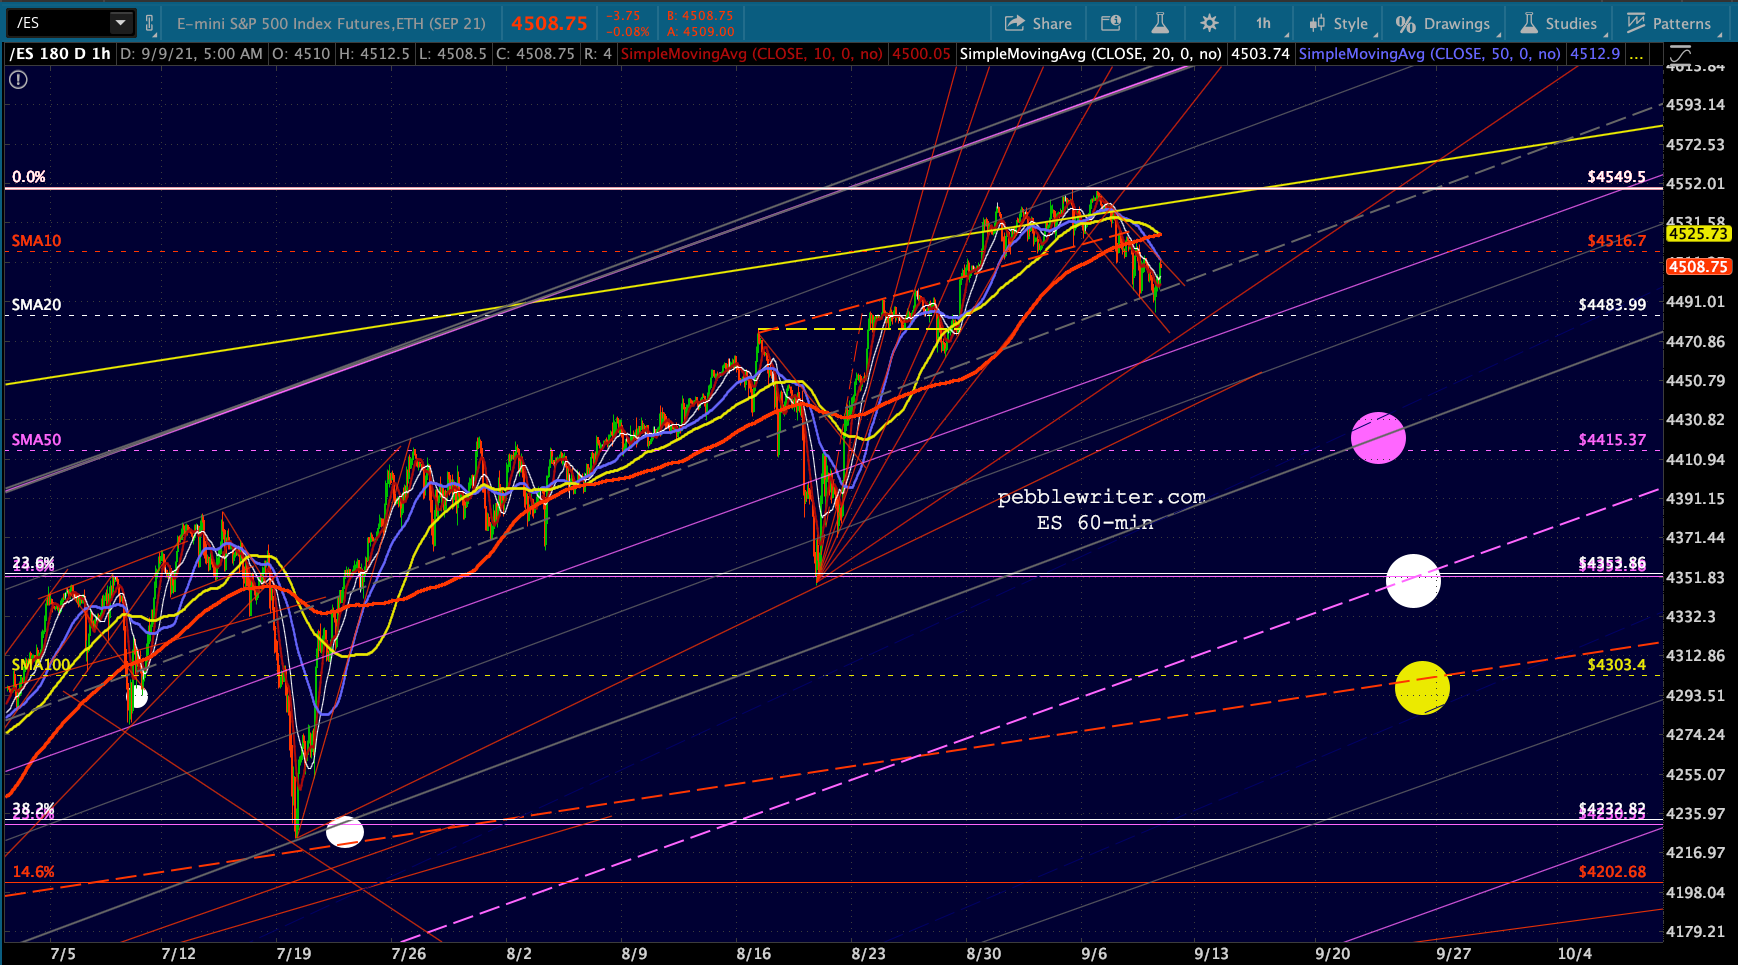
ES is threatening to break out of the little falling channel it has constructed over the past few days. Probably a head fake.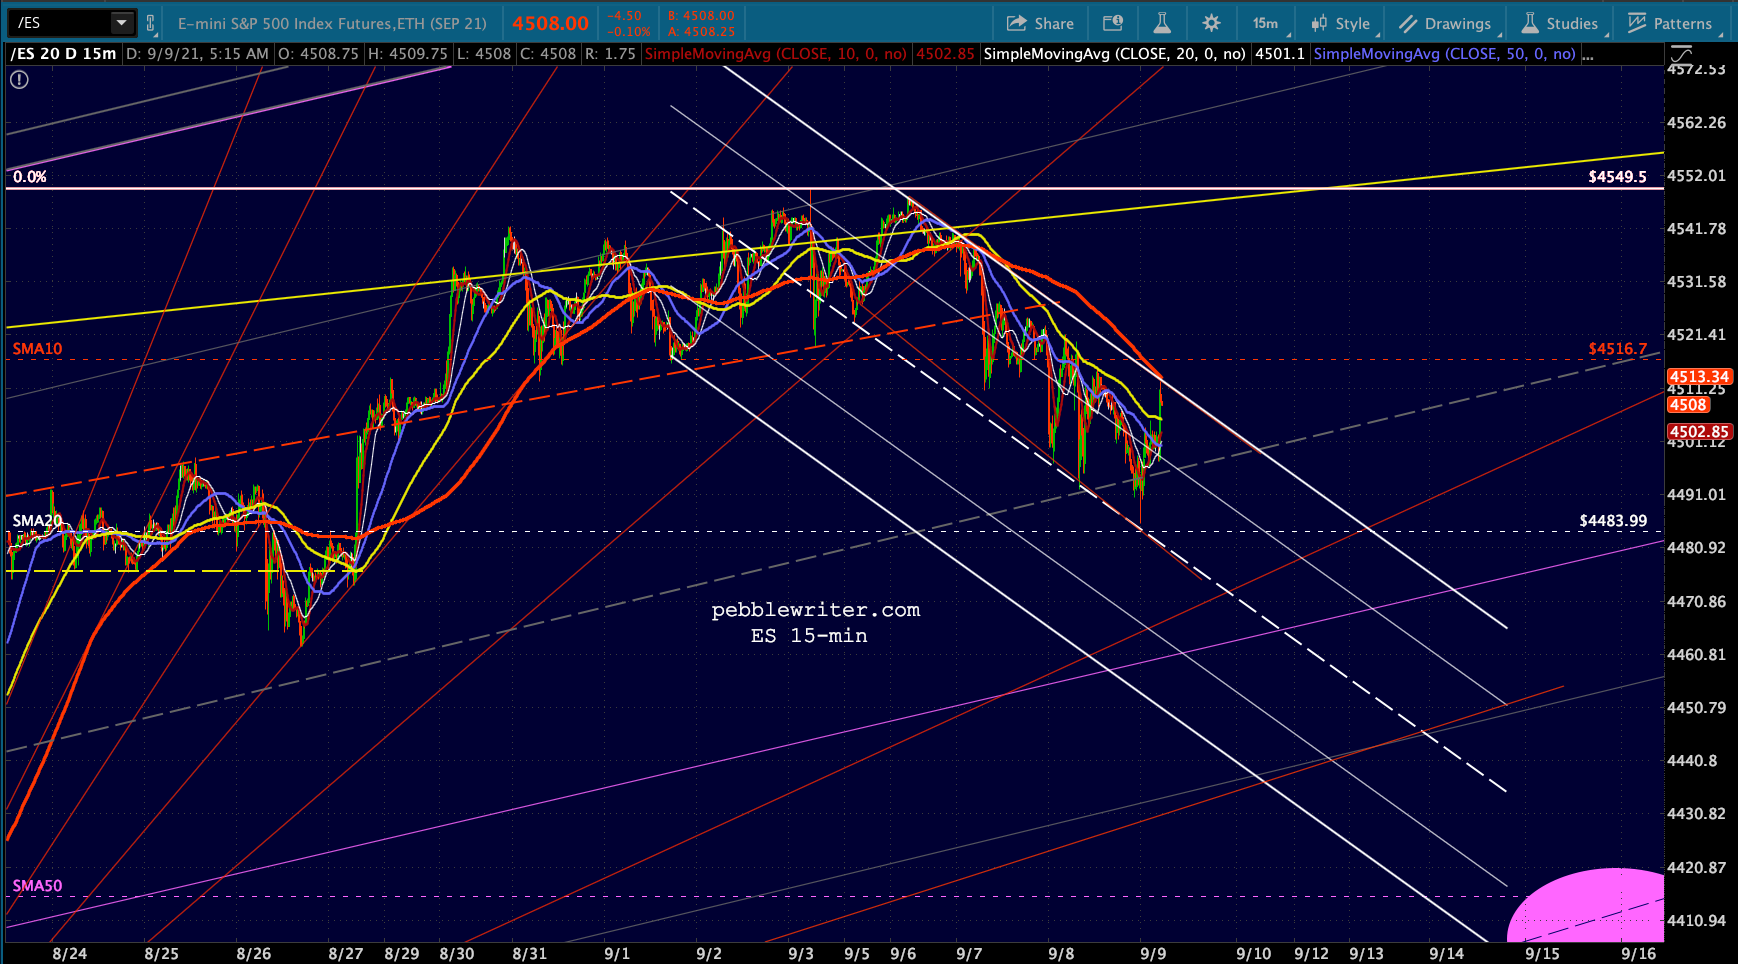
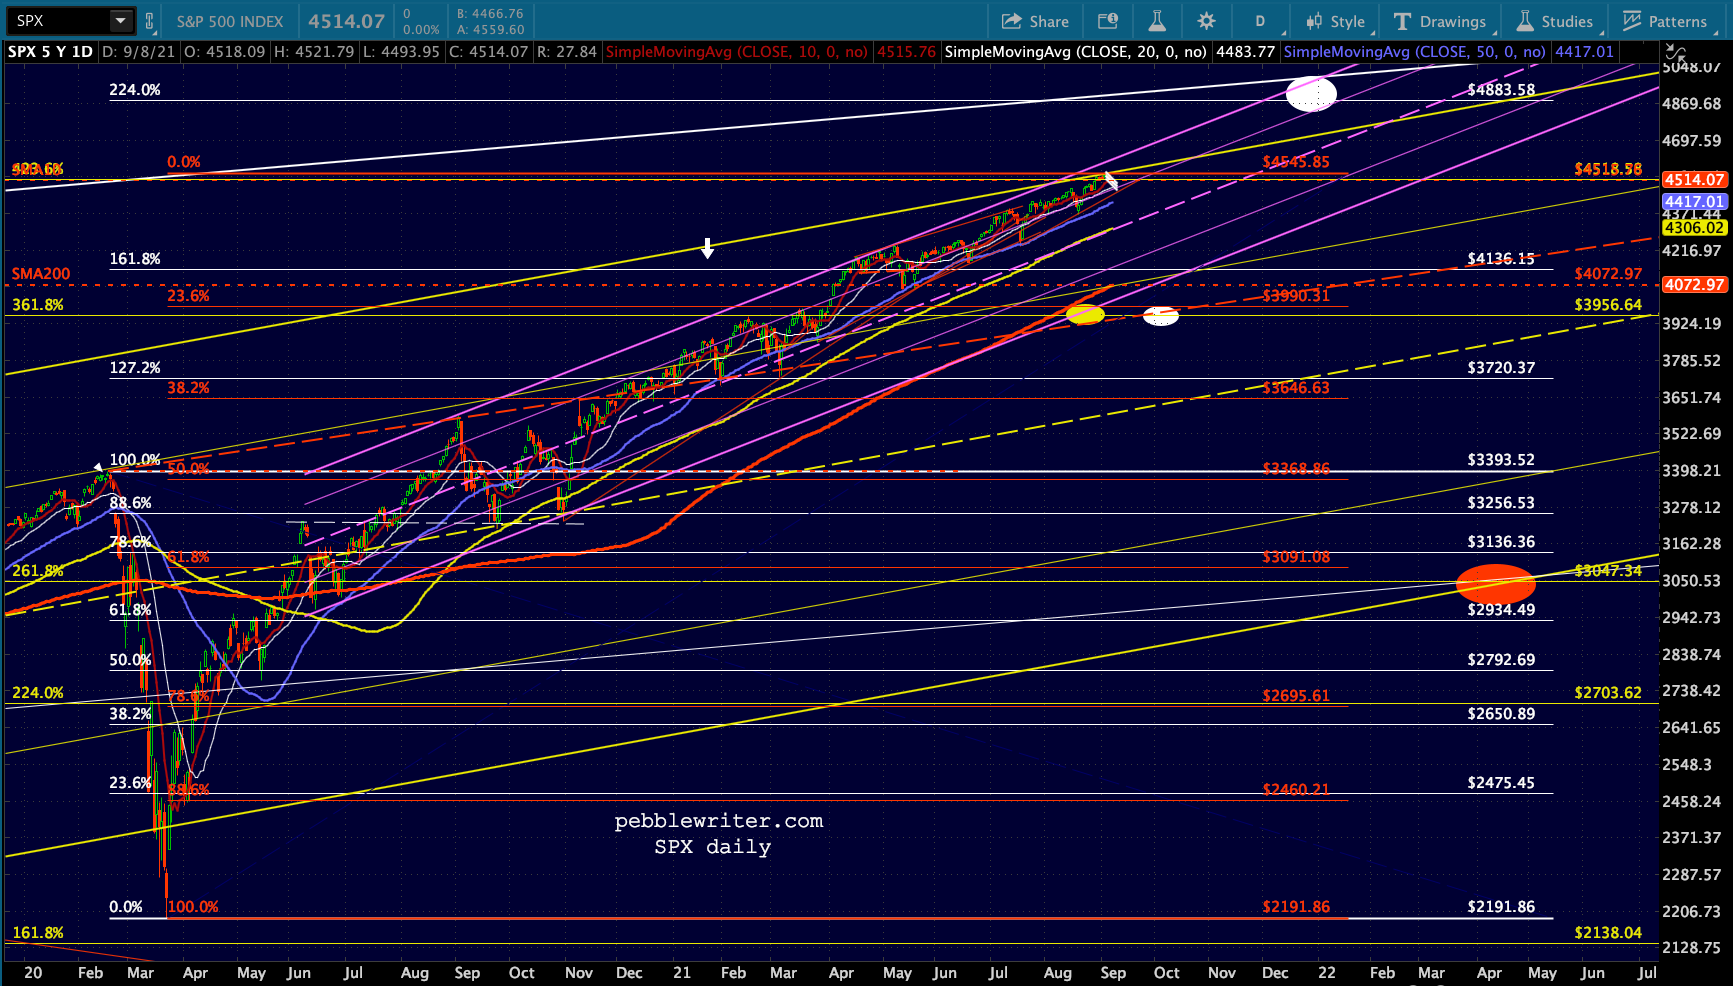
 While SPX is now well past the optimal point for a retreat to its 3.618 Fib extension.
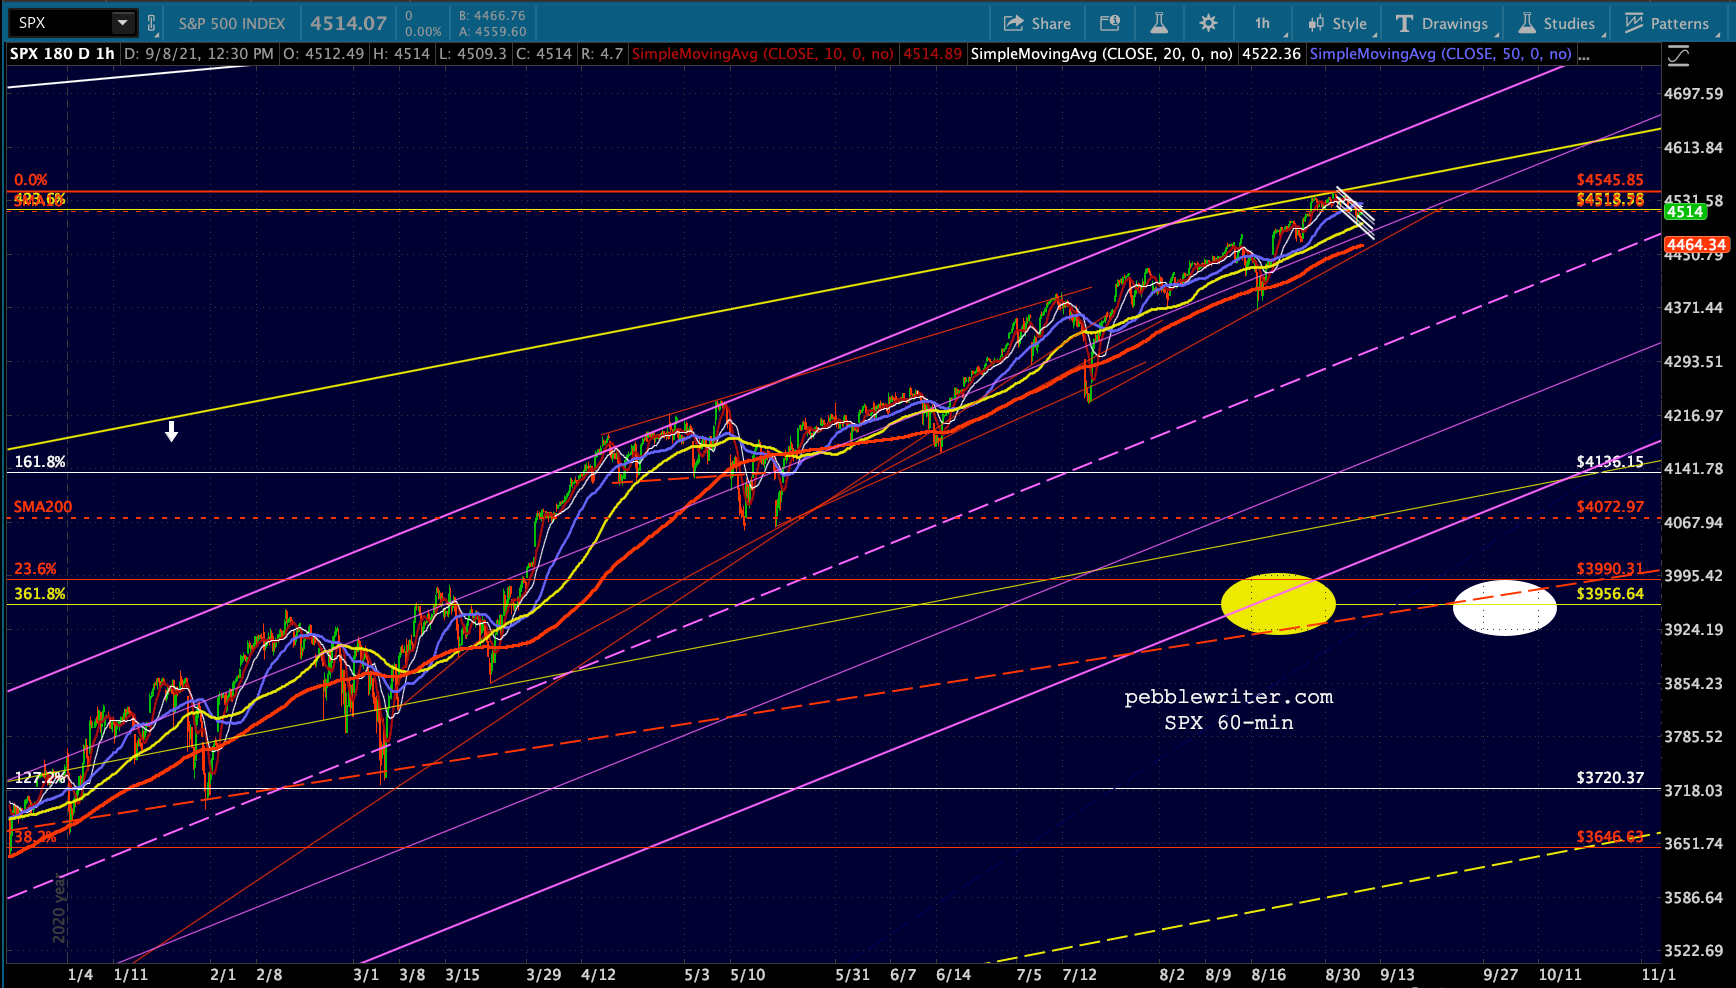
 But, note the TL resistance and negative divergence on SPX’s RSI…
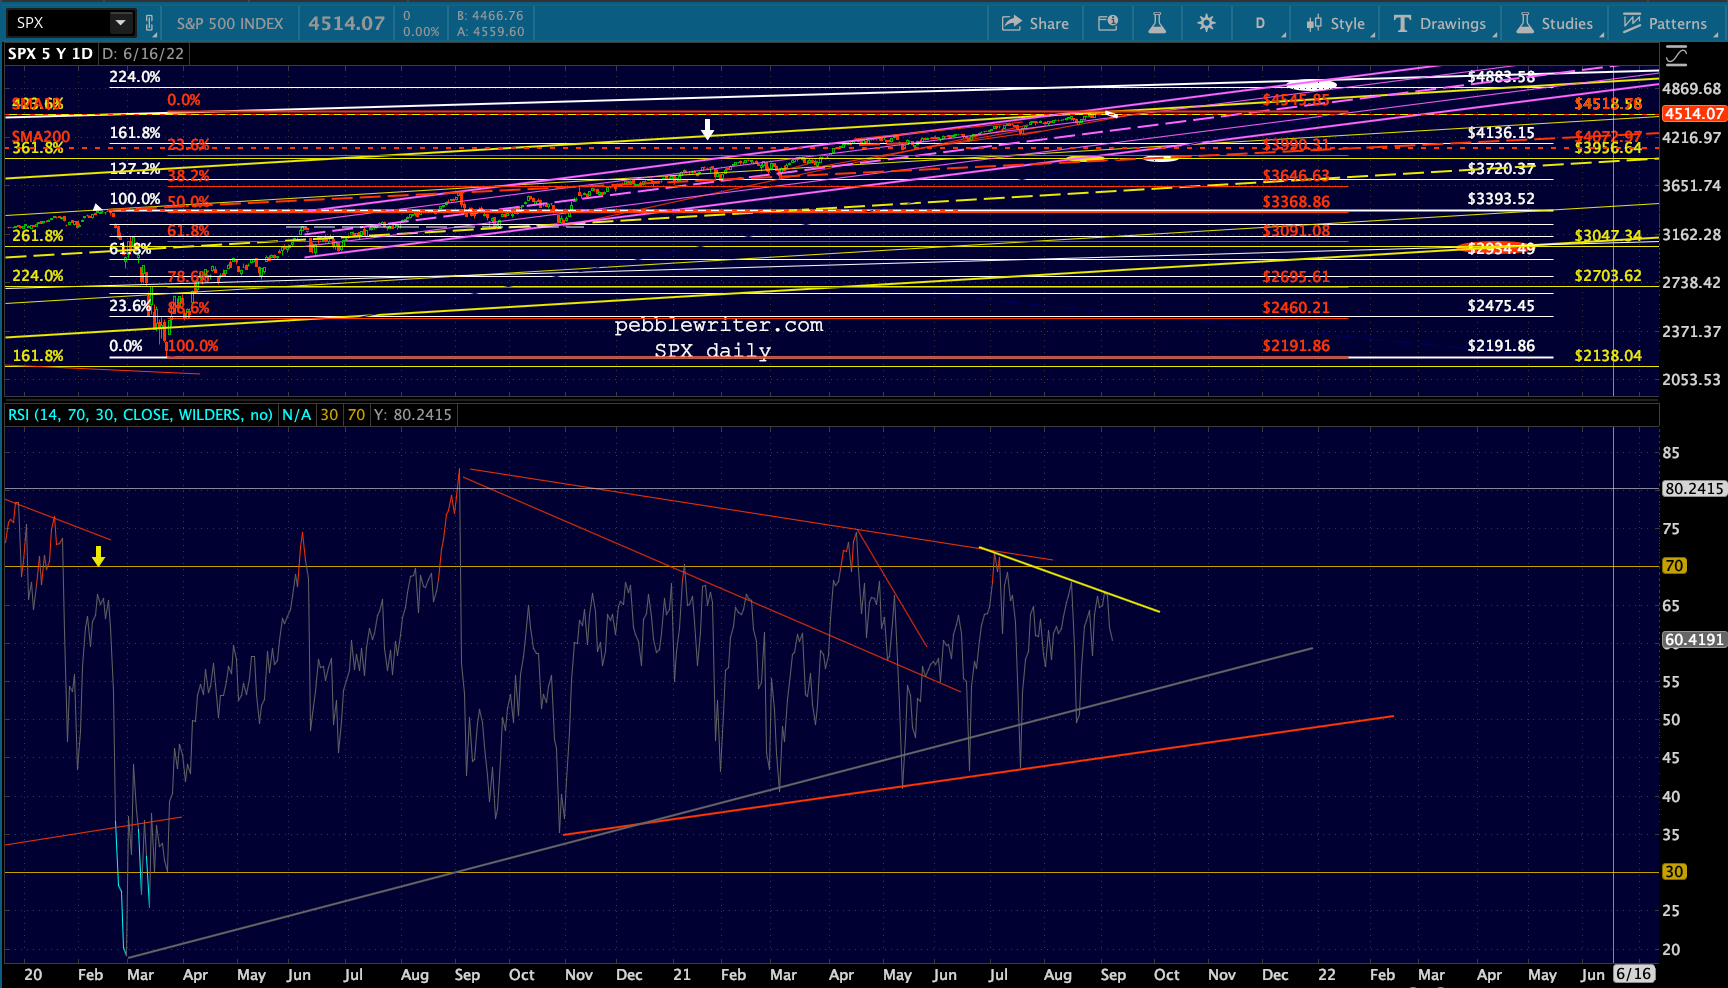 …not to mention the failure to break out on its MCO.
 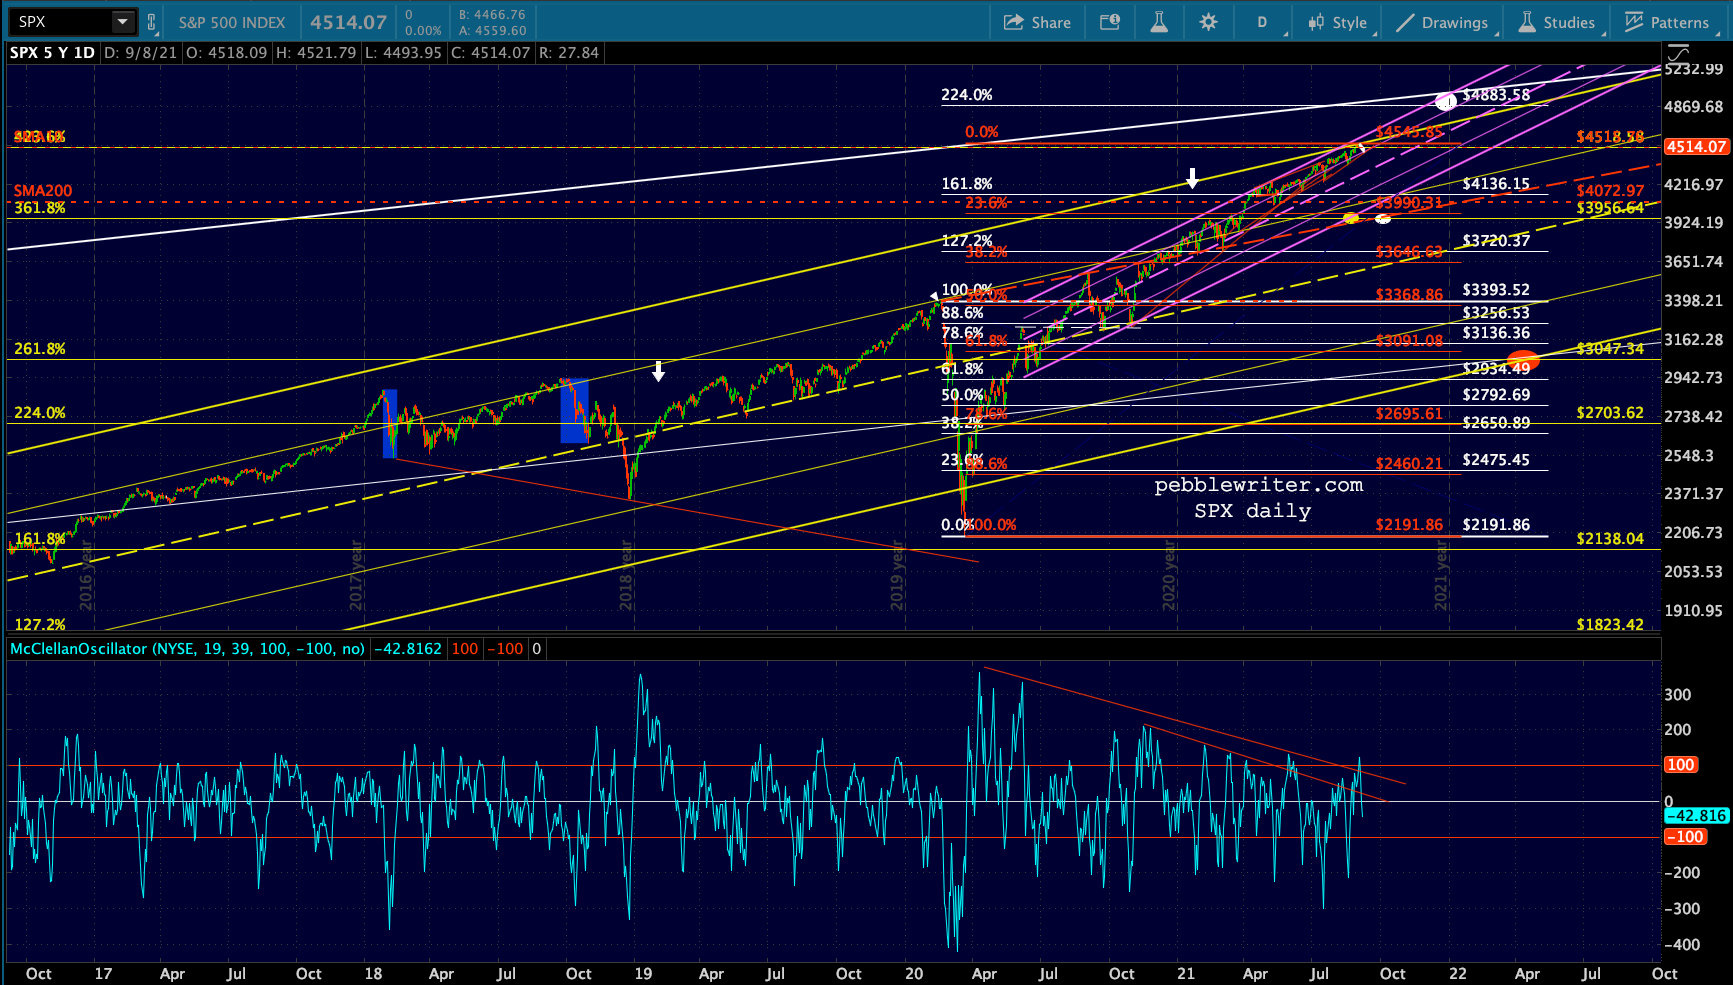 VIX is still very much in the drivers’ seat, with a very simple dip below the SMA100 at 17.87 all that stands in the way of busting ES’ falling channel.
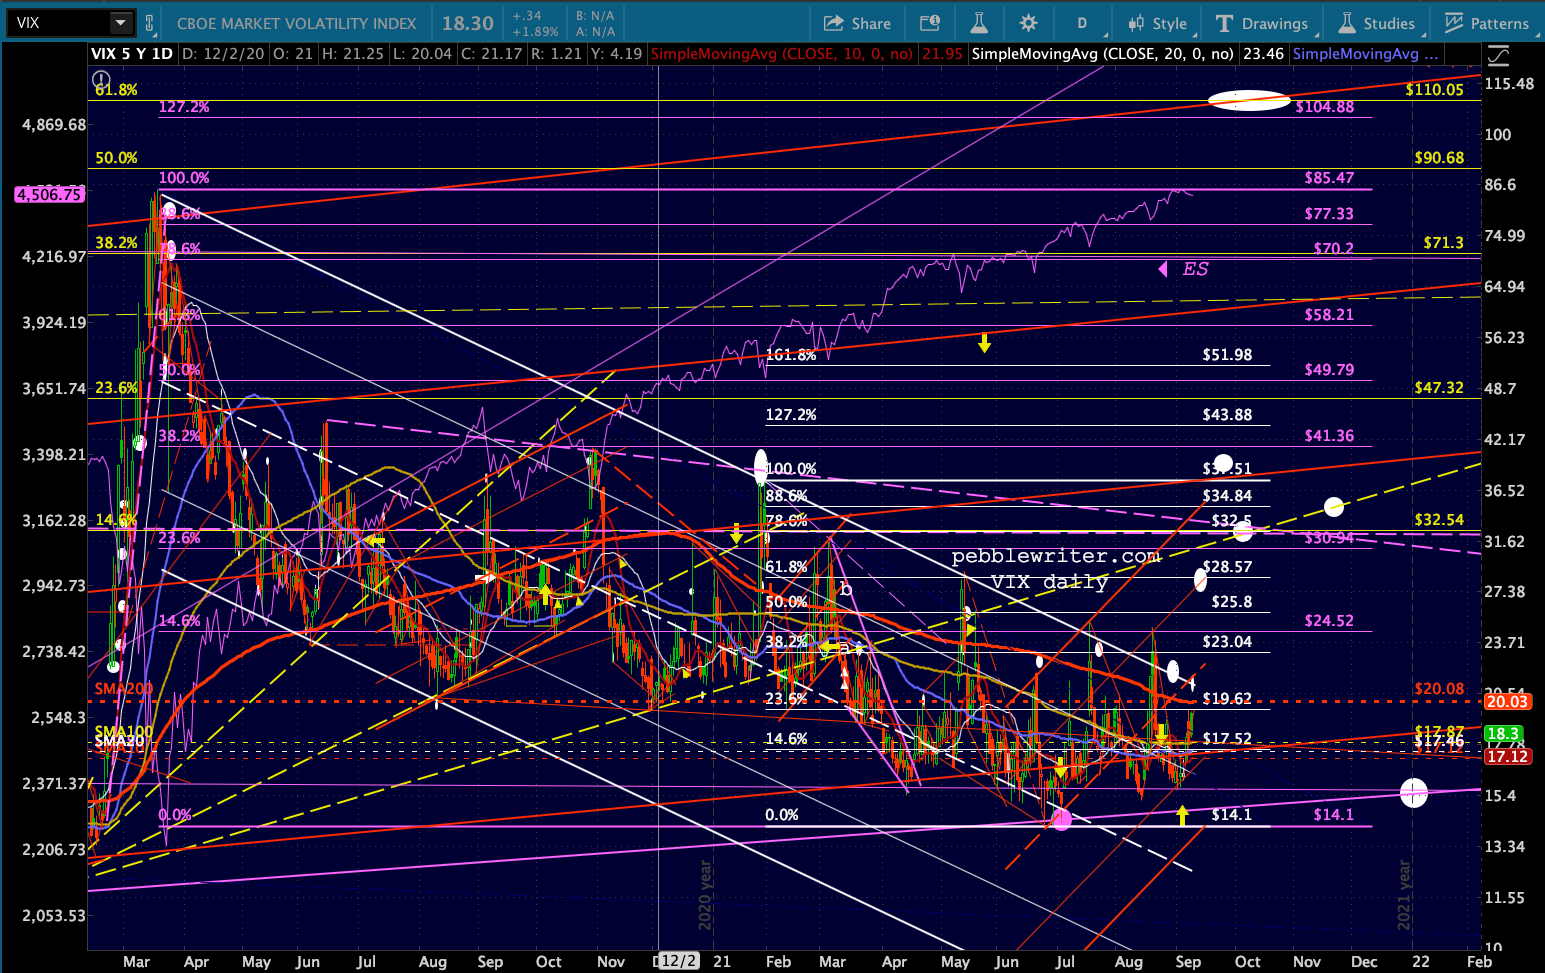
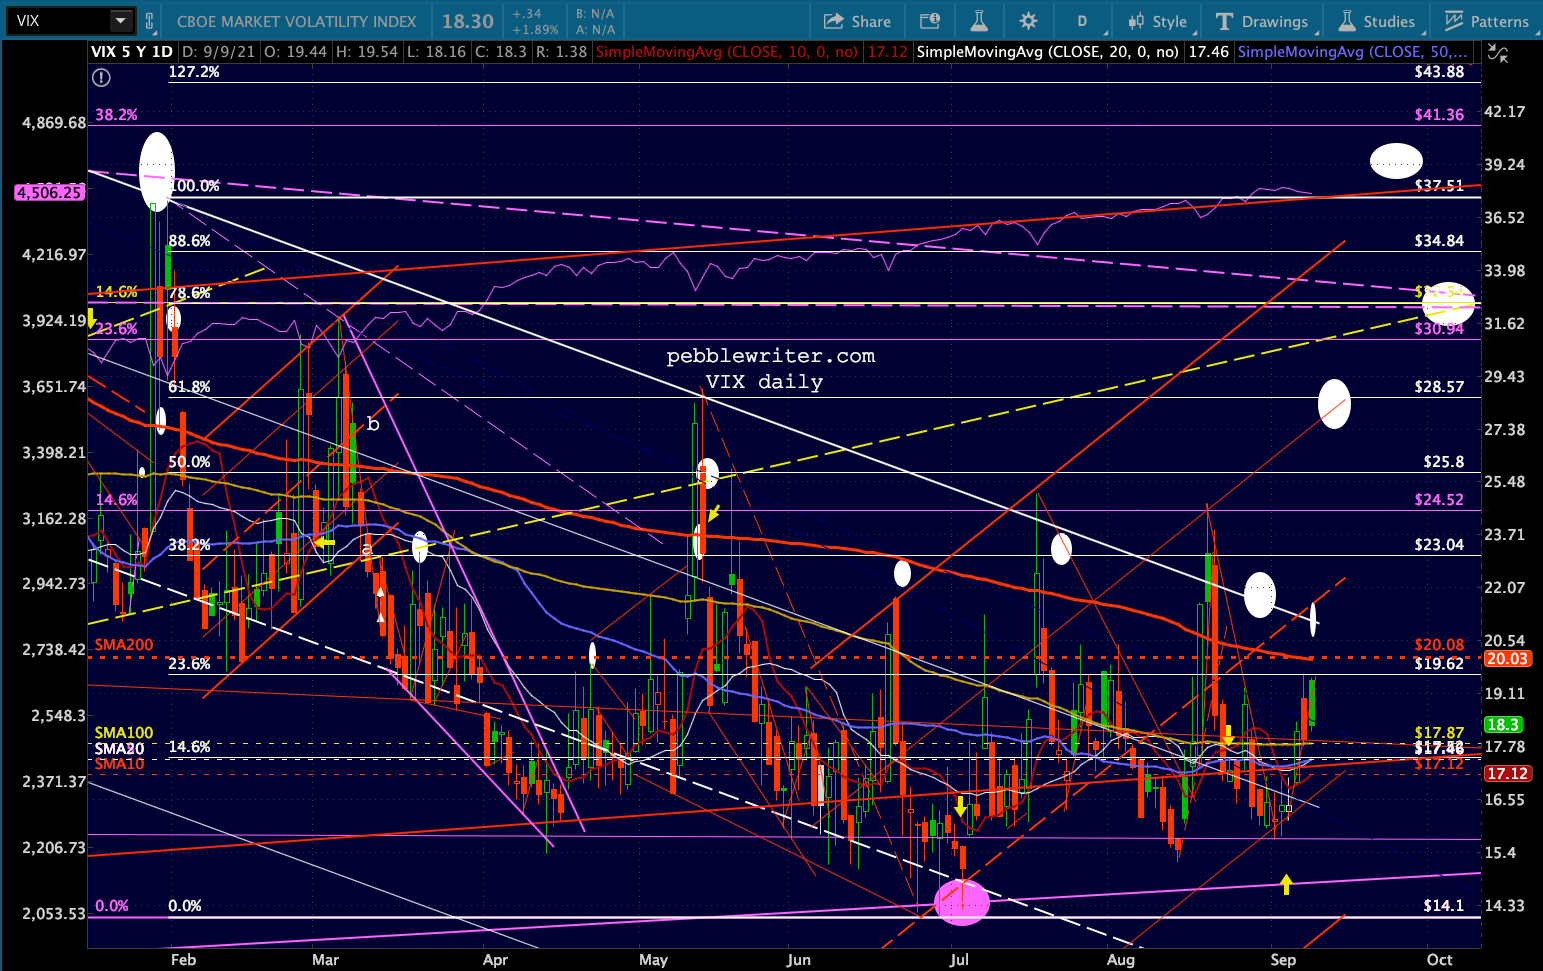 But, it’s still above its SMA10 and is a day or two away from another bullish (bearish for stocks) 10/20 cross.
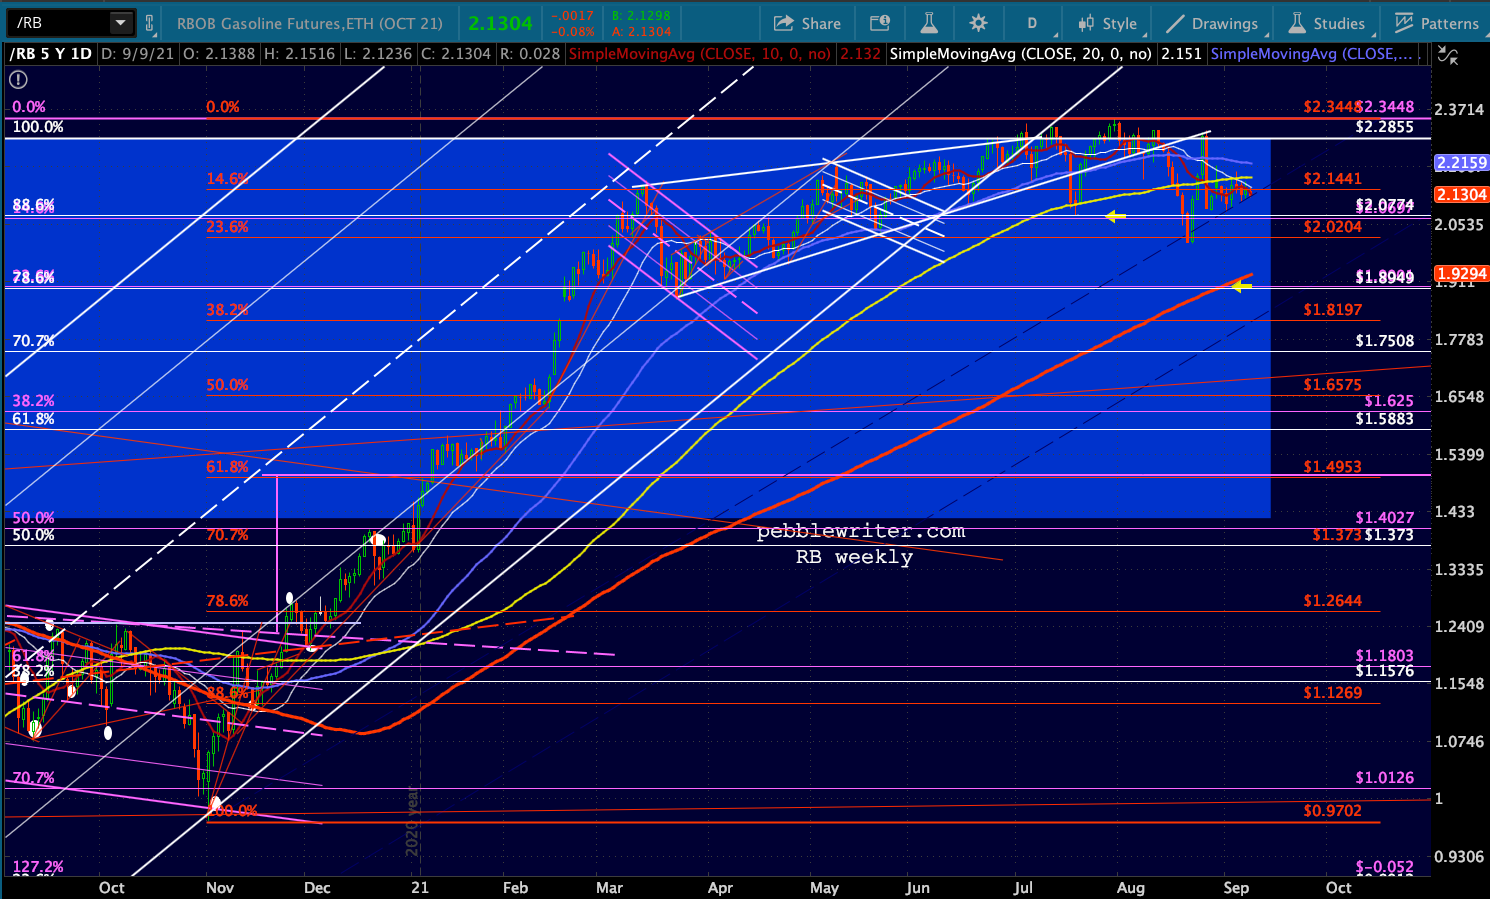
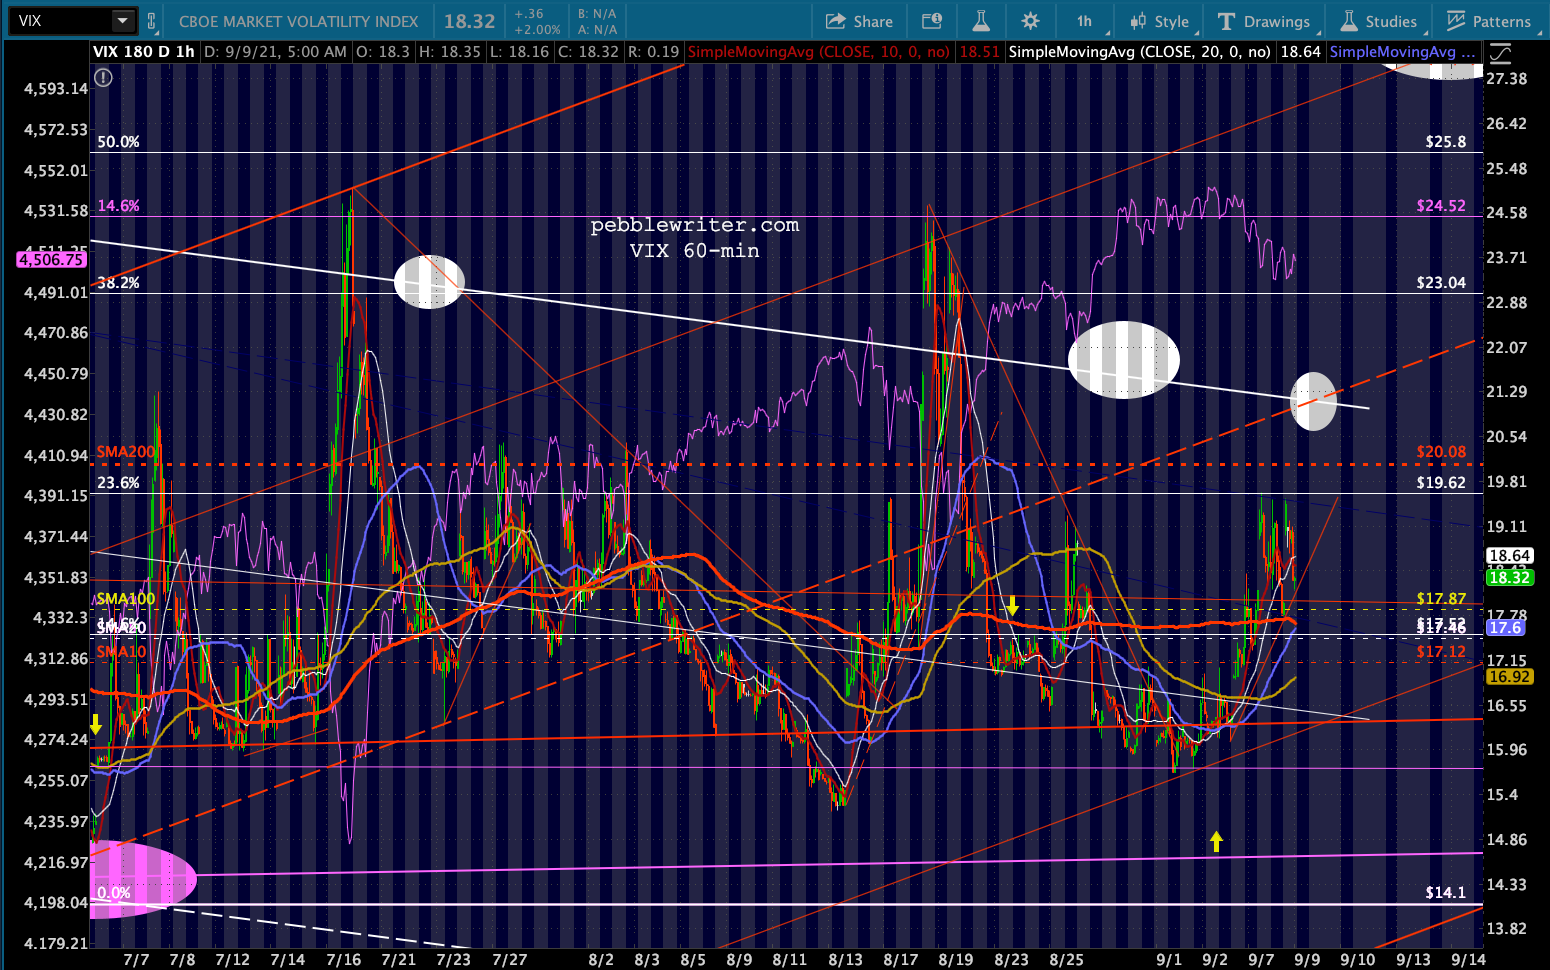 CL and RB are sticking to their guns for now…
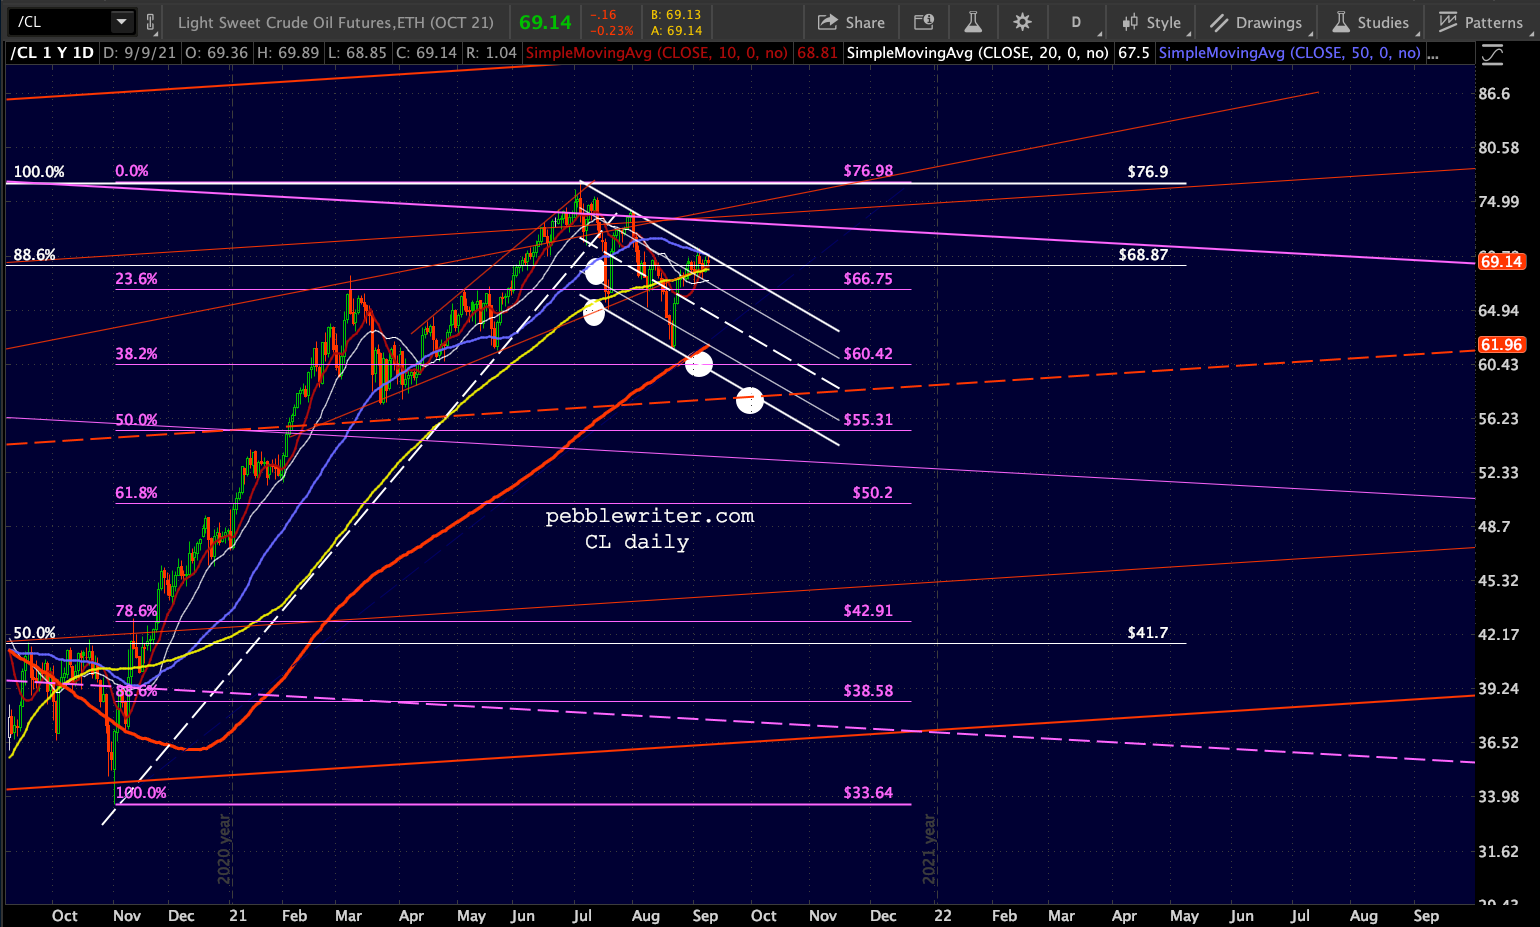
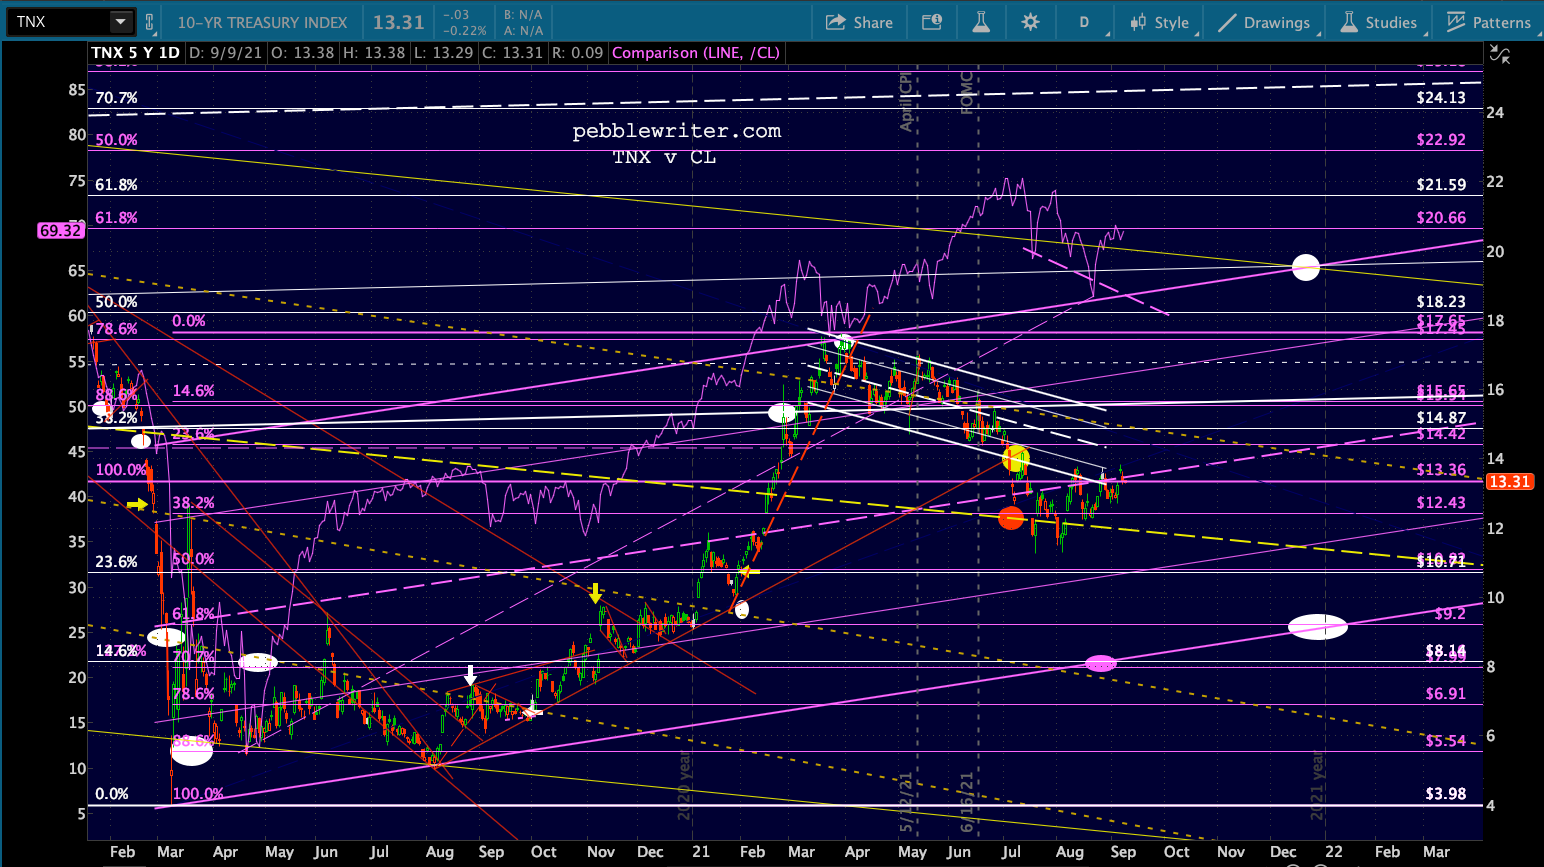
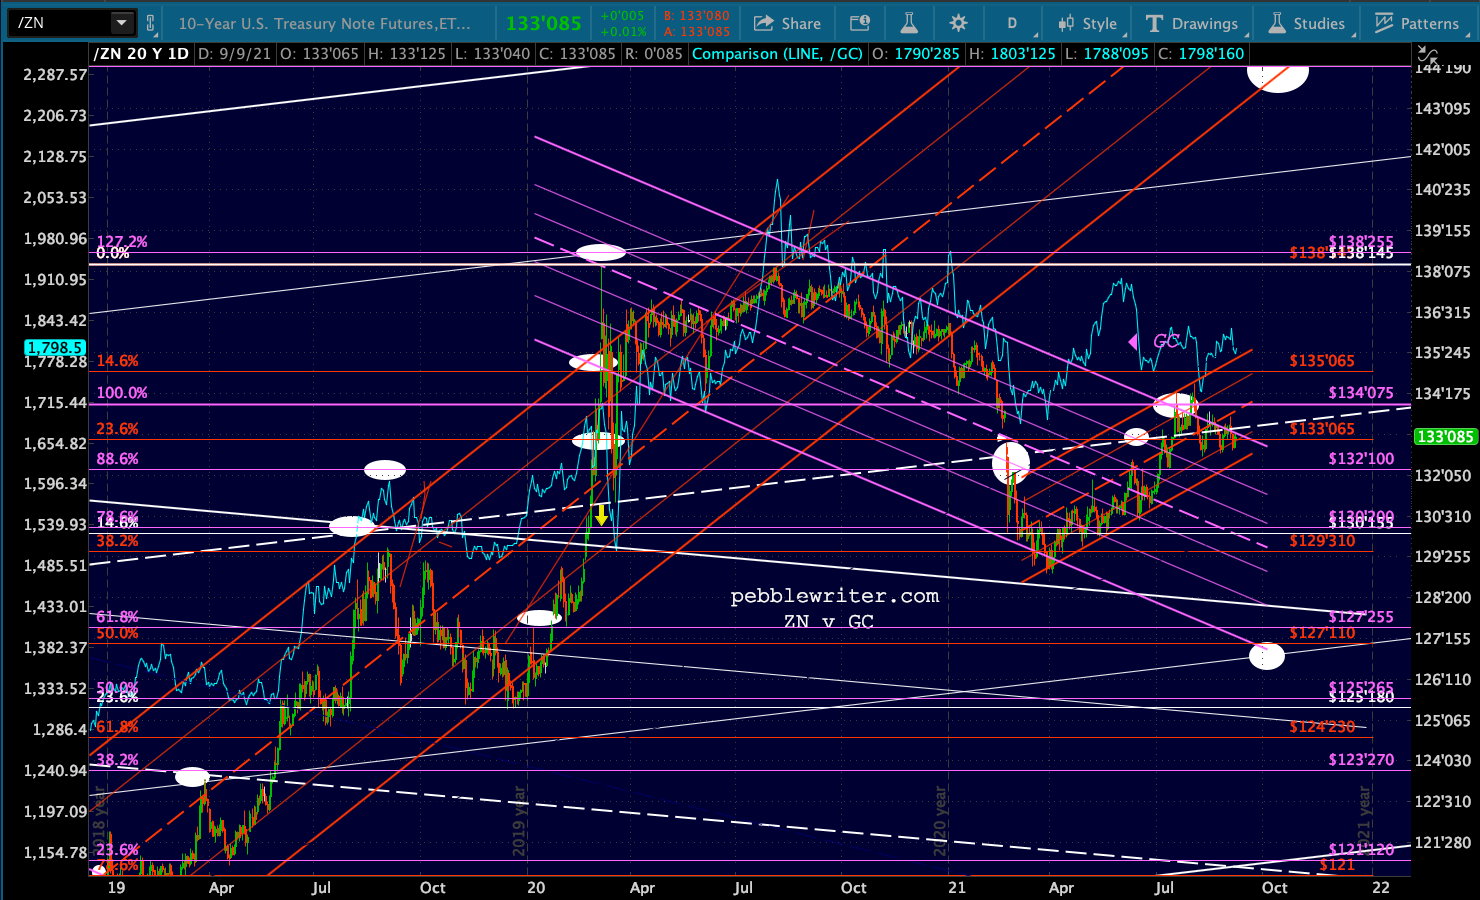
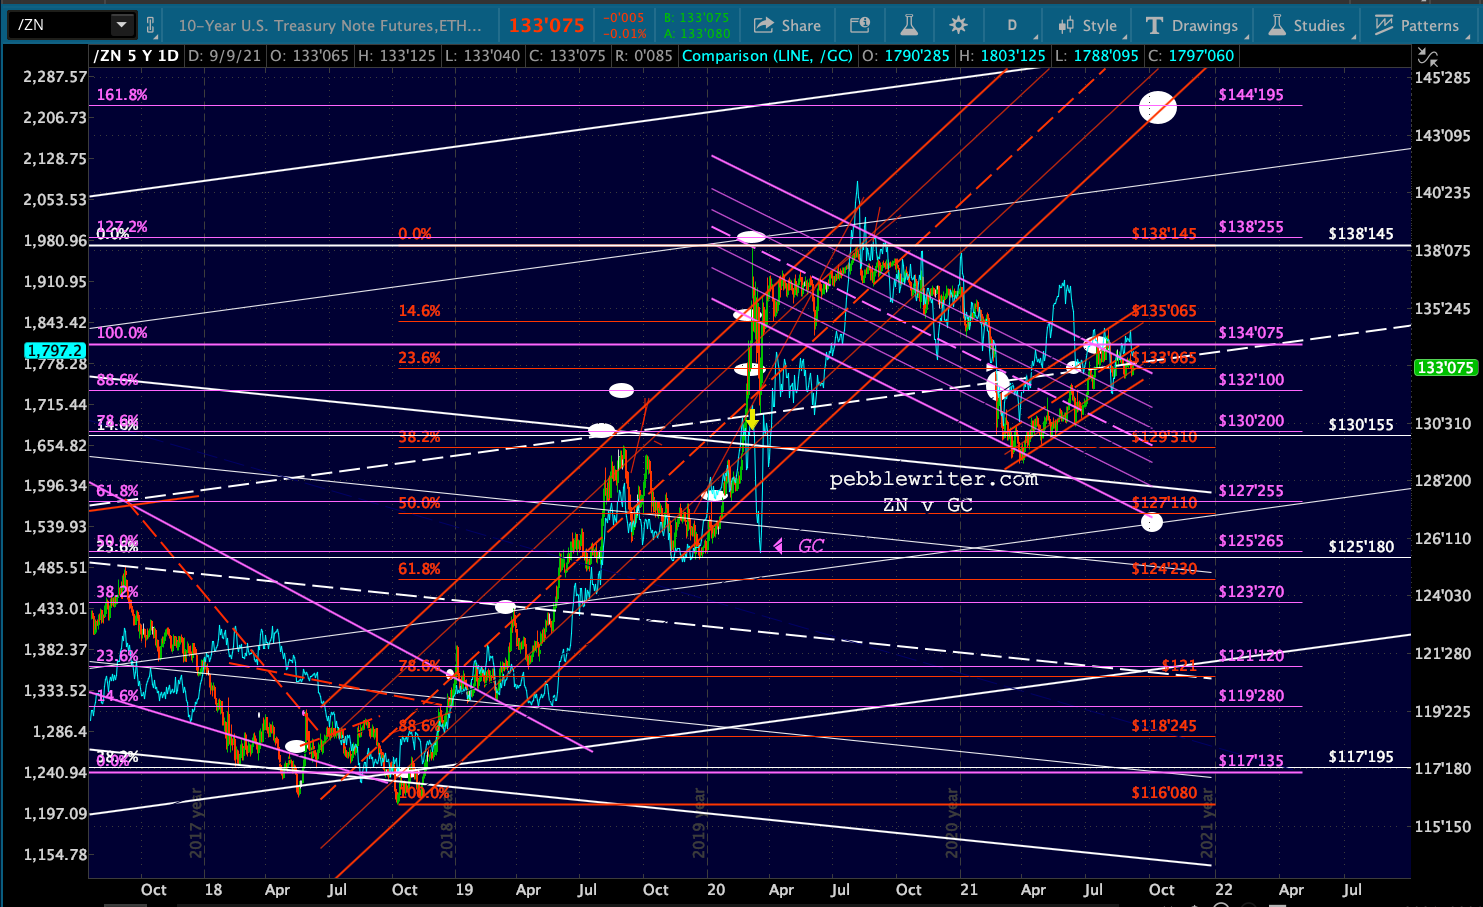
 …and, the bond market is definitely not nonplussed, meaning I suppose that it’s plussed.
 In focusing on currency pairs this morning, let’s look at the RSI charts.
We’re expecting USDJPY to break down any day and drop to meet its SMA200 which is about to emerge from the falling purple channel.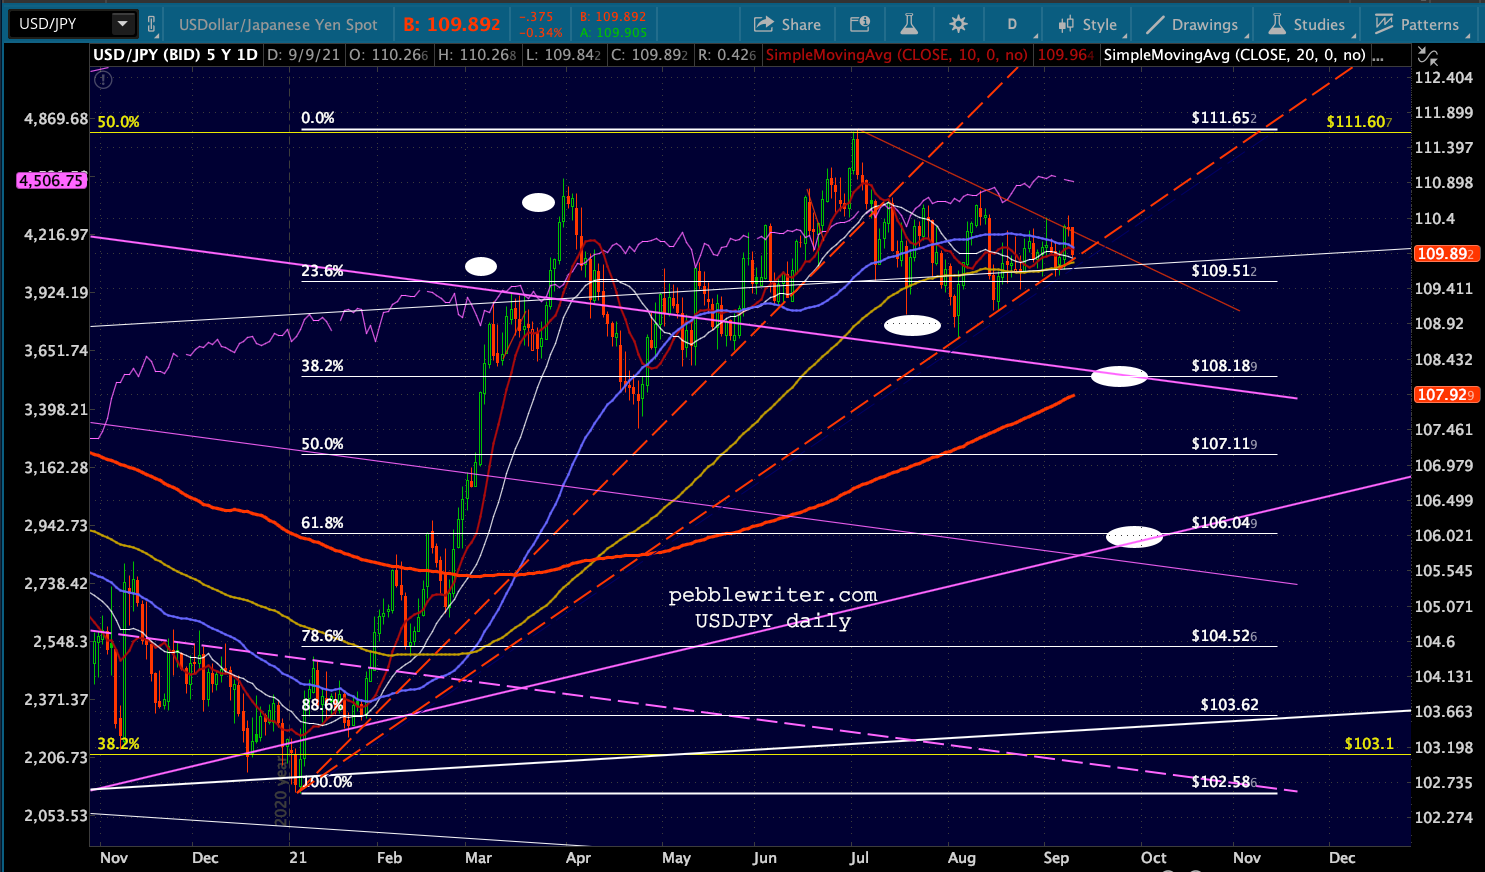 Its bearish RSI chart suggests this is also a likely outcome. It failed twice to break out past the falling red RSI TL (negative divergence) and is now testing the rising red TL on both its price and RSI charts.
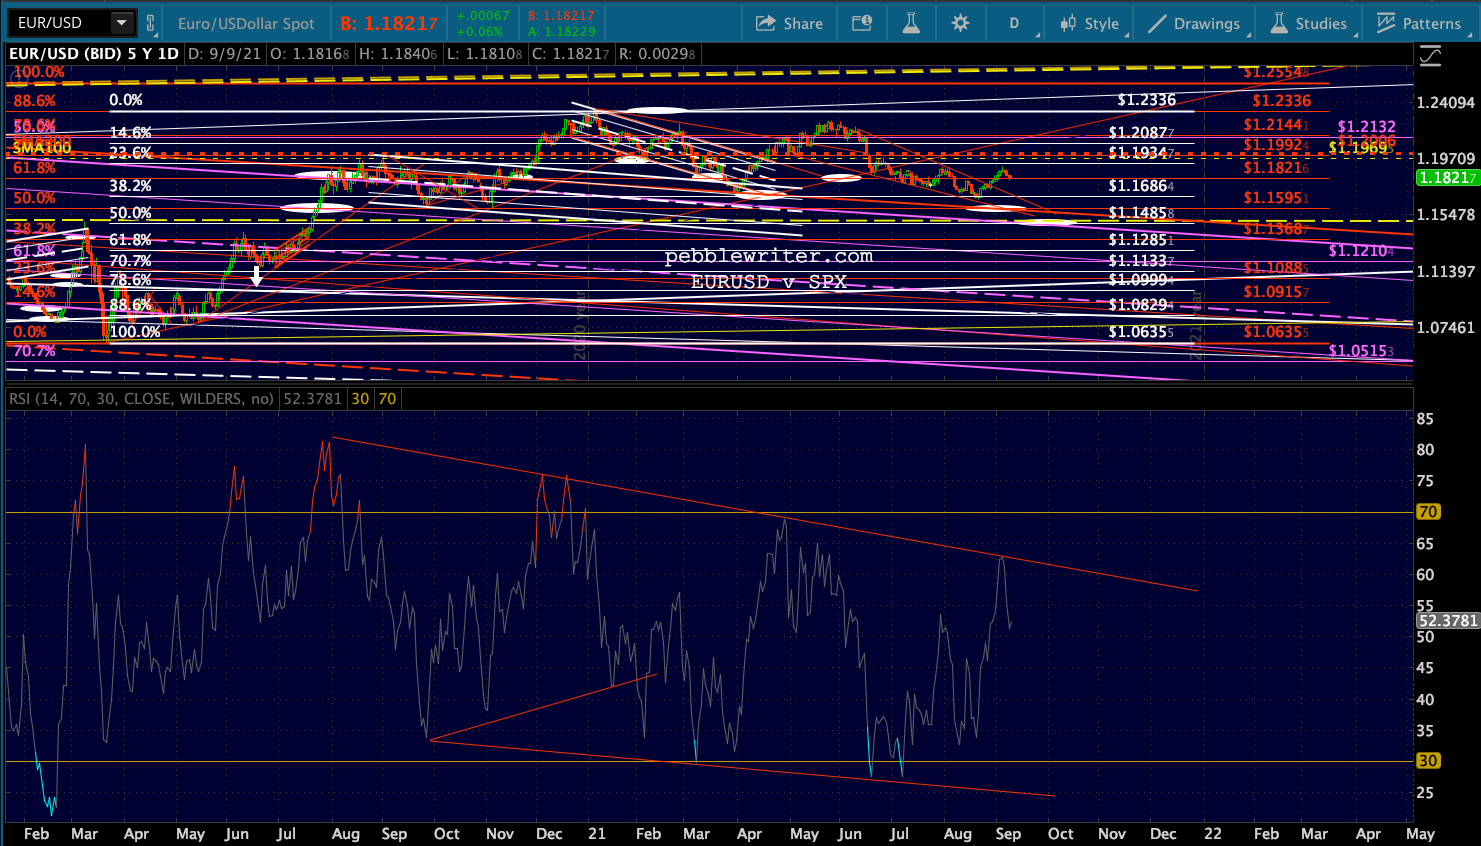
It’s very unusual for stocks to do well when USDJPY is breaking down, even a short distance as it is slated to do. 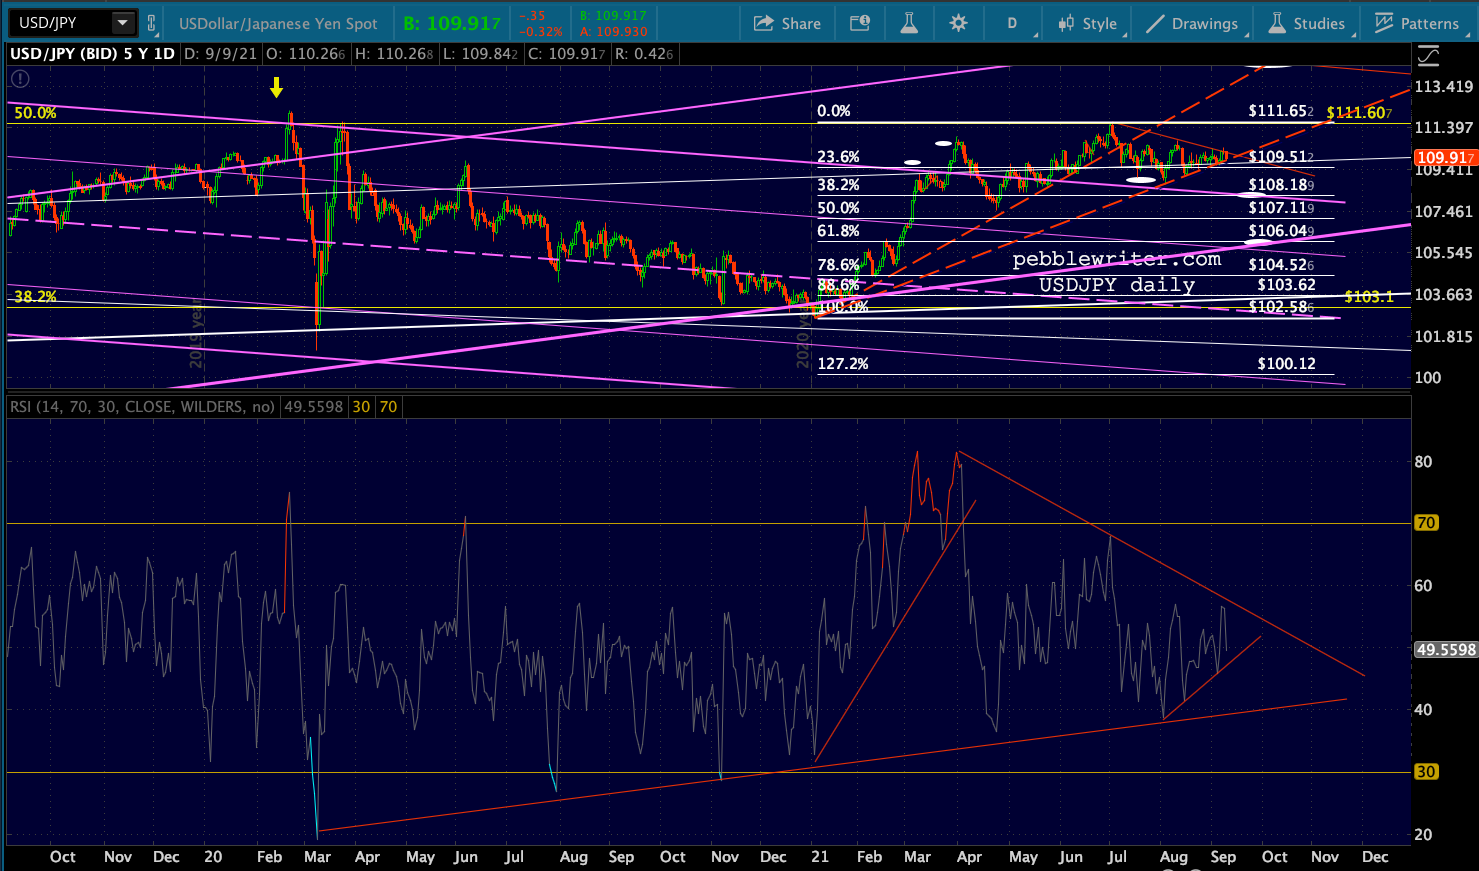 EURUSD’s RSI chart shows a very well-defined falling TL from the July 2020 highs, with the latest having already produced a reversal on Sep 3. The lows have also all connected with a falling TL.
 And, DXY – which seemingly everyone is bearish on – is still holding the falling red TL backtest and the midline of the flag pattern.
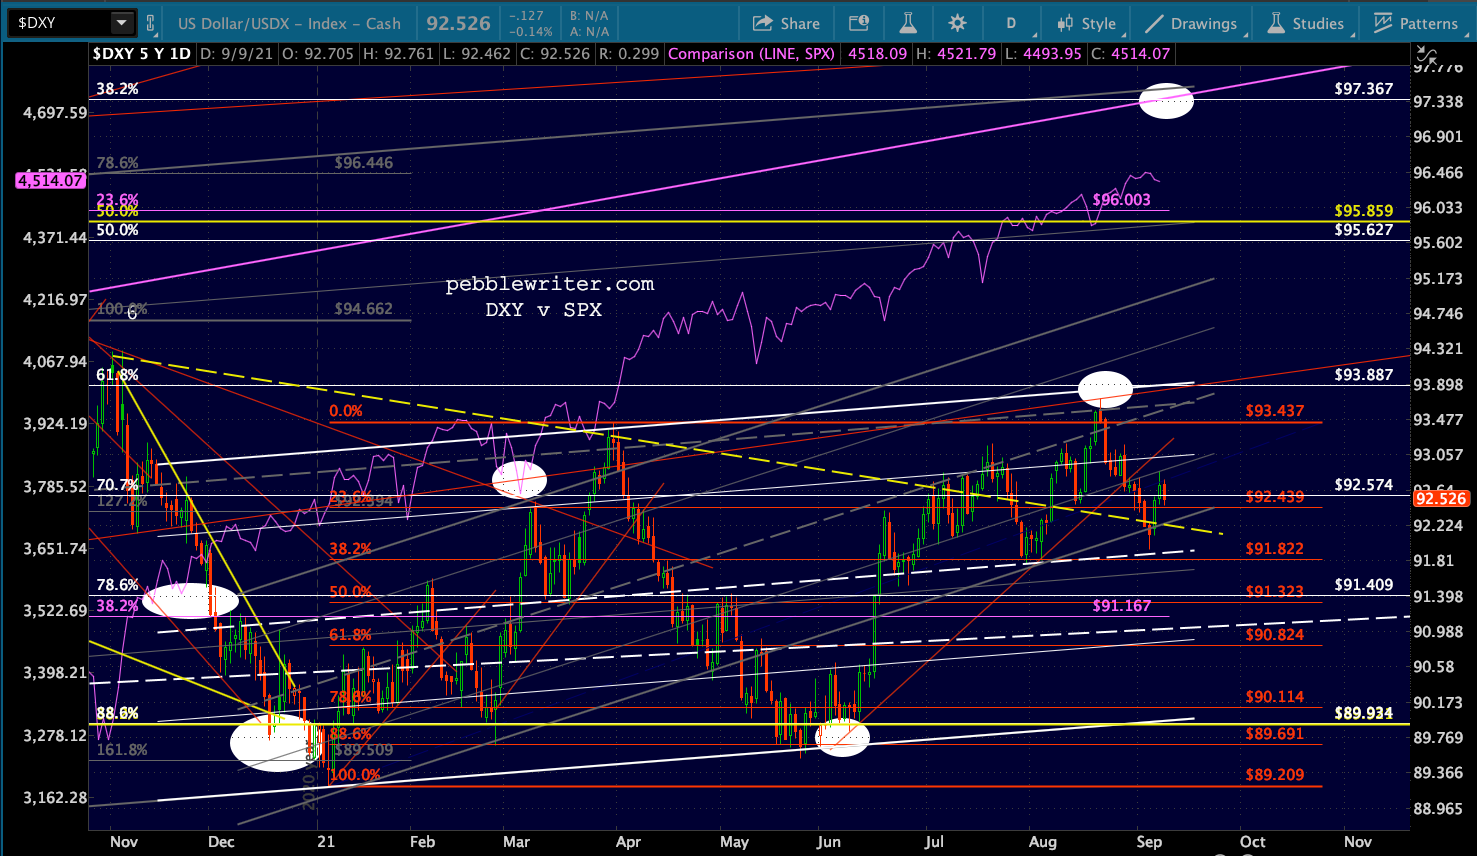 On Sep 2, it bounced for the fifth time on the rising red RSI TL.
 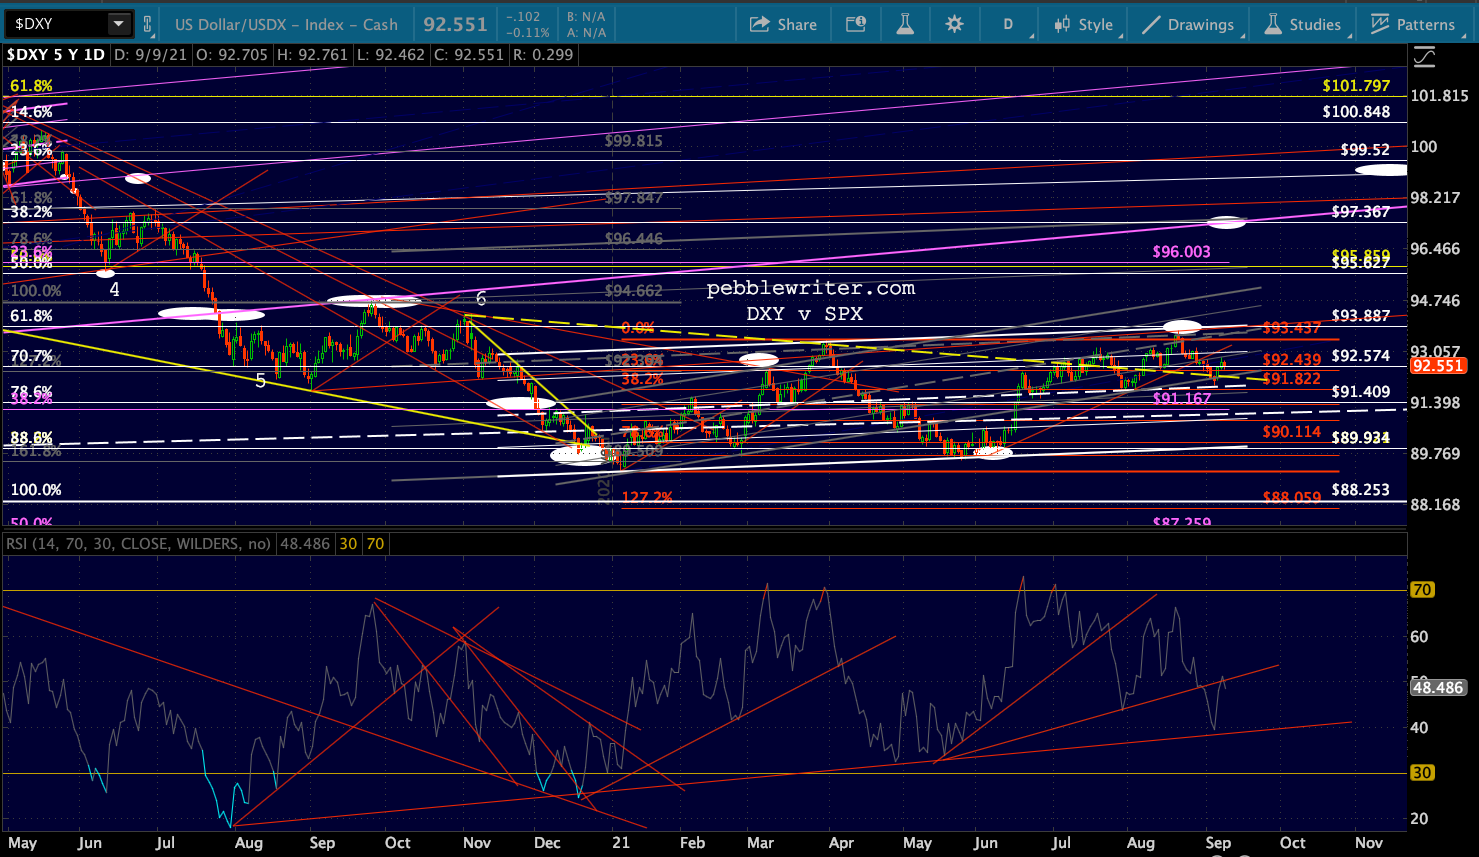 Although DXY often falls when rates are rising, it tends to scream higher when TNX suddenly plunges in an equity panic. Conventional wisdom is that rates will move higher due to inflation – especially if the Fed tapers. But, higher rates are the one thing the Fed can’t tolerate.
I believe the coming equity correction is just the ticket to send the 10Y down below 1%, driven by a mini equity panic rather than fundamentals. Ideally, it would also involve a big drop in oil/gas prices so the inflation scare itself could ebb as well.
Stay tuned.