

VIX’s constant slide has been one of the best indicators of the runaway bullishness over the past 10 months. Over the past week, however, it has soared to new highs, reaching our 200-day moving average target well ahead of schedule.  What does it portend for equities?
continued for members…
While it has reached its SMA200, VIX hasn’t quite reached the top of the channel established almost a year ago.  The channel was obviously broken out of in March, and was promptly broken back into. It was good for a quick 200-pt drop (and recovery) in SPX.
  But, if we look even further back, we can see more clearly the indicator’s greater upside potential via the dotted red line. Arguing otherwise: the pretty consistent reversals (and equity rallies) when VIX’s RSI reaches an overbought condition (or a well-established TL) as it is now.
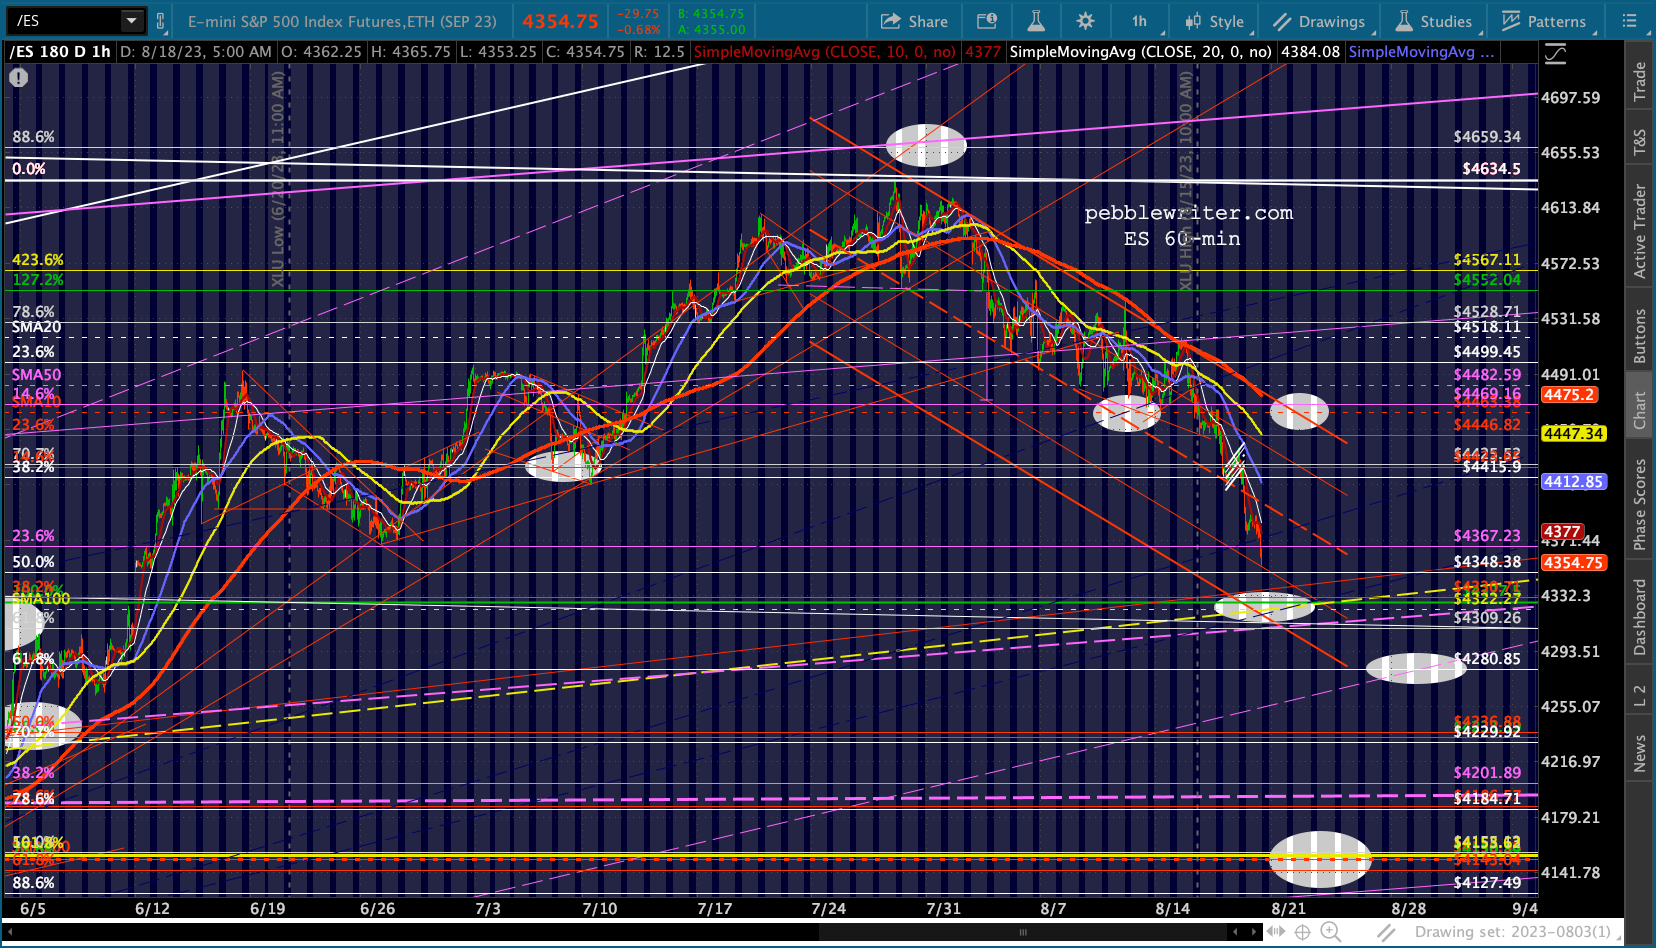
 So far, we’ve crashed through a number of potential support levels on SPX and ES, with the next ones just below current levels SPX 4335 / ES 4348 (the August 2022 highs.)
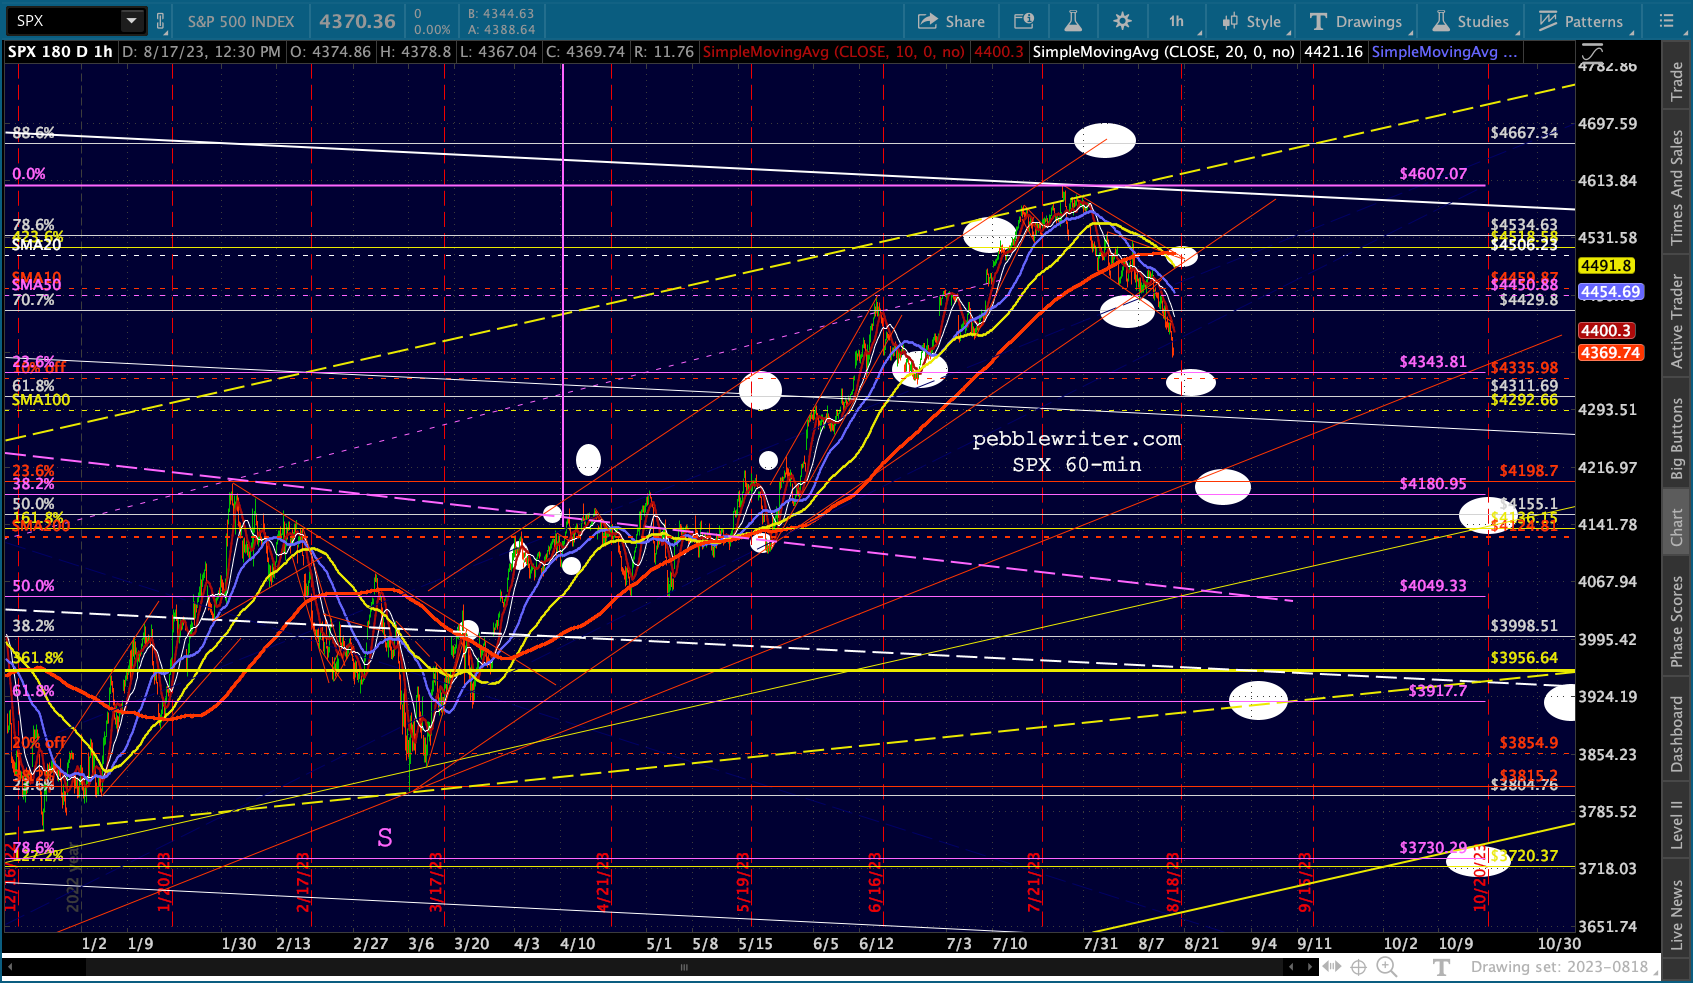


 AAPL still argues for more general equity weakness.
  And DJI, while it could get a bounce here, still probably has a date with its channel bottom.
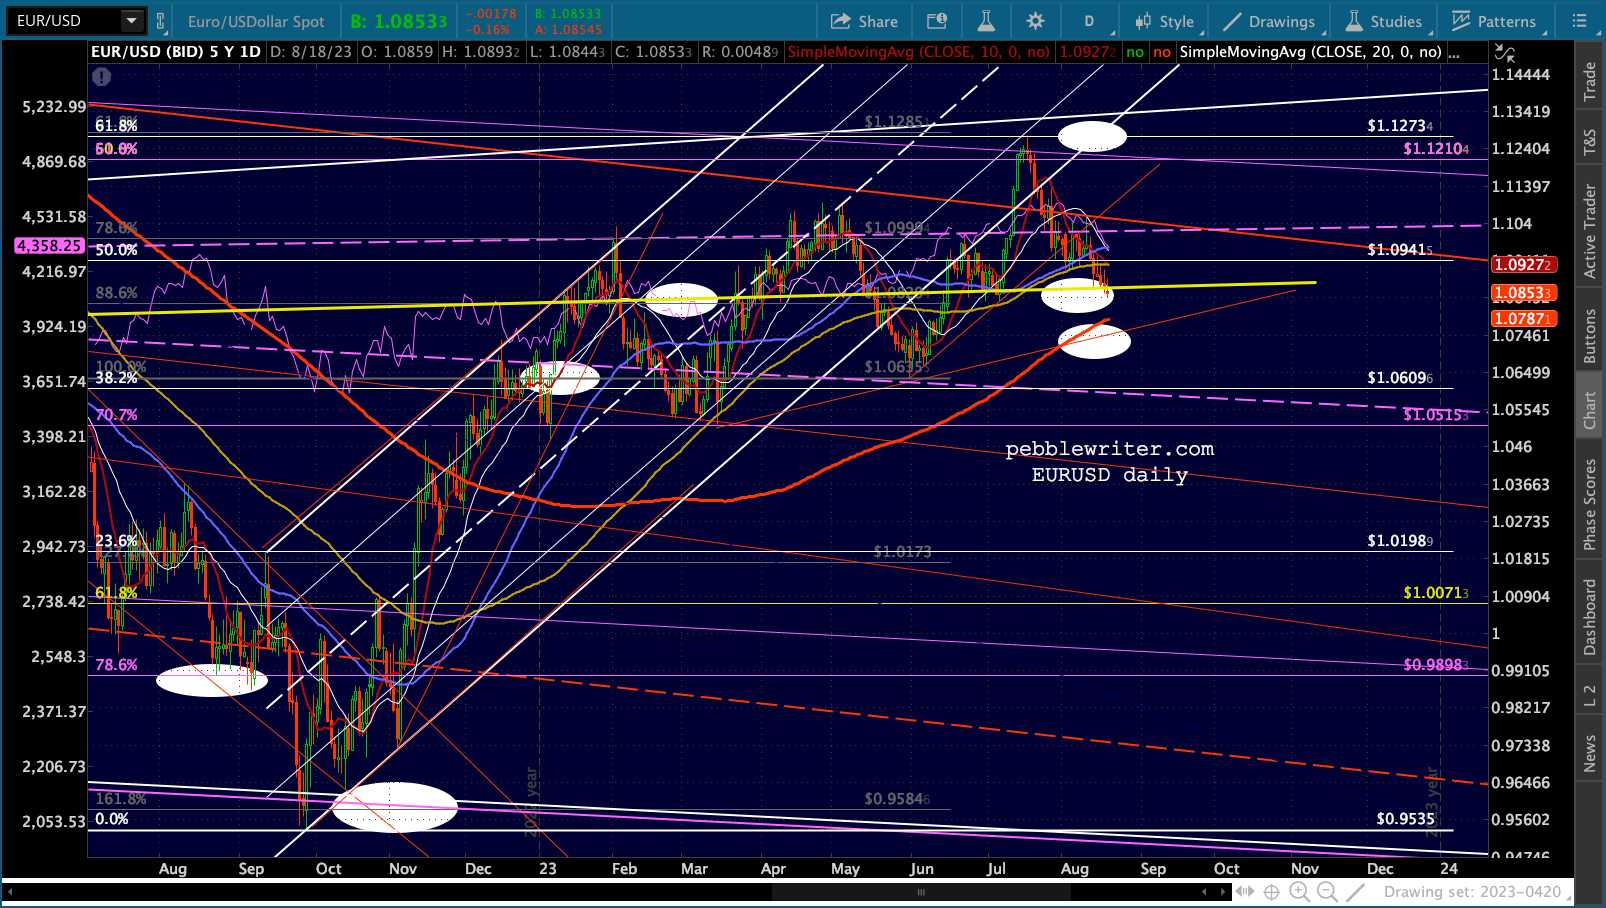
 We’ve reached or nearly reached a few targets in currencies: EURUSD’s SMA200…
 …USDJPY’s .786 Fib…
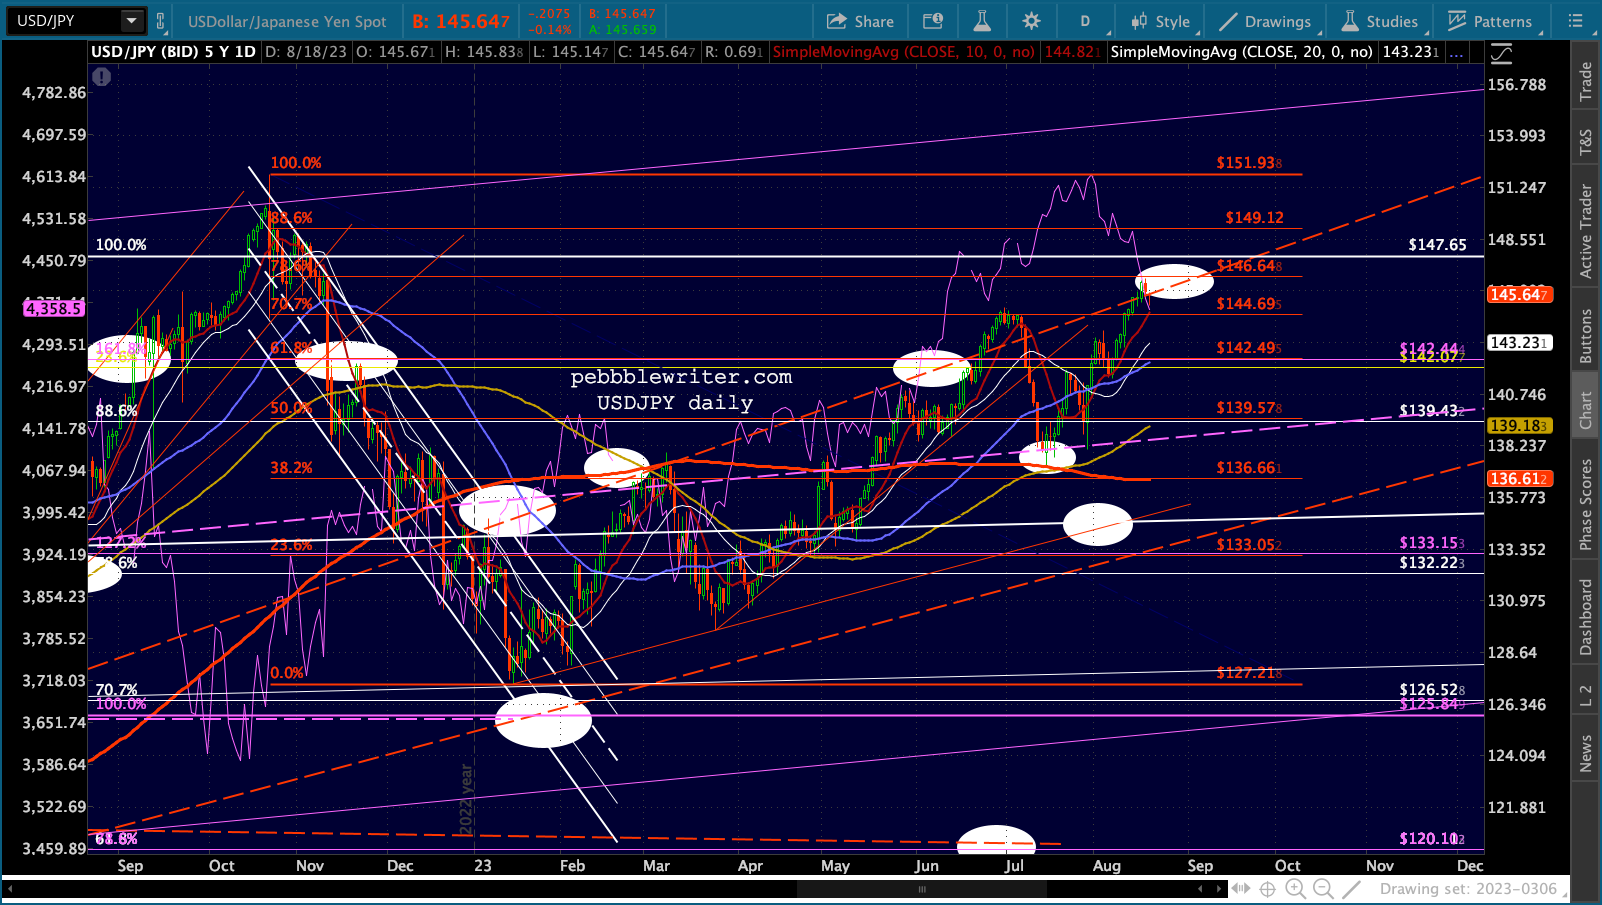 …DXY’s SMA200…
 …and GC’s SMA200.
  SI reached our TL target last week.
 Oil and gas have also continued to perform as expected…
 …as does the 10Y.
 Note that Jackson Hole is coming up this weekend. Powell has been careful not to sound too hawkish lately. The recent 5% slide in equity prices might see him be even more careful than usual not to disturb equity prices.
GLTA.