

March durable goods orders disappointed this morning, coming in at 0.5% versus the 2.3% rebound expected after February’s -1.2% flop.
 We couldn’t help wonder whether the data were somehow related to the first (tiny) breakdown in RBOB prices since the Mar 23 lows.
 Given that oil and gas are poised to deliver a huge increase in CPI for April, this might be a good time to review where we are and where we’re headed.
continued for members…
First, the big picture for markets in general…
Friday’s rebound in USDJPY and breakdown in VIX guaranteed marginally new highs for ES/SPX.


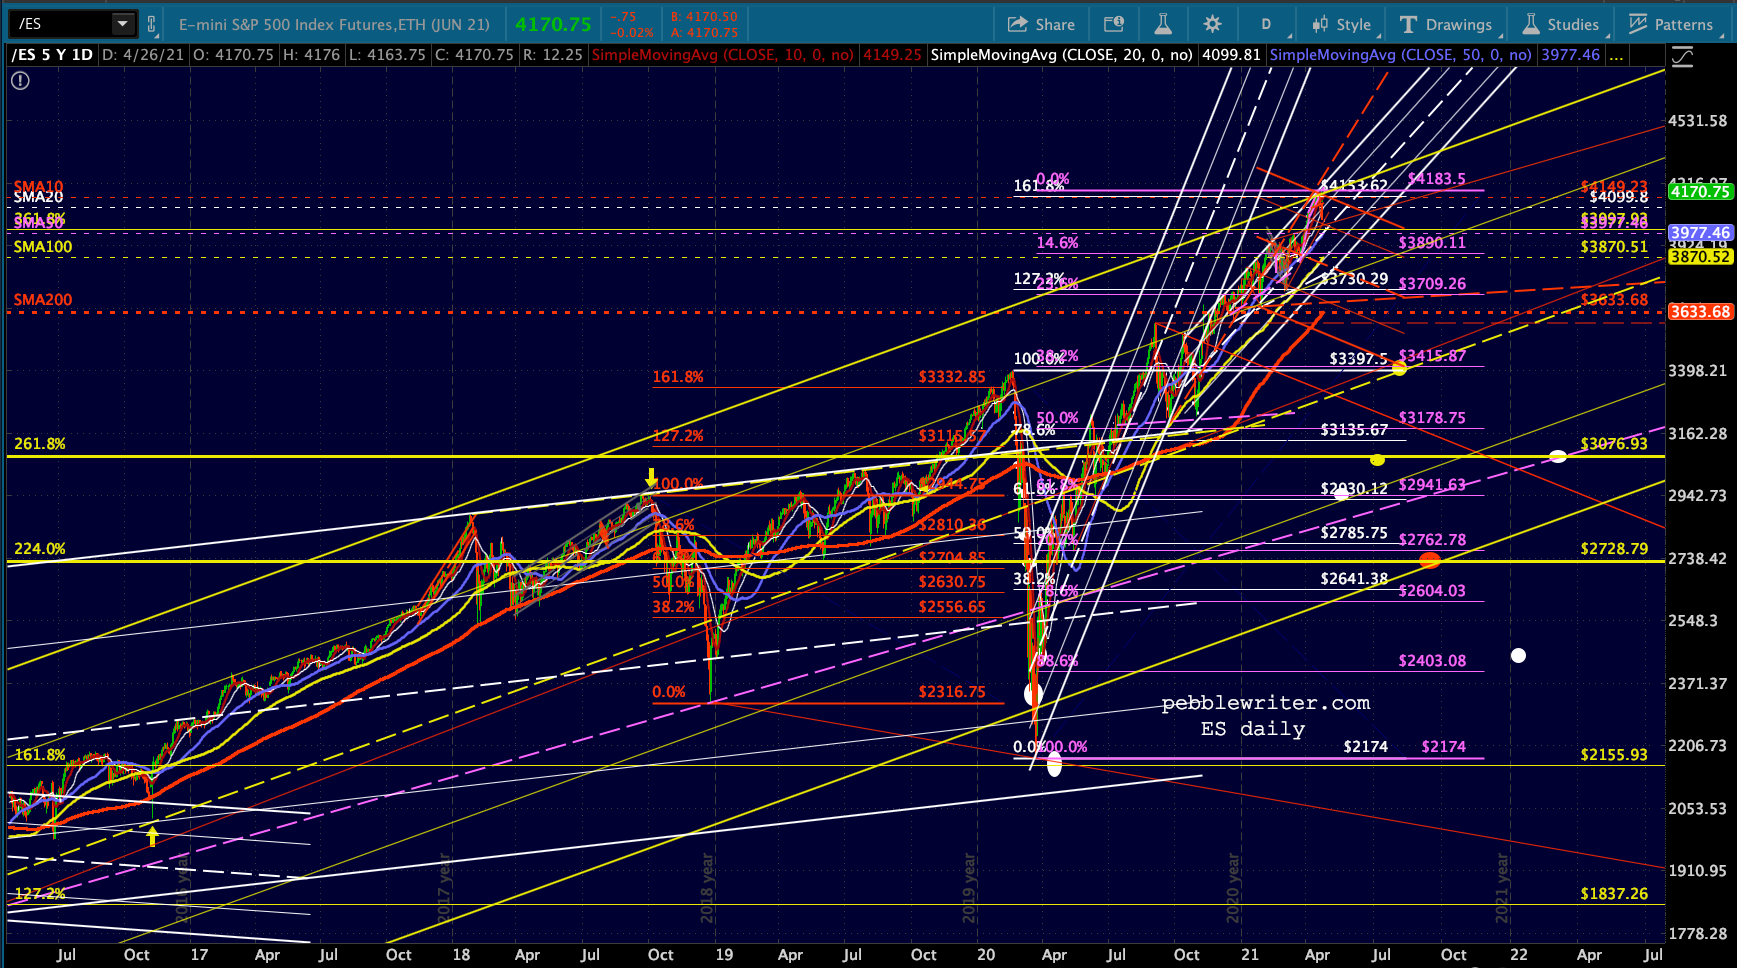
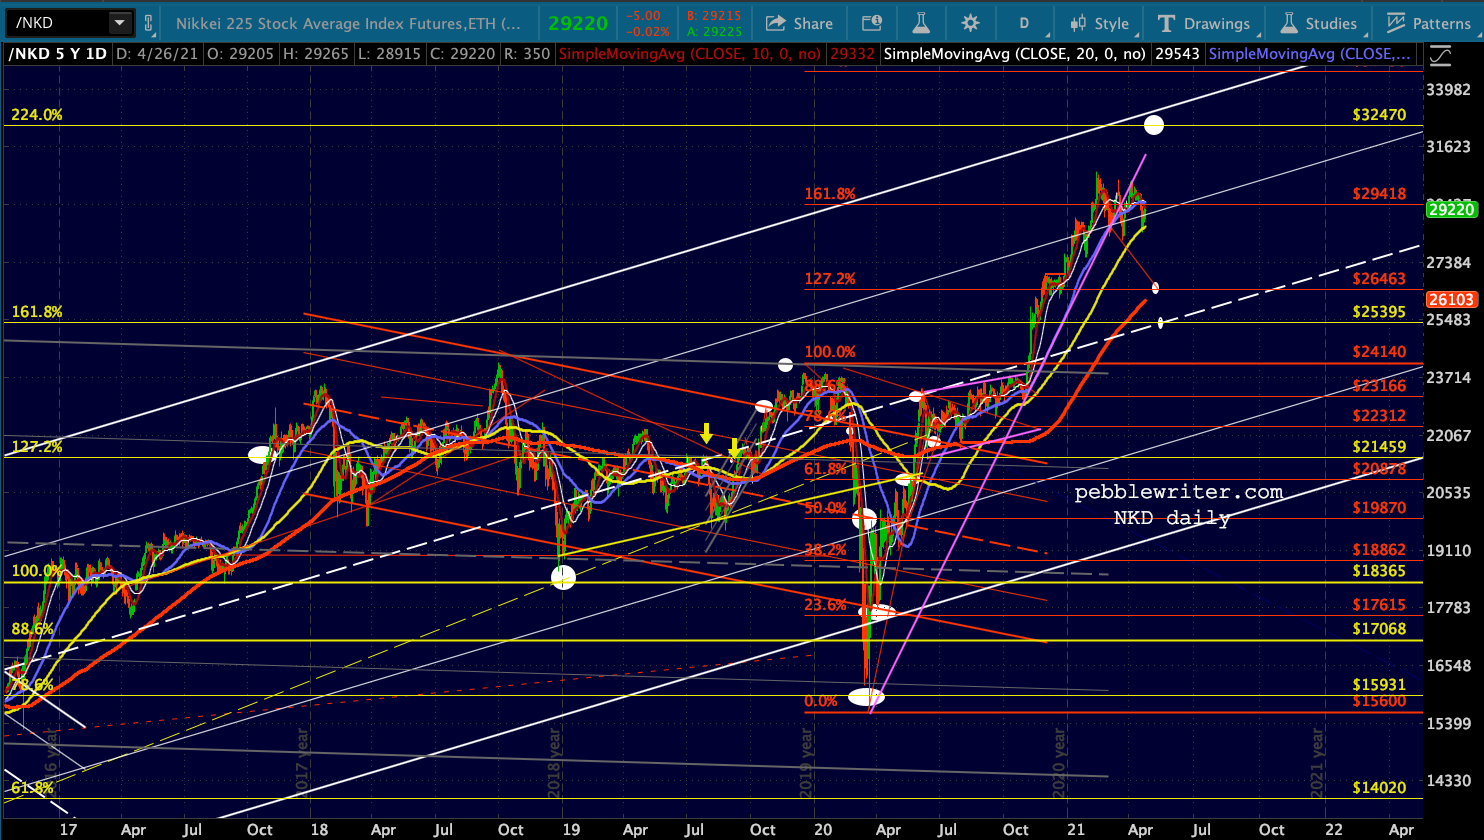
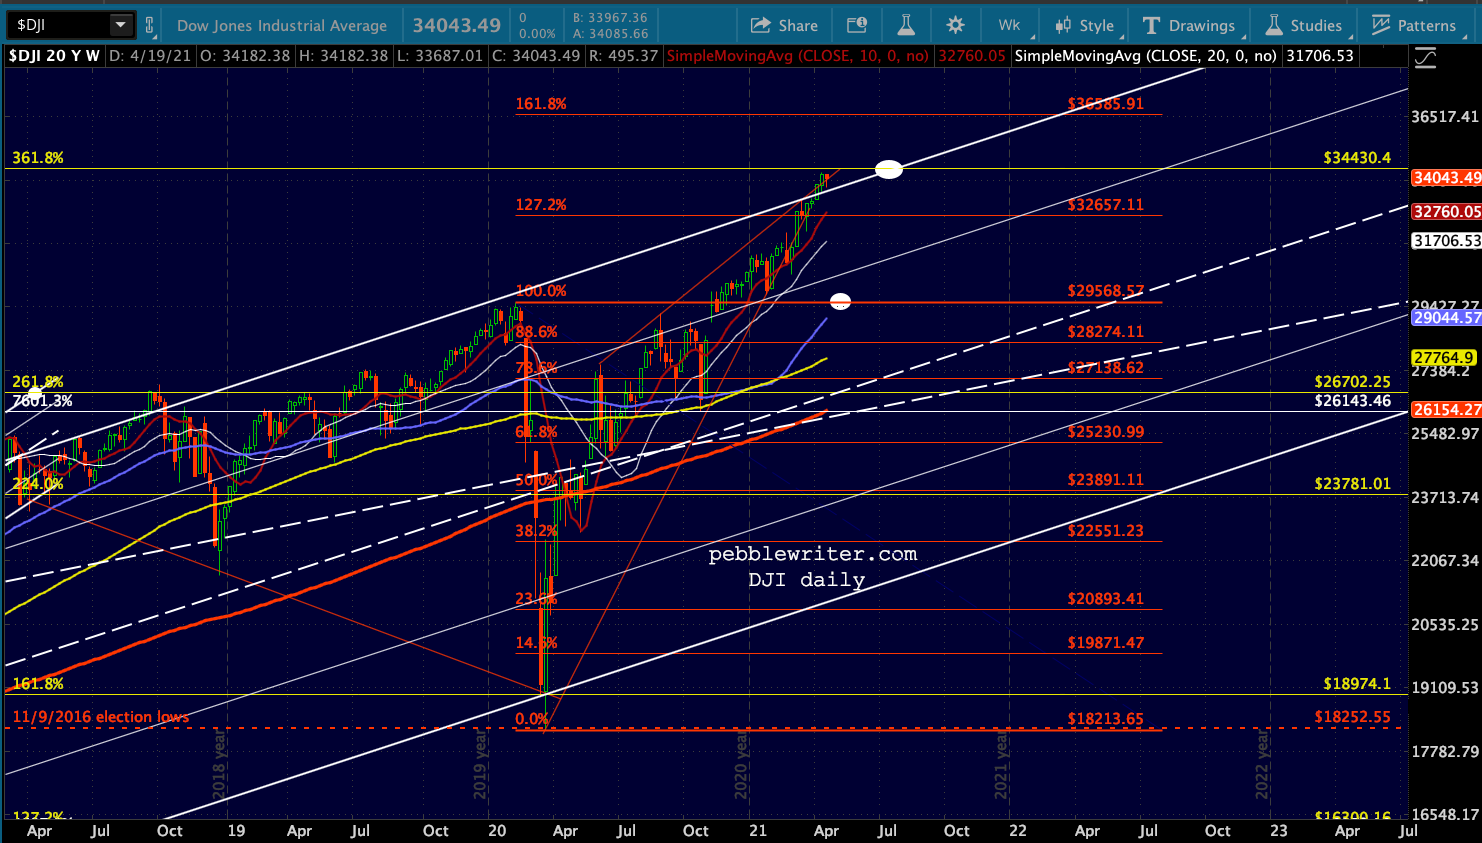
 NKD and DJI continue to suggest at least a minor correction from here.
 And, as of this moment, VIX is back in the rising white channel but threatening to repeat Friday’s breakdown. Note it is hanging just shy of the SMA10.
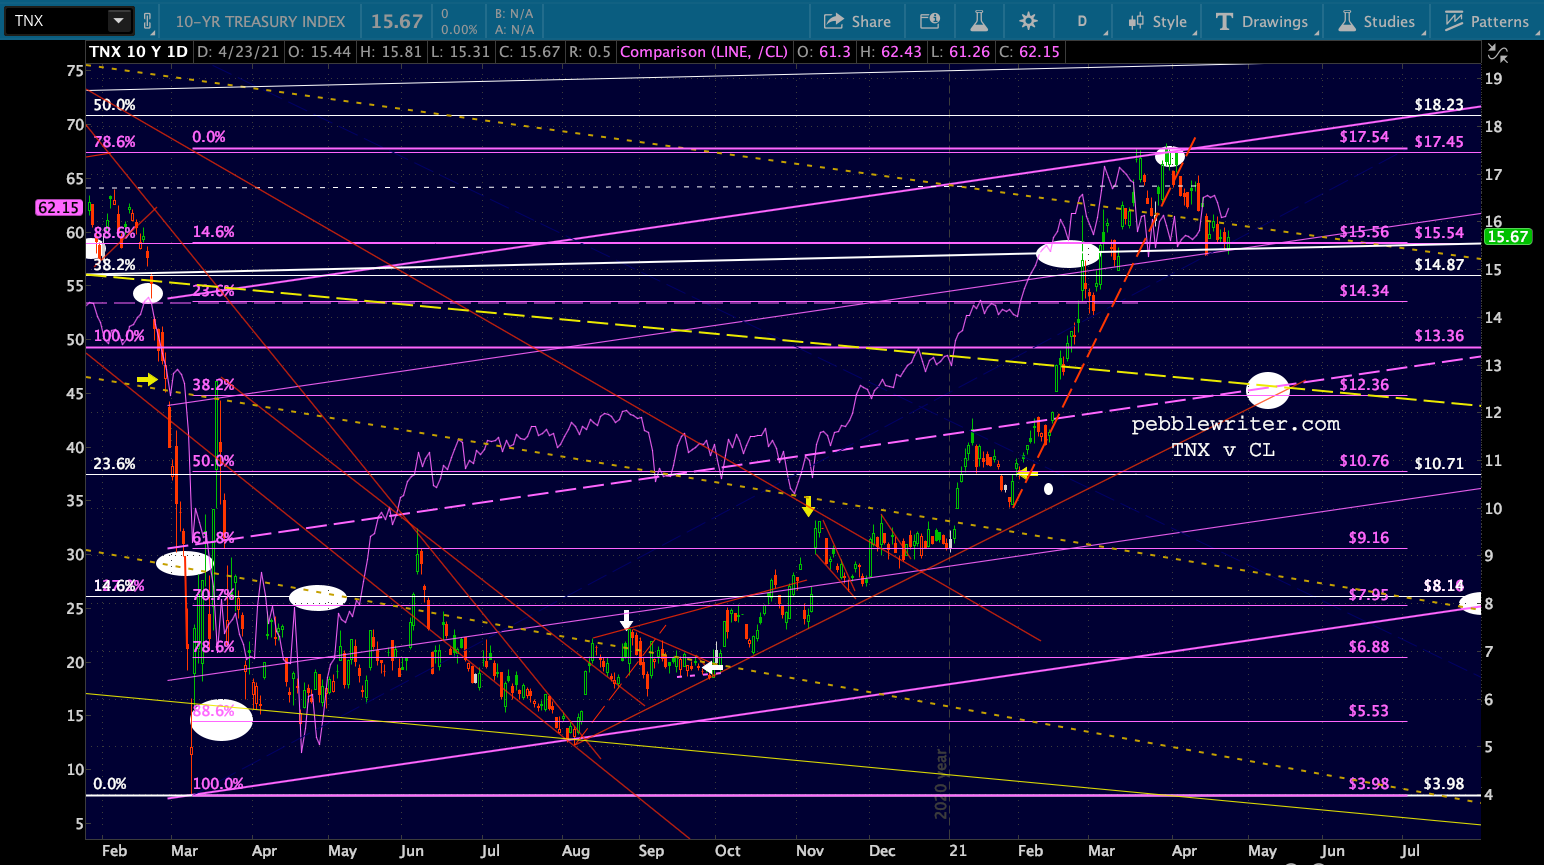
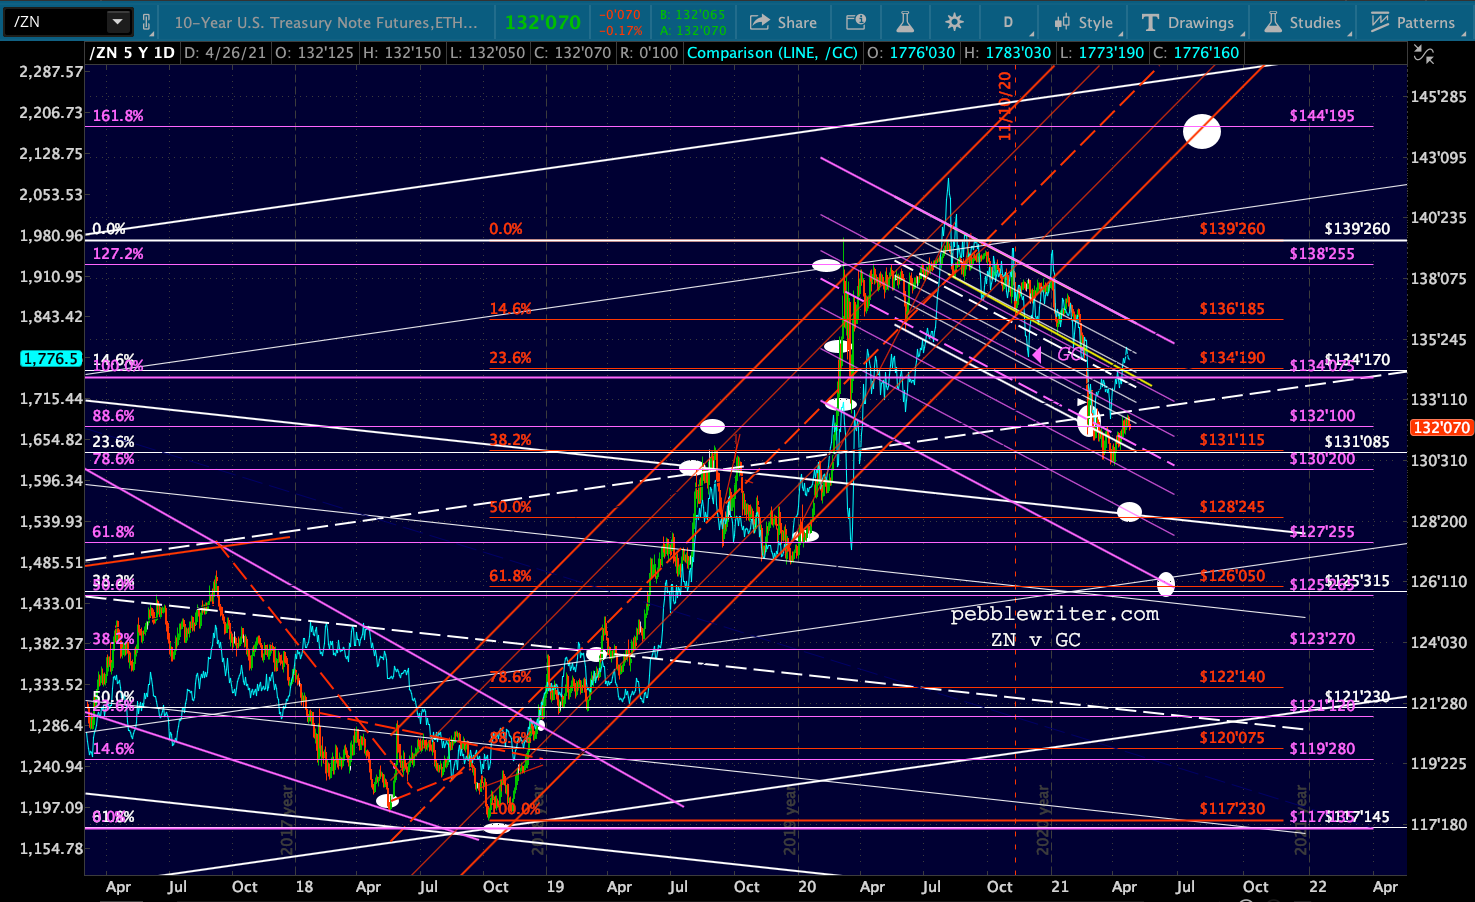
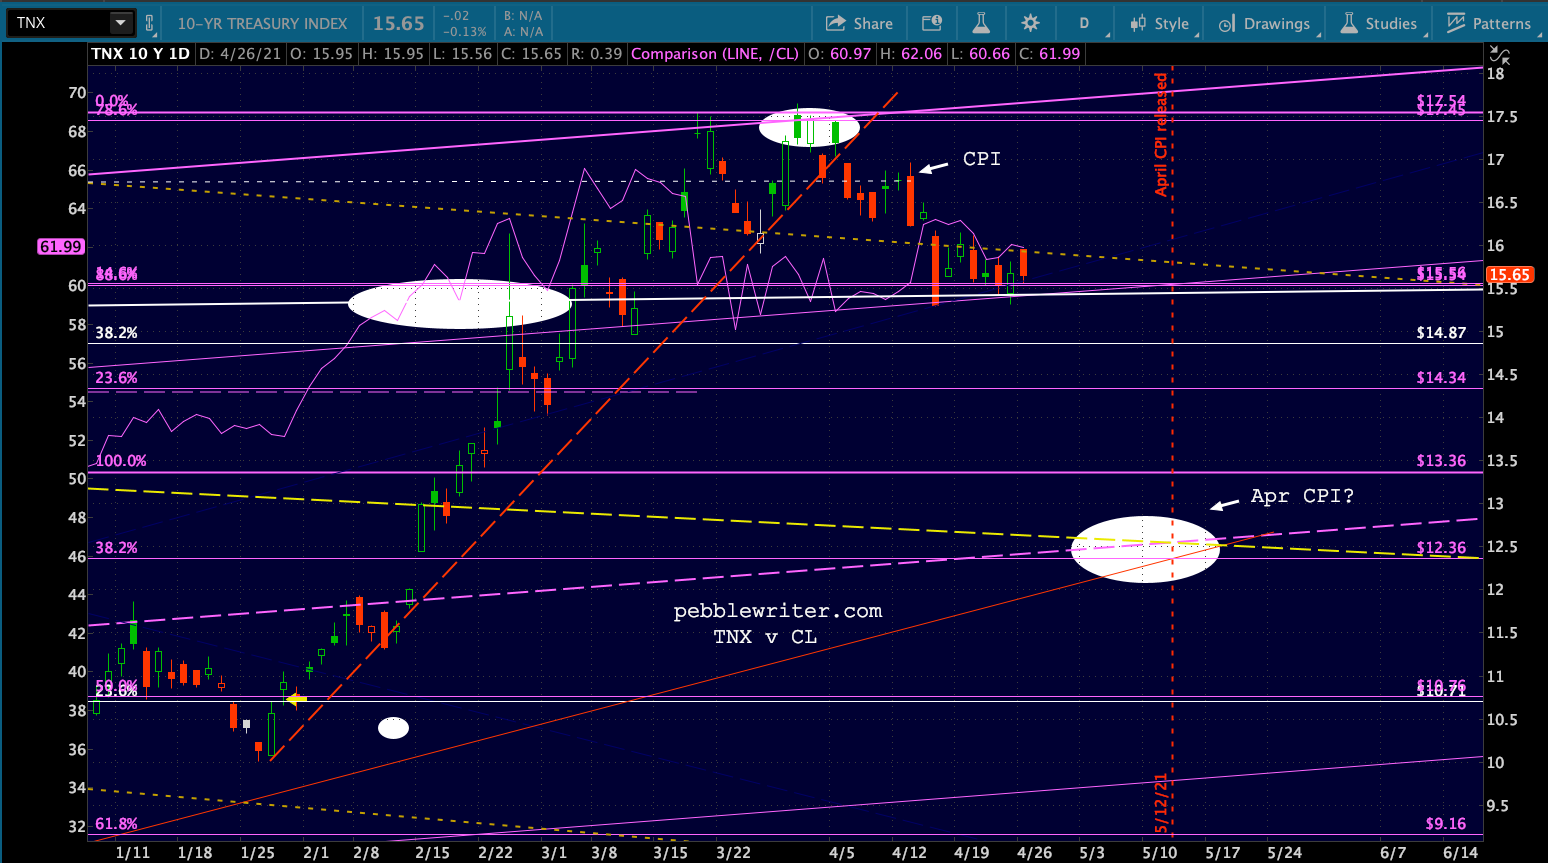
 Bonds yawned at the economic data, but the charts continue to suggest a fall in 10Y rates to 1.25-1.3 by early May.
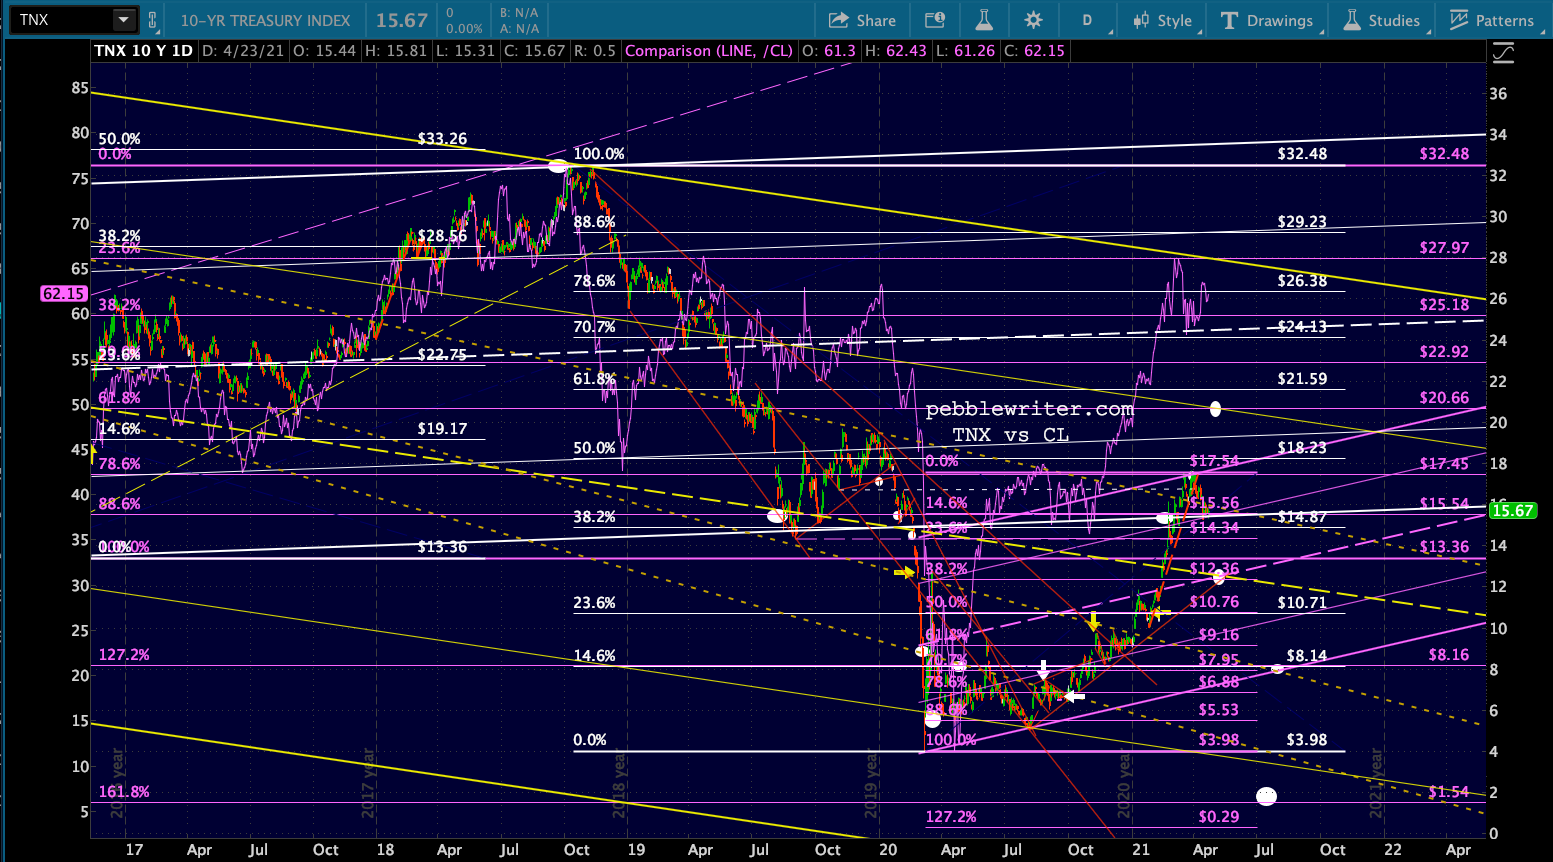
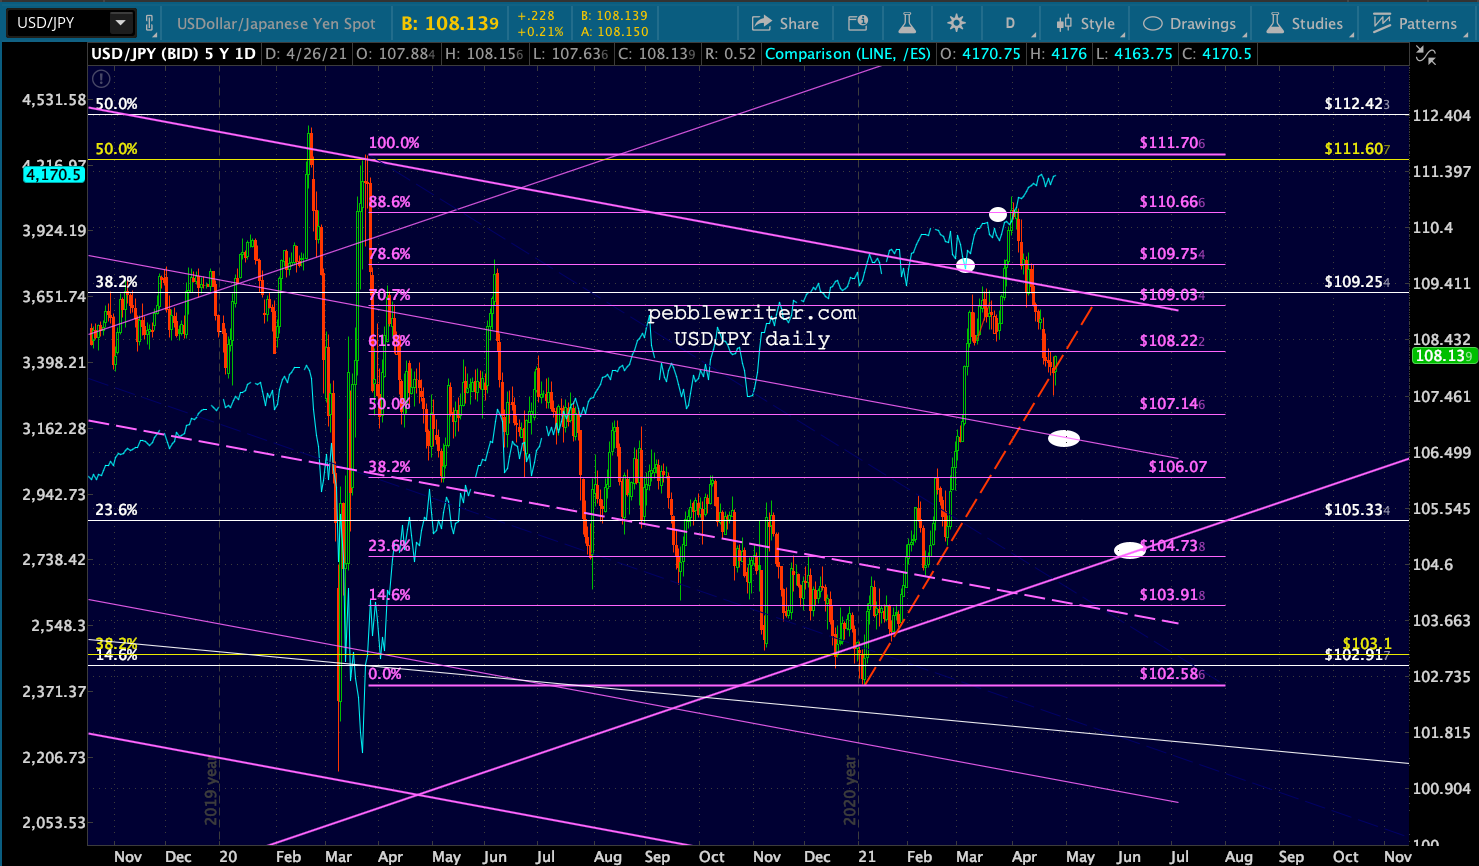
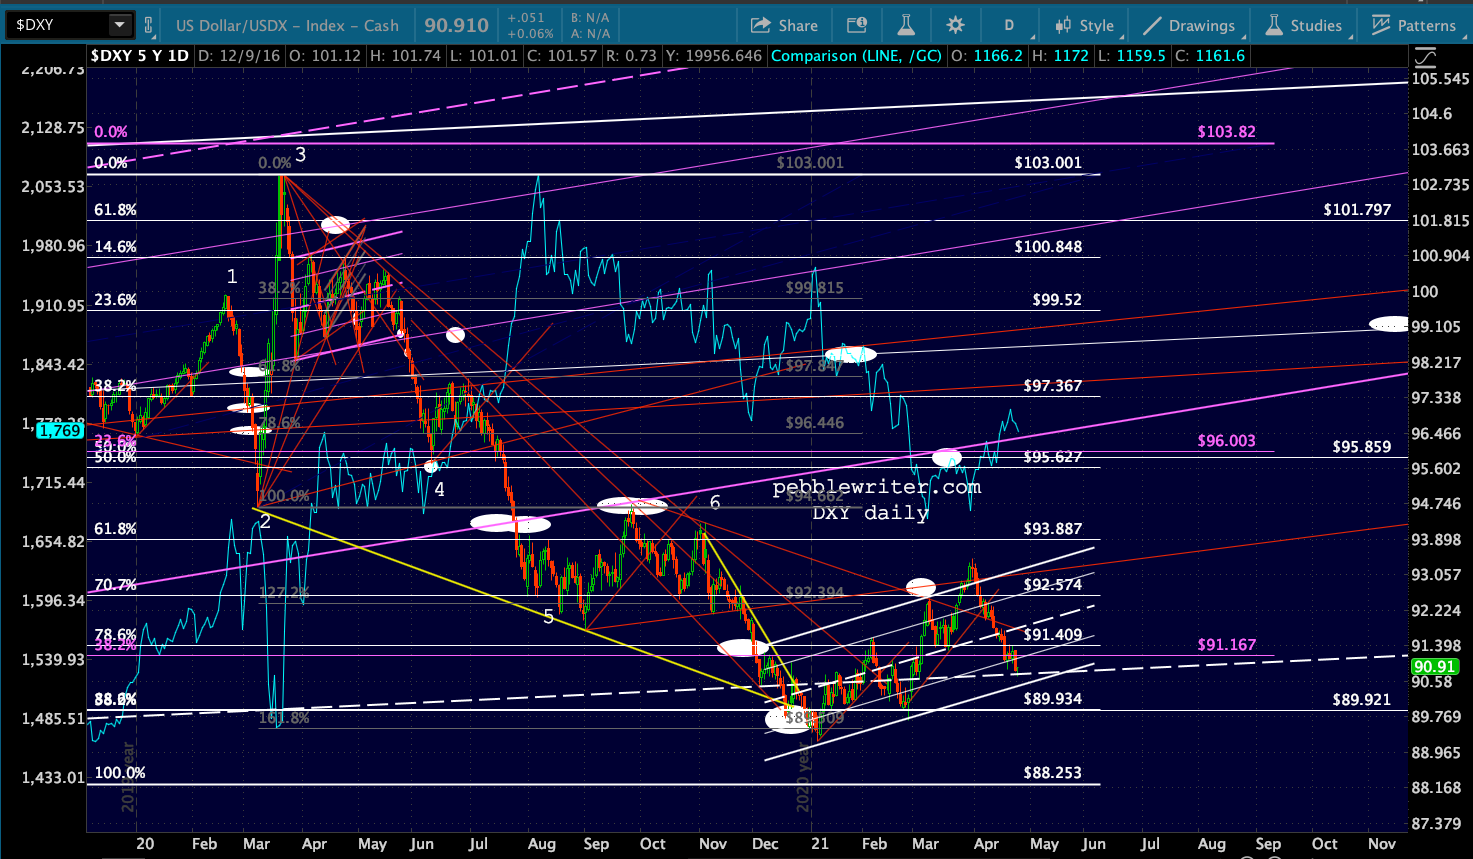
 USDJPY remains on the bubble, suggesting a breakdown of the red TL but not yet following through after Friday’s headfake.
 With housing prices, consumer confidence, oil inventories, Q1 GDP, initial claims, pending home sales, PCE, personal spending, Chicago PMI and Michigan sentiment all coming out this week, will the FOMC’s rate decision on Wednesday even matter?
 This leads us into a discussion of oil/gas prices – which have been stubborn about giving up any additional downside.


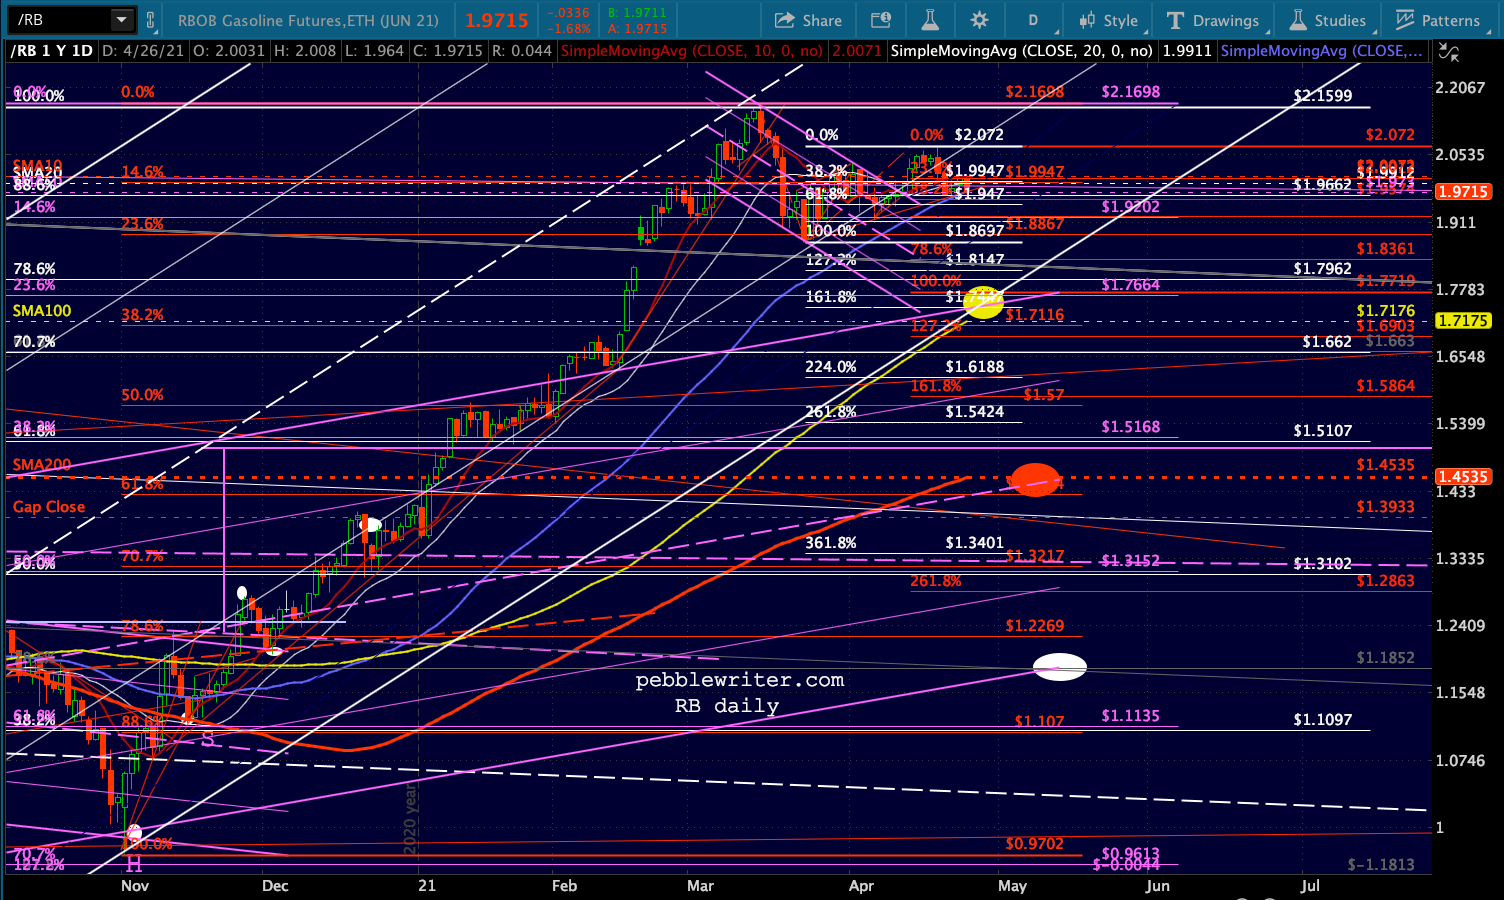
For several months, we have been anticipating a sharp decline in oil/gas prices due to the need to hold YoY CPI to an “acceptable level” – whatever that means these days.
It was pretty clear after the pandemic crash last year that the Fed needed oil/gas prices to recover in order to eliminate the deflation they had caused by crashing in March-April.
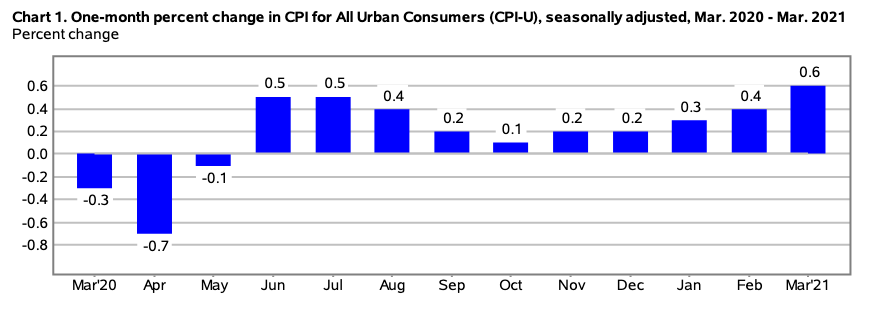 We can see a steady stream of large MoM increases in oil/gas…
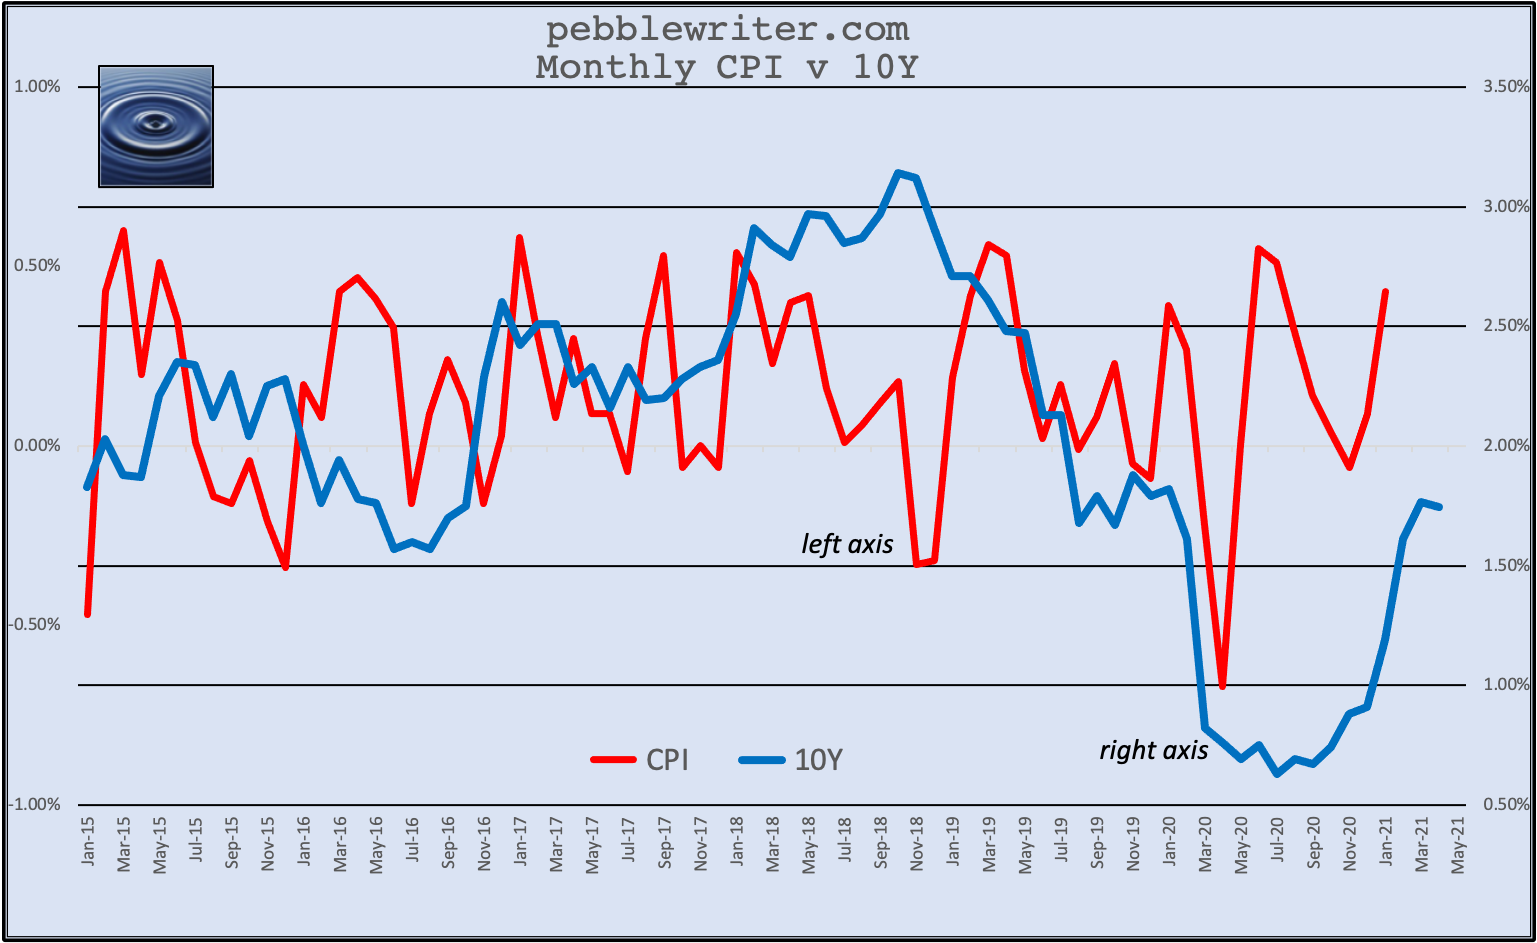
 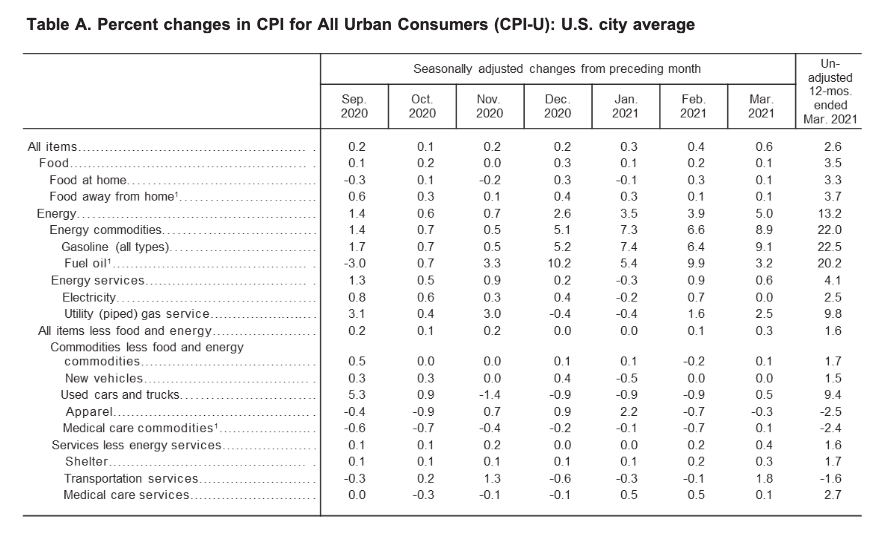 …that, by November 2020, had raised the MoM CPI back to a level (0.2%) consistent with 2%ish annual CPI. But, CPI remained stubbornly below 2% and couldn’t even top 1.5% until February when it jumped to 1.68%. In March, it spiked up to 2.62% – again, thanks mostly to soaring gasoline prices. Improbably, 10Y yields sank and prices rose.
 Disregarding food and energy, inflation has remained very subdued. This has allowed the Fed and its supporters to continually repeat the mantra that inflation is subdued and that very accommodative policy is still warranted.
  But, as we know, April CPI will shoot up sharply. Even if the EIA and the Fed play games with the numbers, it’s hard to imagine it coming in below 3% since YoY gasoline prices have soared. The final April data isn’t out yet, but at 2.77 as of last week it’s shaping up as flat MoM and a huge 61% YoY increase.
 I’ve shown this chart many times. The spike in April is baked in. The decline which begins in May presumes that gasoline prices remain level and the YoY comparisons begin to subside. The chart implies that interest rates will keep pace with CPI as they have for many years and that the 10Y will double to over 3% from its current 1.55%.
  The Fed is essentially betting that they can contain the bond market reaction as they did when March CPI was release on April 13. Recently, about 15% of the Fed’s monthly $80 billion in bond purchases comes on or around the day CPI data is released.
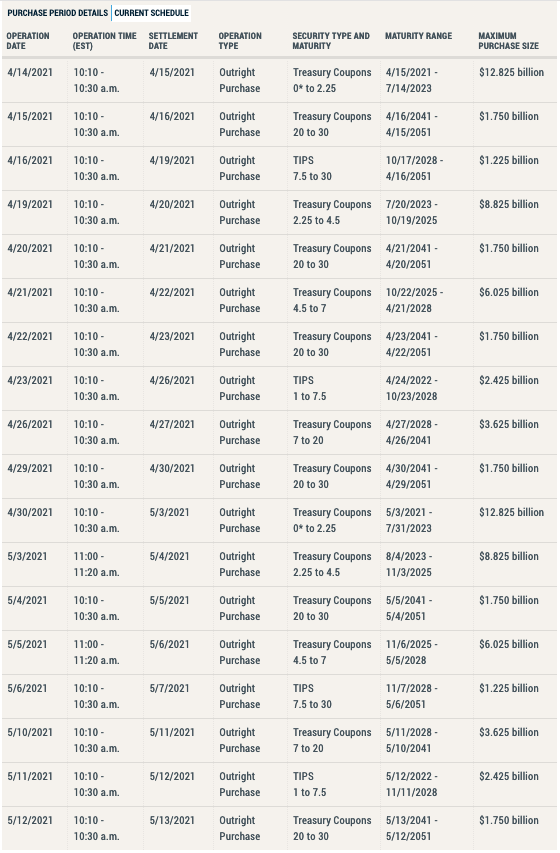
On April 14, the day after March’s blowout CPI was released, the Fed saw fit to purchase 24% of the month’s total scheduled $52 billion. The other big days, April 19, April 30 and May 3, are also big economic data release days. The next schedule will be released, not coincidentally, on May 13 at 3pm – later the same day as the April CPI data is released.
 The question we’ve been asking is “will the market care?” But, perhaps the better question is “can the Fed counteract the reaction the market might otherwise have to the data?” The MoM change in gas prices is shaping up as flat, which in the past has produced flat or even negative monthly CPI.
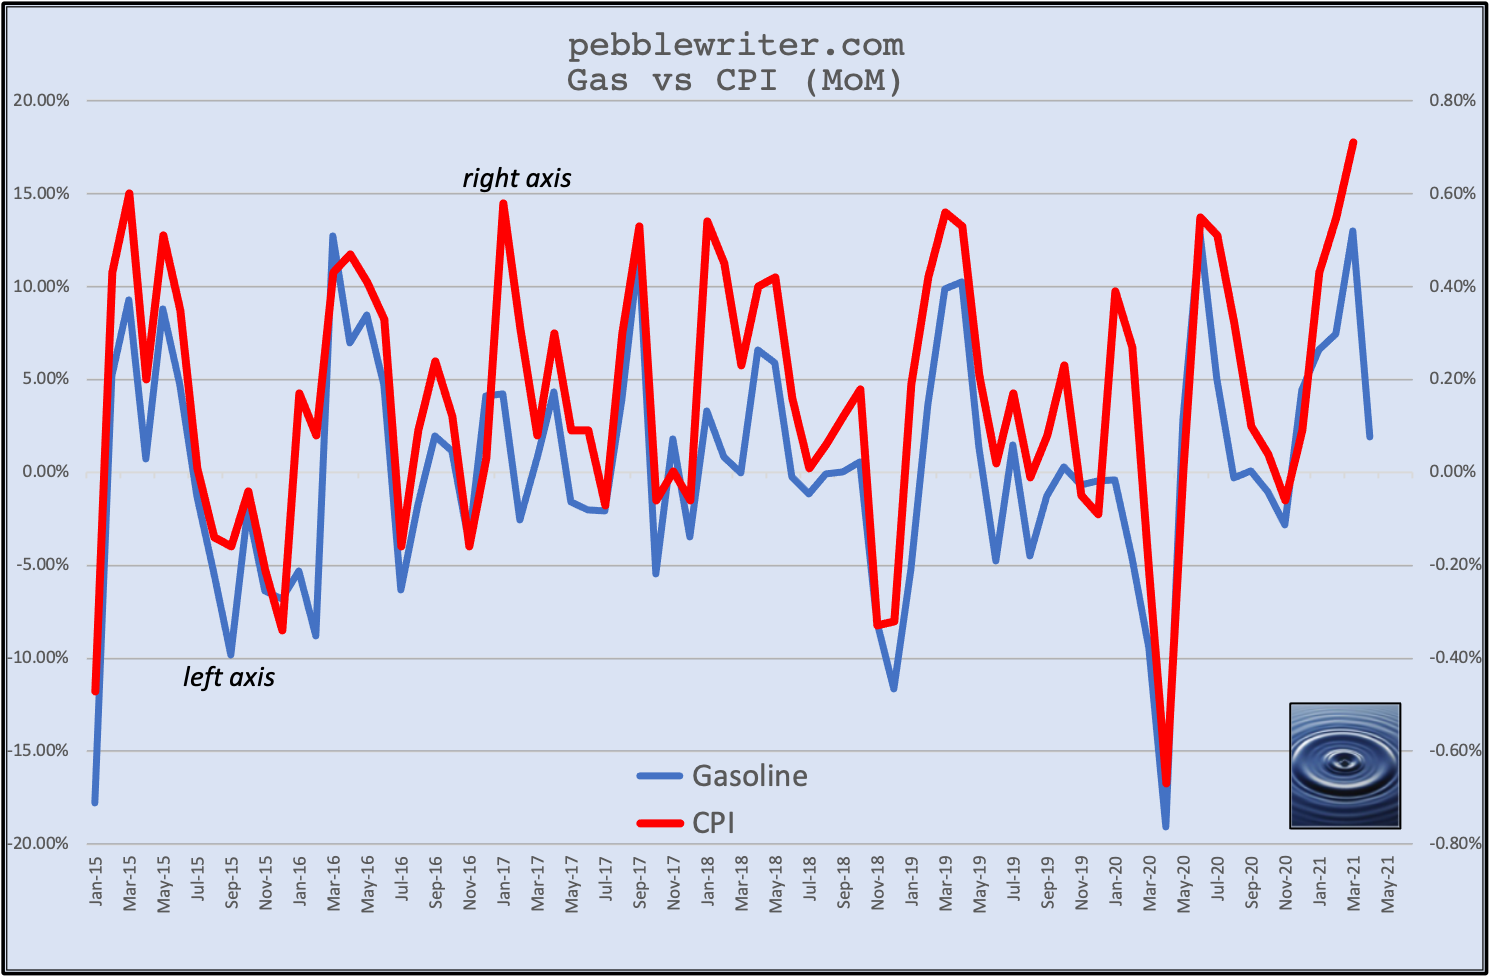 The times over the past year when MoM CPI dipped to near or below 0%, annual CPI was much lower too.
March 2020: -0.22% MoM, 1.54% YoY
April 2020: -0.67% MoM, 0.33% YoY
May 2020: 0.0% MoM, 0.12% YoY
Nov 2020: -0.06% MoM, 1.17% YoY
What would the markets think of a -0.5% MoM and 3.5% YoY print? I wish I knew. Over the past five years, the 10Y has followed annual CPI quite closely. 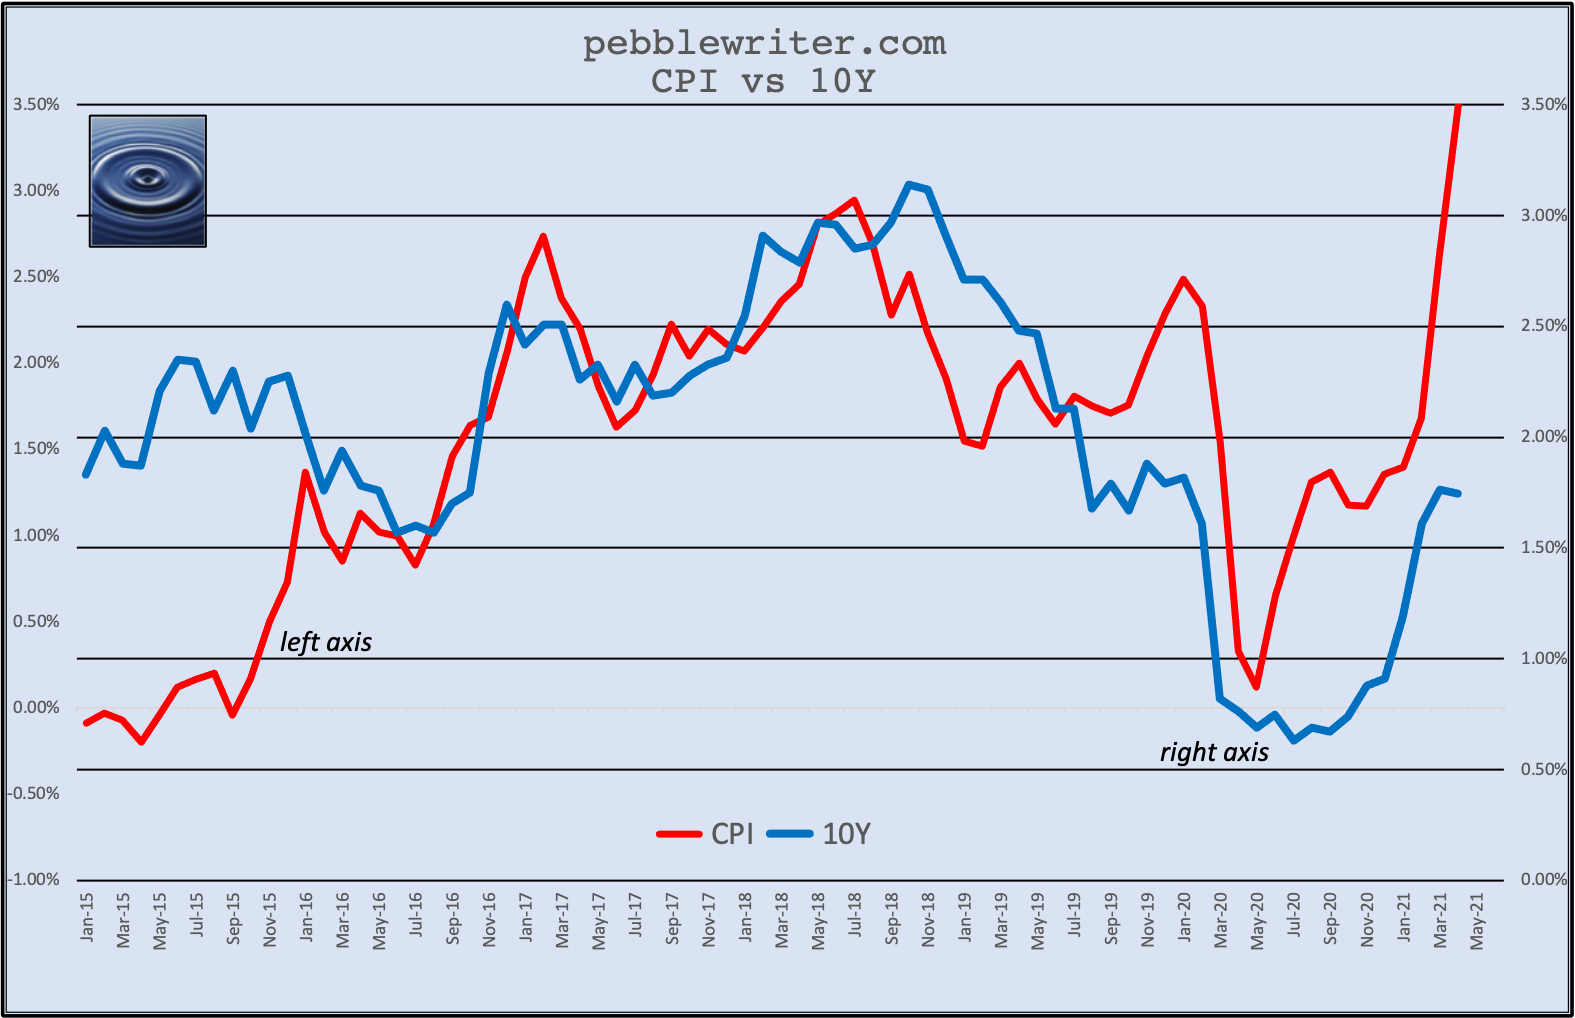 At this point, Apr monthly CPI is insulated from a big drop, meaning at least that we shouldn’t see a big negative print. In a way, that would be worse than an overshoot to the upside as it would do great damage to the reflation narrative.
Monthly CPI has not been very helpful in predicting the 10Y. But, it’s clear to see that when the 10Y has risen too high, say over 2%, CPI tanks pretty soon thereafter. On the other hand, the huge drop in the 10Y last year was followed very quickly by a rapid rise in CPI. Looking at it another way, the rapid rise in CPI took a while to produce a substantial rise in the 10Y.
 To sum things up, it is clear that April MoM CPI will be modest at best and possibly slightly negative due to the lack of help from gasoline. Annual CPI should be over 3%, possibly well over – though official government figures are often very manipulated.
If the 10Y decides to tag along and shoot up well above 2% or we see any substantial turmoil in markets, I should think the Fed would lose its nerve and we’d see oil/gas prices decline sharply in time for May’s data in June.
At current prices the YoY increase in gas prices would be around 56% in May and 38% in June — still well above the 30% increase that produced 2.62% CPI in March.
According to the US Treasury, they expect to issue a net $95 billion in Q2 (Apr-Jun 2021.) So, a purchase by the Fed of $50-80 billion per month during this period could offset the impact of any disruption. As the BoJ has taught us, you don’t have to worry too much about issuance if your affiliate buys everything you issue.
I’m finishing this post the morning after because I wanted to ponder all the above issues. Each and every correction I’ve called in oil/gas took longer to unfold than expected – meaning weeks or sometimes months of frustration.
The Fed has obviously made the judgement that April’s huge spike in inflation can be explained away as transitory – meaning the market won’t care – or can be handled via treasury purchases in the open market and through the trading desk’s manipulation in futures.