

Companies and individuals alike are cutting back their activities as the omicron outbreak continues to accelerate. Many companies, short of employees, supplies, or customers are raising pay, trimming back hours or cutting product offerings in order to stay afloat. Individuals are cutting back their activities in order to stay healthy.
Though not official, the shutdown is real and is spreading, complicating the Fed’s already arduous task of reversing runaway price inflation. Woefully behind the inflationary curve, the Fed is leery of tipping the economy into stagflation and even more leery of tripping up the stock market. With that as a background, we’ll take a look back at 2021 and what to expect in 2022.
The Bear Case
As we’ve discussed many times over the past year, the market has responded positively to the prospect of reinflation. Stocks rally, for instance, when oil and gas prices rise – a sign of increased economic activity. But, the rally in oil and gas prices finally went too far, turning what might have been narrowly-focused, transitory inflation into widespread, persistent inflation which has permeated the labor market – the most sticky category of all. Inflation won’t subside unless the oil and gas rally at least flatlines – a negative for stocks.
The falling US dollar has likewise benefited stocks, but contributed to the spike in inflation as imports became pricier. DXY’s bounce off its May 2021 lows has been tentative, barely reaching the halfway mark of its drop from its March 2020 highs. Lower inflation will require the dollar to strengthen – a negative for stocks.
Historically low interest rates have obviously contributed to the market’s success over the past year. Companies and (some) individuals can borrow more cheaply, leveraging existing revenue streams into higher profitability. The present value of a future stream of income is worth more. And, perhaps most importantly, funds which might have been invested into bonds have landed instead in equities. If rates increase, as the Fed suggests they will, this would also be a negative for stocks.
Obviously, reflation wasn’t the only factor in last year’s rally. The Fed poured $8.7 trillion into markets between March 2020 and December 2021, reinflating bubbles in stocks and commodities and essentially destroying price discovery in the bond market. If the Fed sticks to its accelerated tapering schedule, that assistance will grind to a halt in March 2022 – an enormous negative for stocks.
The Bull Case
Even as it tapers, however, the Fed is still slated to pump a few hundred billion into markets by March 2022. No one would be shocked to see the taper schedule adjusted if, say, COVID continued to accelerate and economic activity the stock market took a major hit.
How and when the Fed “invests” those funds before the music finally stops could still exert a great deal of influence on markets. By periodically swooping in to hammer interest rates, manipulate currencies, or crush vol, the Fed still has the ability to influence markets. Algos are usually only too happy to play follow the leader.
Then, there’s the issue of the narrative. Although its reputation is somewhat impugned, the Fed’s utterances still carry weight. Consider how many months it took for the financial press to finally question the Fed’s “transitory inflation” fairy tale. Even with CPI at 6.8%, you still hear the word bandied about.
Fundamentally, many corporations have taken advantage of the Fed’s largesse to improve their balance sheets – retiring debt with lower priced borrowings or generous equity offerings. To the extent the economy is able to continue humming along, many also enjoy pricing power which will give them at least a fighting chance to keep up with inflation.
And, unless rates rise very sharply, stock repurchases will continue to be a major driver of rising stock prices. Companies no longer seem to care about appearances, tying purchases to tests of important price levels – an activity which used to be considered price manipulation.
There will be winners and losers, of course, with the largest and best capitalized companies continuing to attract the lion’s share of investment, even at nosebleed valuations in the absence of profits. Stay-at-home stocks will remain vulnerable to sharp downdrafts following positive COVID news and sharp rallies in response to negative COVID news. Should the pandemic eventually pass and markets balance themselves out, reopening stocks might even grow into their overinflated valuations.
The Verdict
Instead of one case or the other proving out, I see a strong possibility that both come to fruition. As we’ve discussed, inflation is a math problem. CPI is only 6.8% because of strong YoY increases in prices. If already elevated prices were to stabilize at present levels, it would hurt those already suffering from cash flow issues, but CPI would drop sharply as YoY price comparisons slid back toward a more acceptable 2-3%.
Once CPI reaches that range, the impetus for higher rates would be eliminated. This is the scenario the Fed was hoping for when first touting the transitory story. They either miscalculated badly or decided that prospective market gains justified consumers’ pain.
Of course, there’s another way rates could be contained, albeit one that involves a little short-term pain for longer-term gain. When equities sell off sharply, interest rates tend to plunge as well. A substantial equity correction triggered by a sharp drop in oil/gas prices and spike in the US dollar would knock inflation and interest rates back in a hurry.
If prices were to then stabilize and then resume a gradual increase with CPI and the 10Y in the 90 bps – 1.5% range, we’d again have a very constructive environment for equities. We came very close to this scenario unfolding several times over the past year.
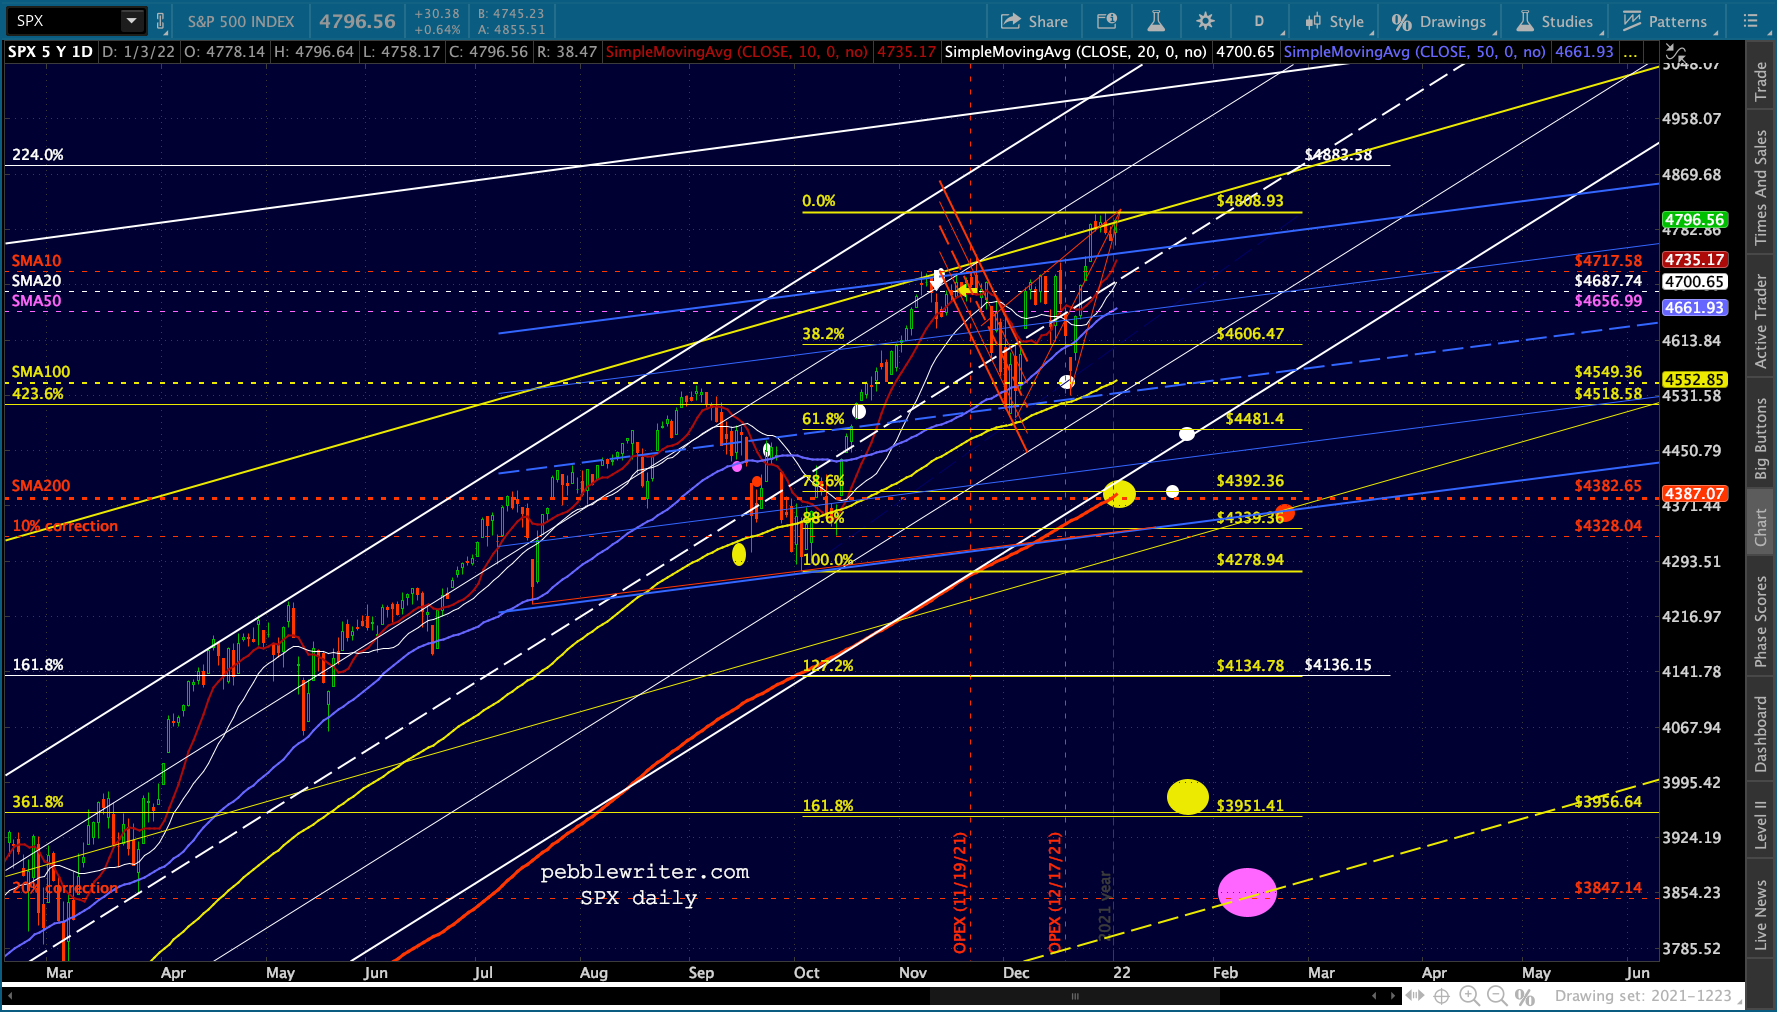
Since June 2020, potential corrections have been halted 12 times by the 50-day moving average, 7 times by the 100-day moving average, and twice by the 200-day moving average.  There was only one significant lower low during that period – the Sep 20 – Oct 1 Head and Shoulders pattern slump that produced a whopping (sarc) 6.3% drop that was erased within 3 weeks. Had the pattern played out normally, it would have resulted in a 20% drop and the backtest of a major Fibonacci level.
 However, it would also have required a drop below the 200-day moving average – an unacceptably bearish development in Chartland. Instead, VIX was hammered by 50% and WTI and USDJPY made new highs. Algos responded and the bearish pattern was promptly busted.
Interestingly, SPX/ES face another similar opportunity. But, things are different this time.
continued for members…This time, a 10% drop in ES would land it right at the .886 Fib retracement (4321.53) of the rise from Oct 1 and within 1.4% of the SMA200. This would also put it at the bottom of a channel from the afore-mentioned June 2020 lows.
 Alternatively, if it took a few more days to play out, it could backtest the .786 at 4375.50 for a total drop of 8.8%.
The SPX version is cleaner in a sense, with the rising white channel bottom aligned with the SMA200 and yellow .786 or the 10% correction aligning with the .886. Either would work in terms of the scenario envisioned, particularly if the selloff were abrupt enough.
 Note that a 10% selloff in DJIA would land it at almost exactly the 1.272 extension – the next rung down on the Fib scale…
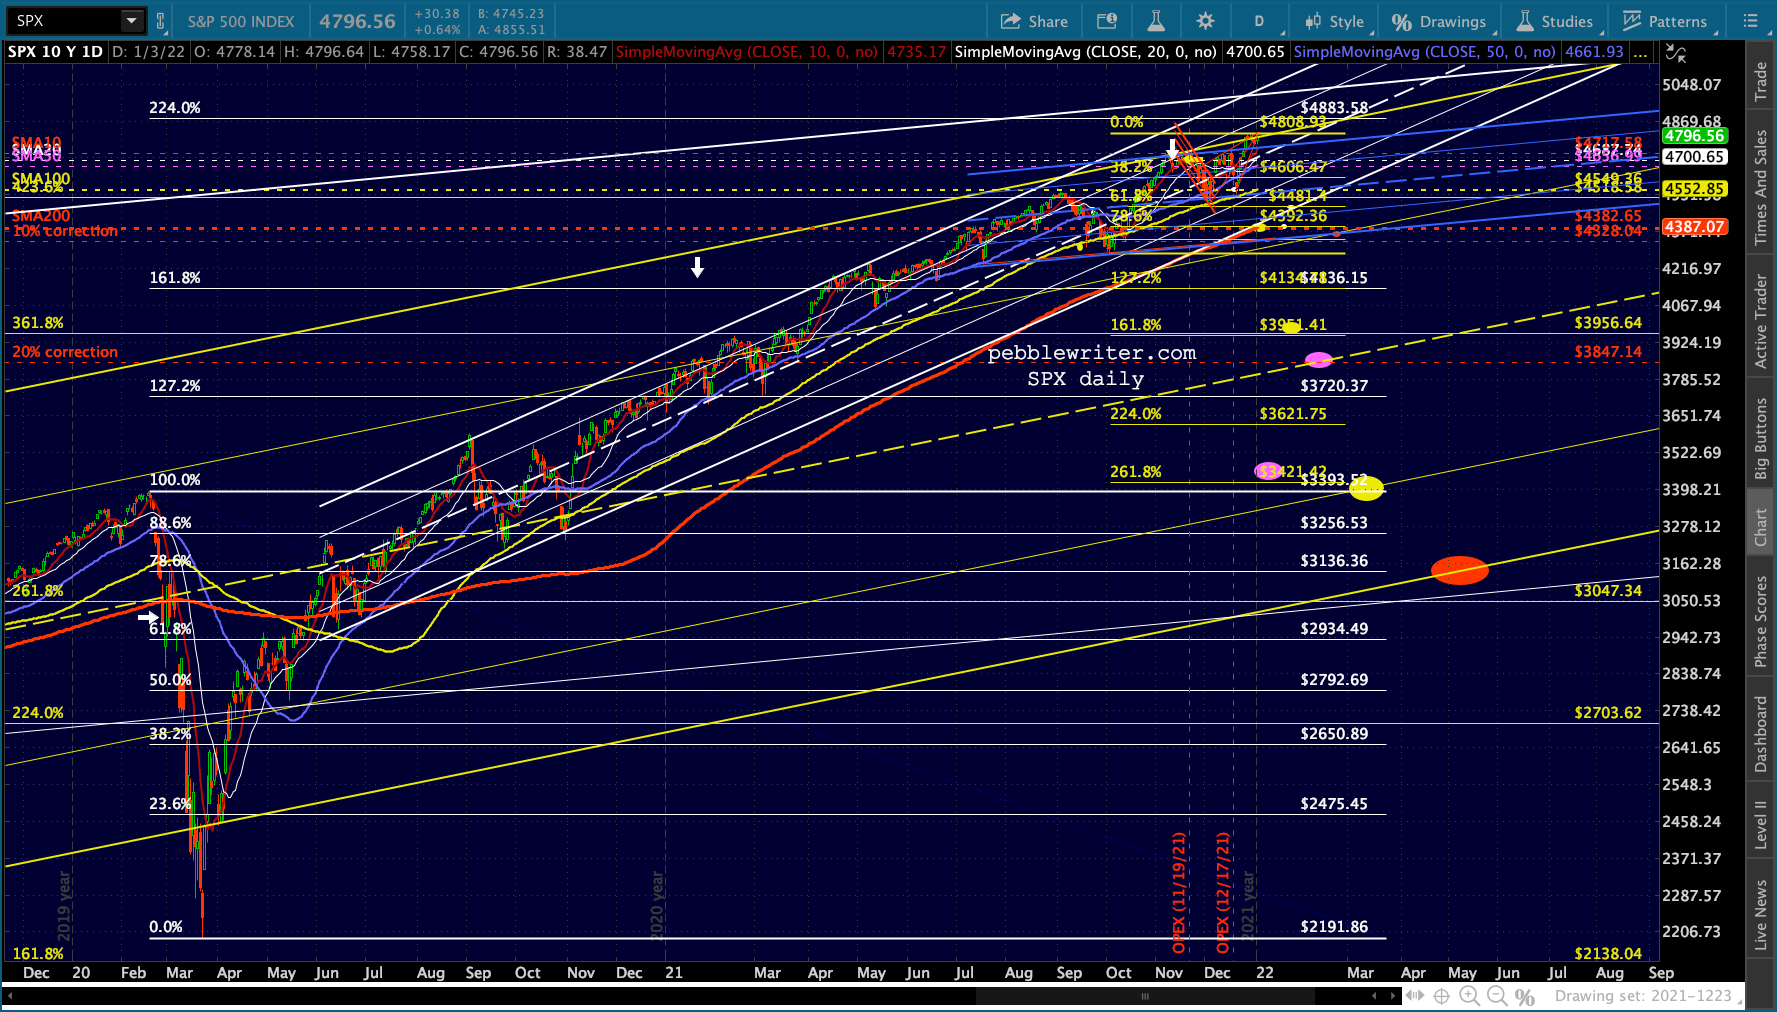
 …and a 20% correction would land it at almost exactly the Feb 2020 highs. If it waited until May (sell in May and go away) it would also intersect the rising white channel midline.
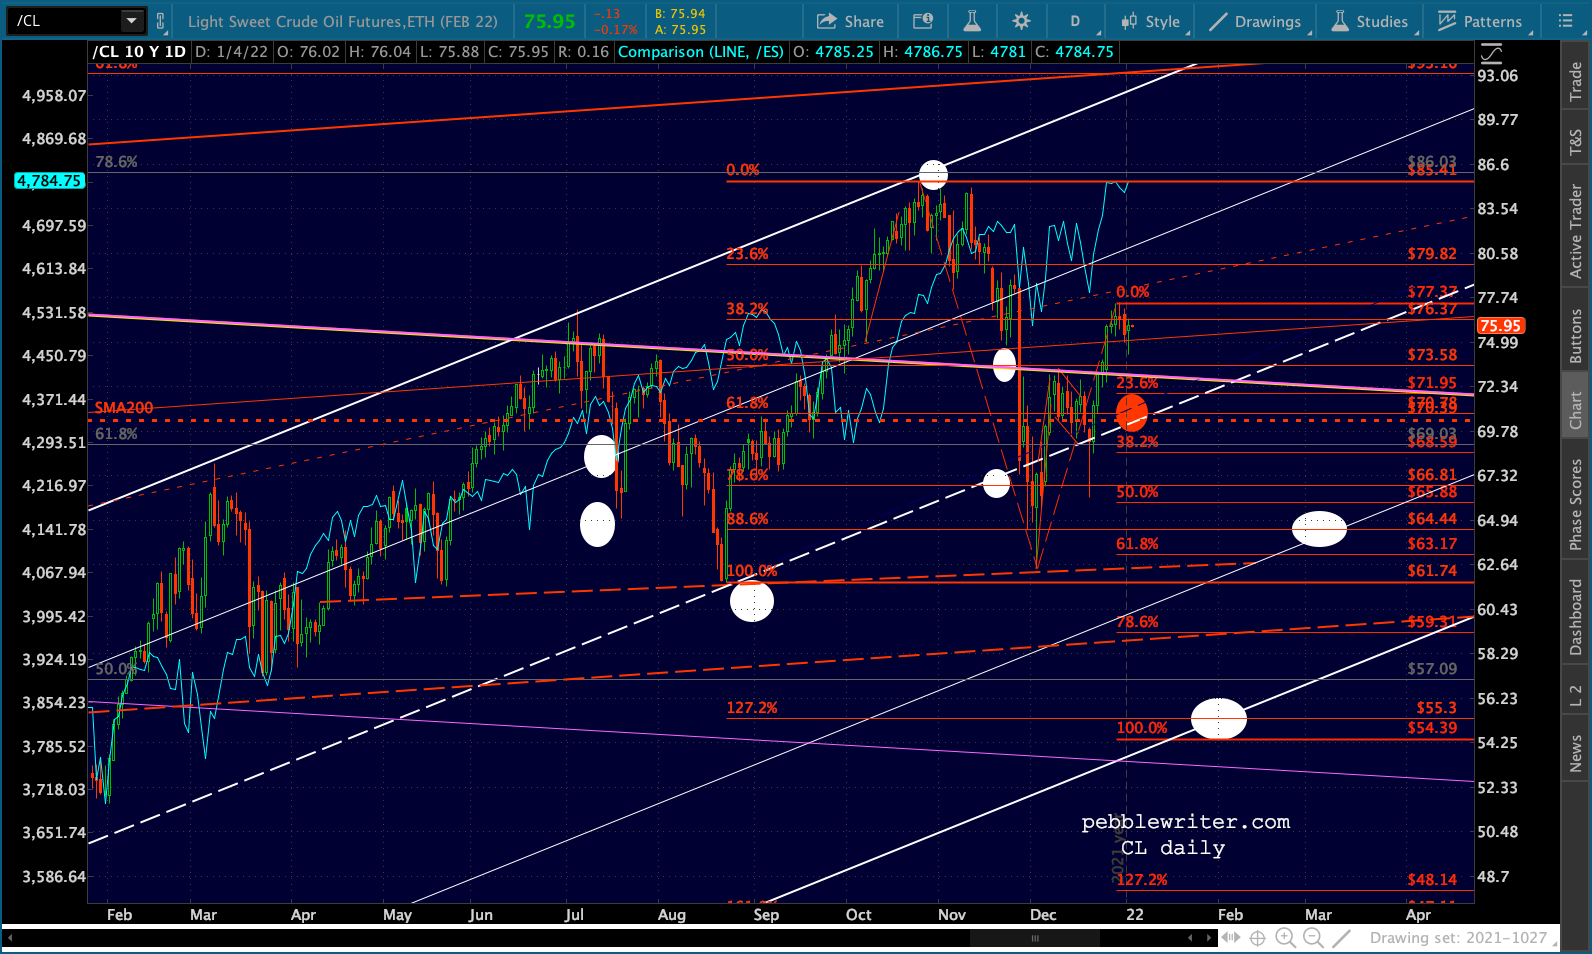
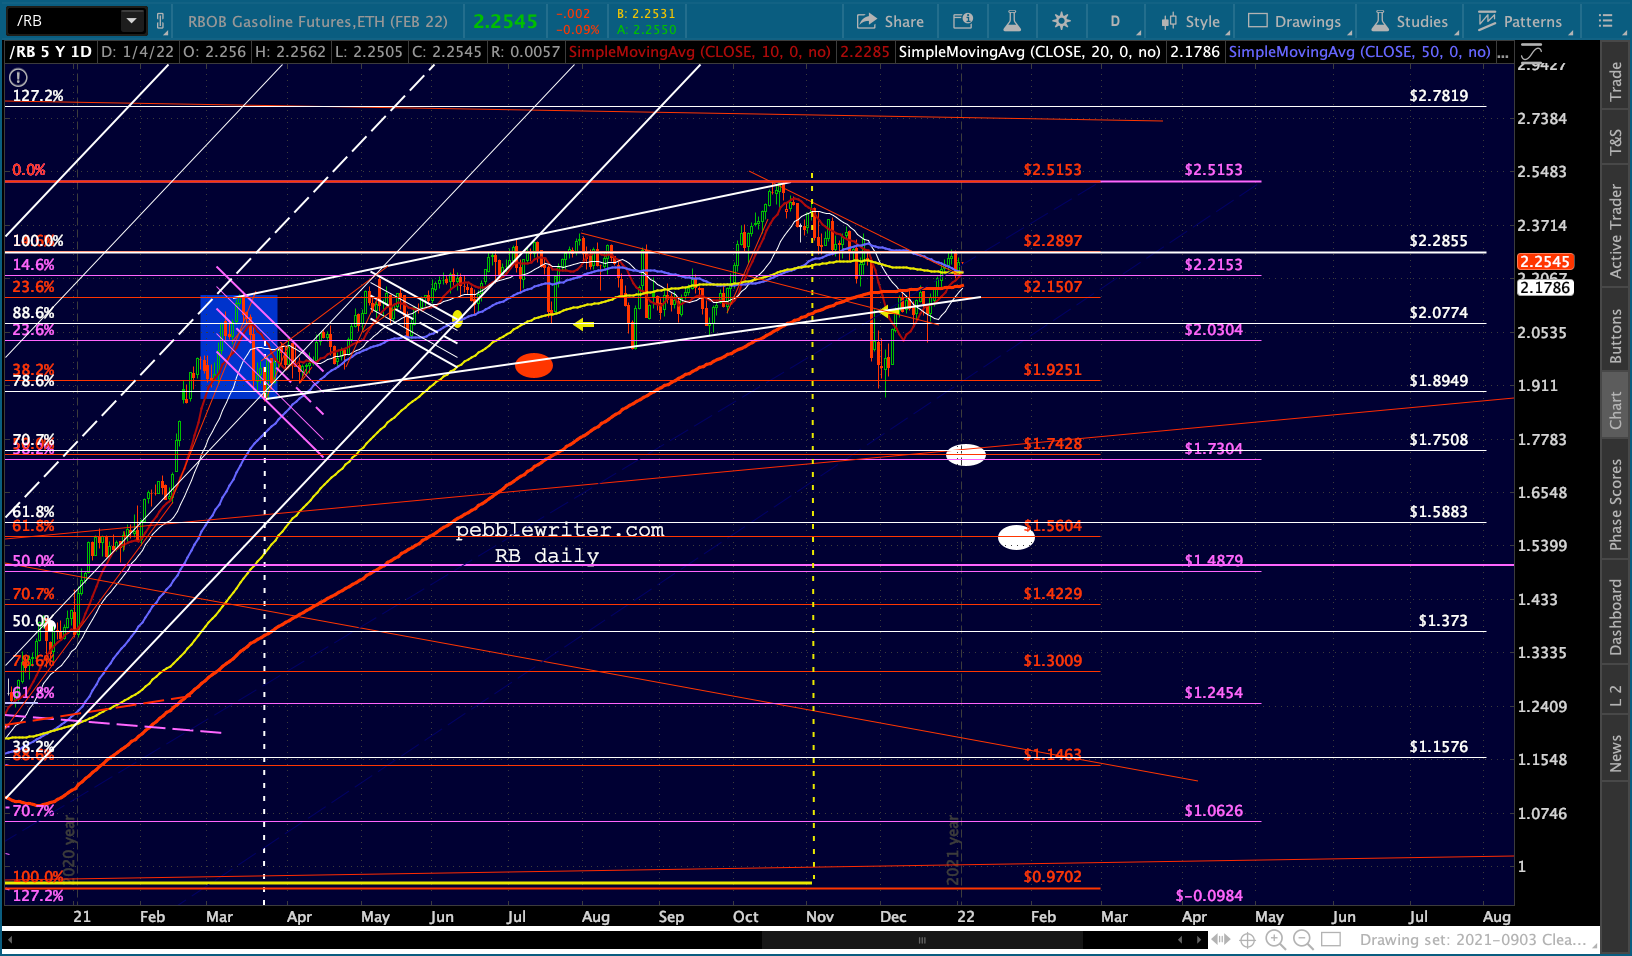
 In recent years, CPI of 2-3% has been associated with a YoY delta in gas prices of about 12-18%. For RB, this would mean an average in March 2022 of about 2.25 – essentially where it is now. For CL, about 69 – slightly below current levels.
But, this scenario wouldn’t take into account the higher, stickier categories of CPI which are unlikely to play along to the downside – at least as quickly. Food and fuel prices, for instance, are correlated. But food prices lag fuel prices and a leveling off of oil and gas wouldn’t likely have much effect.
So, our assumption is that oil and gas, being the less sticky and more easily manipulated components of inflation, will overshoot to the downside and could therefore provide a healthy dollop of deflation. With any luck, their drop could take knock down some of the other categories which have been on a tear.
The weights of the individual components are as follows:
- Food and Beverage: 16.7%
- Housing: 40.9%
- Apparel: 3.0%
- Transportation: 16.9%
- Medical Care: 7.6%
- Recreation: 5.2%
- Education and Communication: 6.6%
- Other Goods/Services: 3.3%
Commodities account for 41.2% of CPI while services account for 58.8%. Food accounts for 15.7% of the total, while energy accounts for 7.4%. Excluding those two categories leaves 76.9% – most of which is very, very sticky. So, the overshoot argument is probably pretty solid. Therefore, our assumption of a significant tumble in the very near future stands.
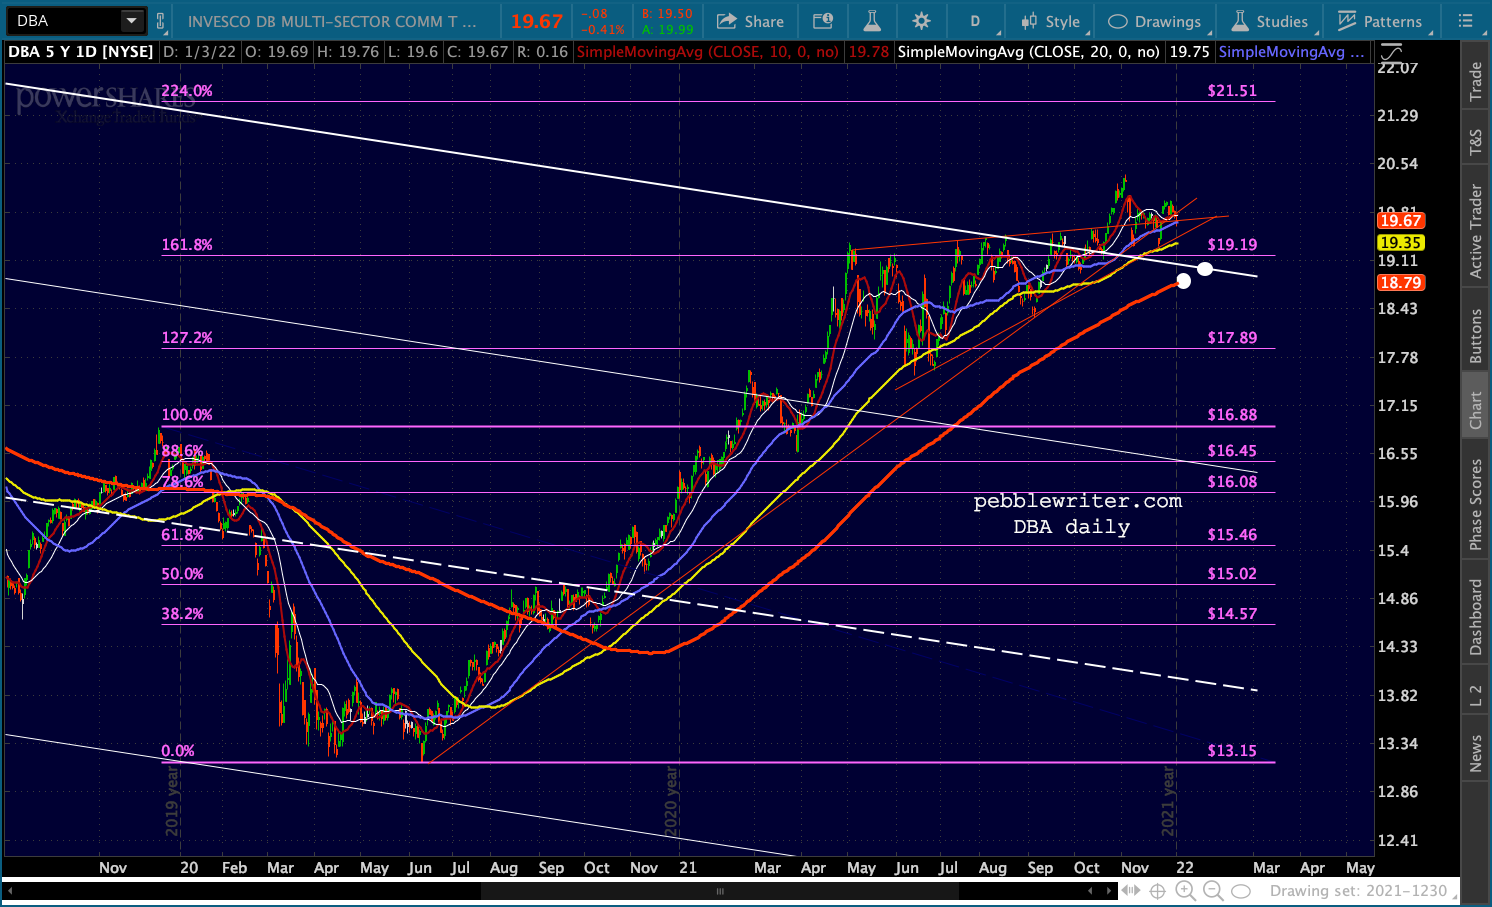
 It would also make sense for agricultural commodities to break down – falling back into the channel from which they broke out.
Our assumption has been that DXY will reach its backtest target of 97.73 very soon. The relative dollar strength would be driven by a drop in EURUSD and/or a rise in USDJPY.
New highs in USDJPY would serve as a safety valve for stocks – basically, in case a correction gets out of hand or to prevent a correction in the first place. An equity correction would likely mean a backtest of the SMA200 as it reaches 111.60.

 Now, the tricky part. If we’re right about a downturn which has the potential to reset inflation and interest rates lower, we should know very soon. Otherwise, interest rates are in a position to break out to untenable levels…
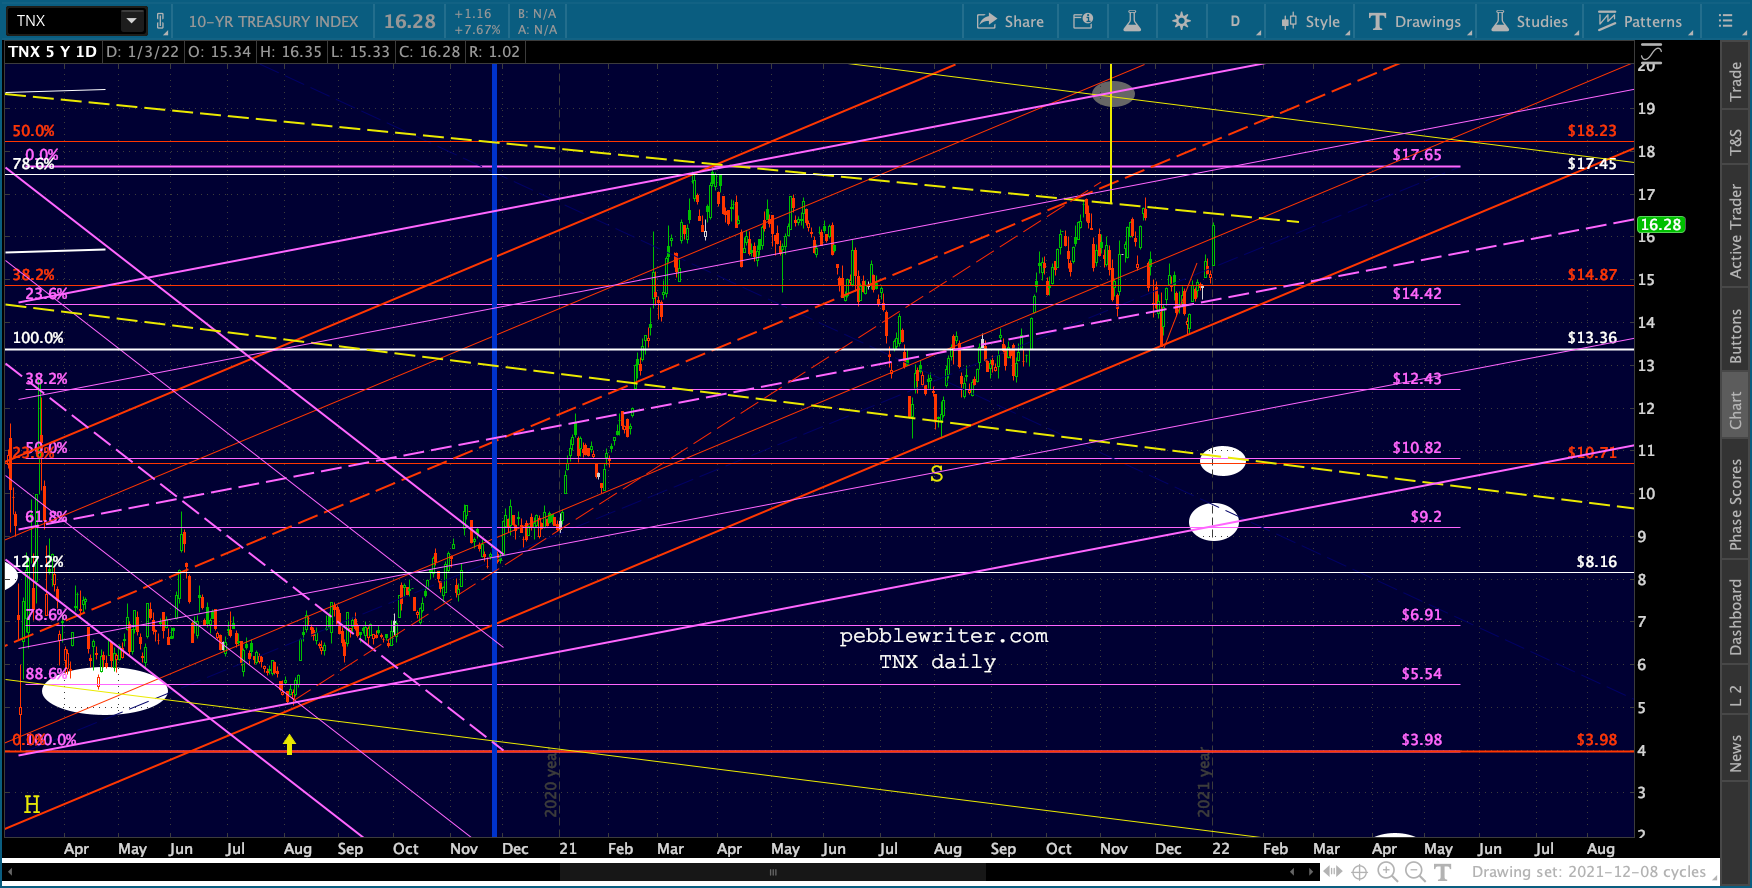 …potentially breaking out of the huge yellow channel.
 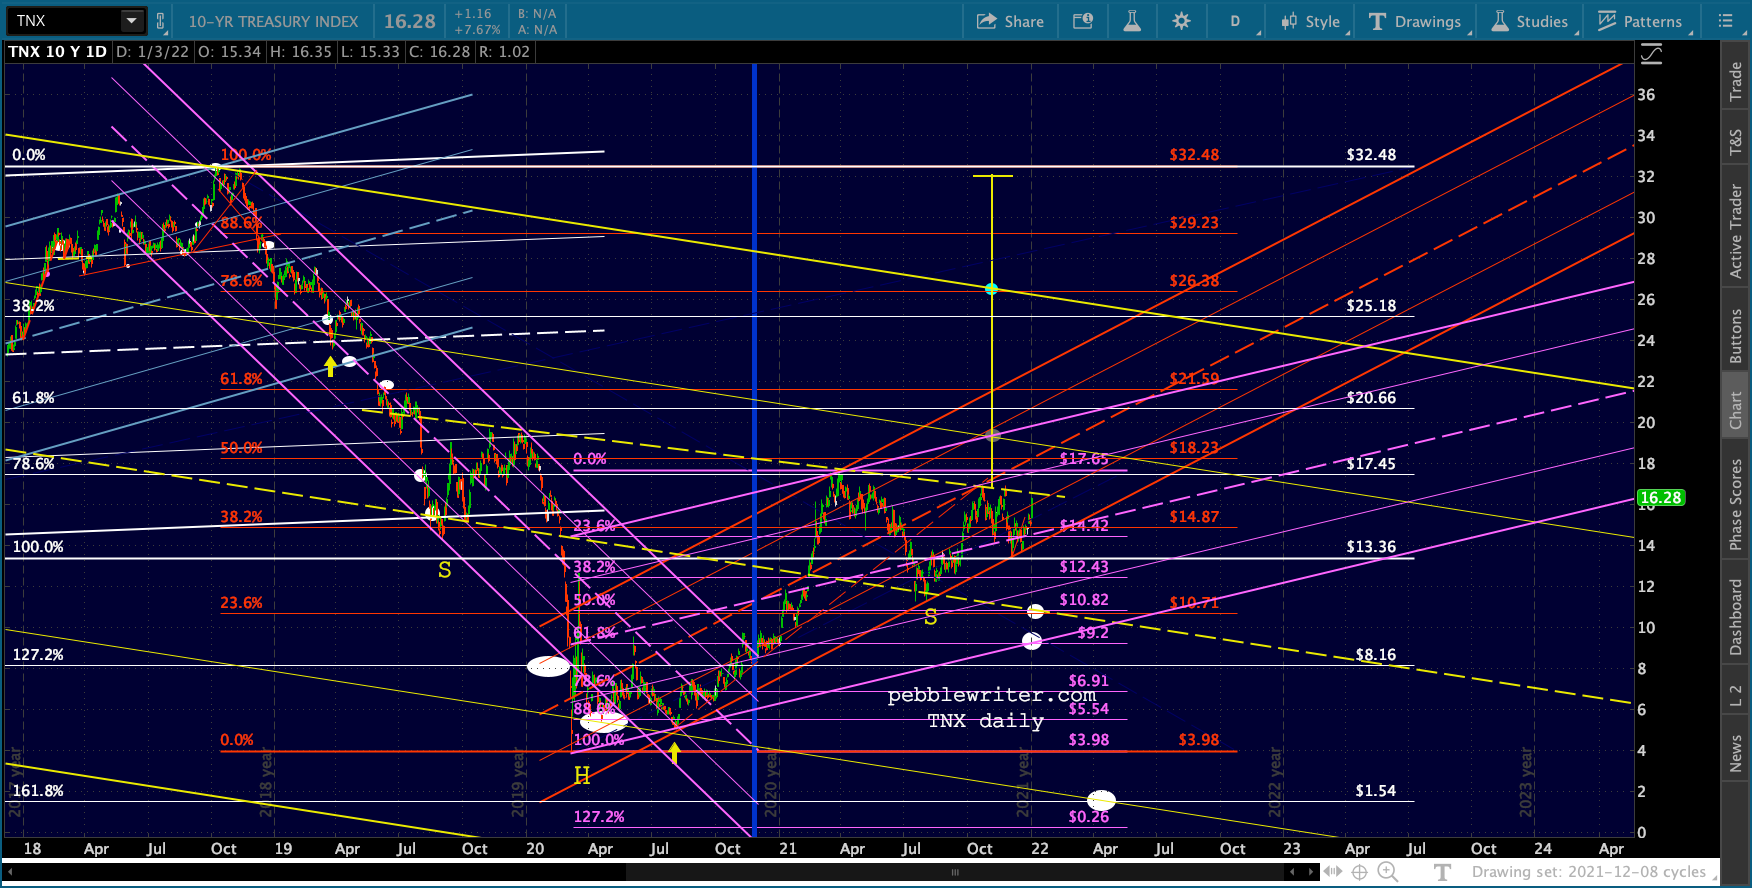 I believe this is the nightmare scenario as far as the Fed is concerned. Given the nearly $30 trillion in debt now on the books, a breakout of this channel would be a disaster.
 Final thoughts
The market has held up incredibly well through some pretty tough circumstances due to the incredible support it has received from the Fed. The above scenario presupposes that the Fed has finally seen the light and is willing to take whatever steps are necessary in order to get inflation back down to 2-3% quickly. This might not be a correct assumption.
I spent much of 2021 expecting them to take action to prevent the high levels of inflation we now have. I was wrong. They not only allowed inflation to rise above target, they continued to stoke it with an insane amount of stimulus and insisted it was transitory even after multiple categories spiked above 2% annually.
The above focuses on several obvious methods of propping up markets: oil and gas prices, interest rates, currencies. But, it leaves out the most powerful of all: VIX. We have noted countless timely declines in VIX which resulted in breakdowns of trend lines, key Fib or moving average levels, etc. A collapse below the TL off the Nov 2017 lows could easily offset any bearish signals thrown by oil, currencies, or interest rates. 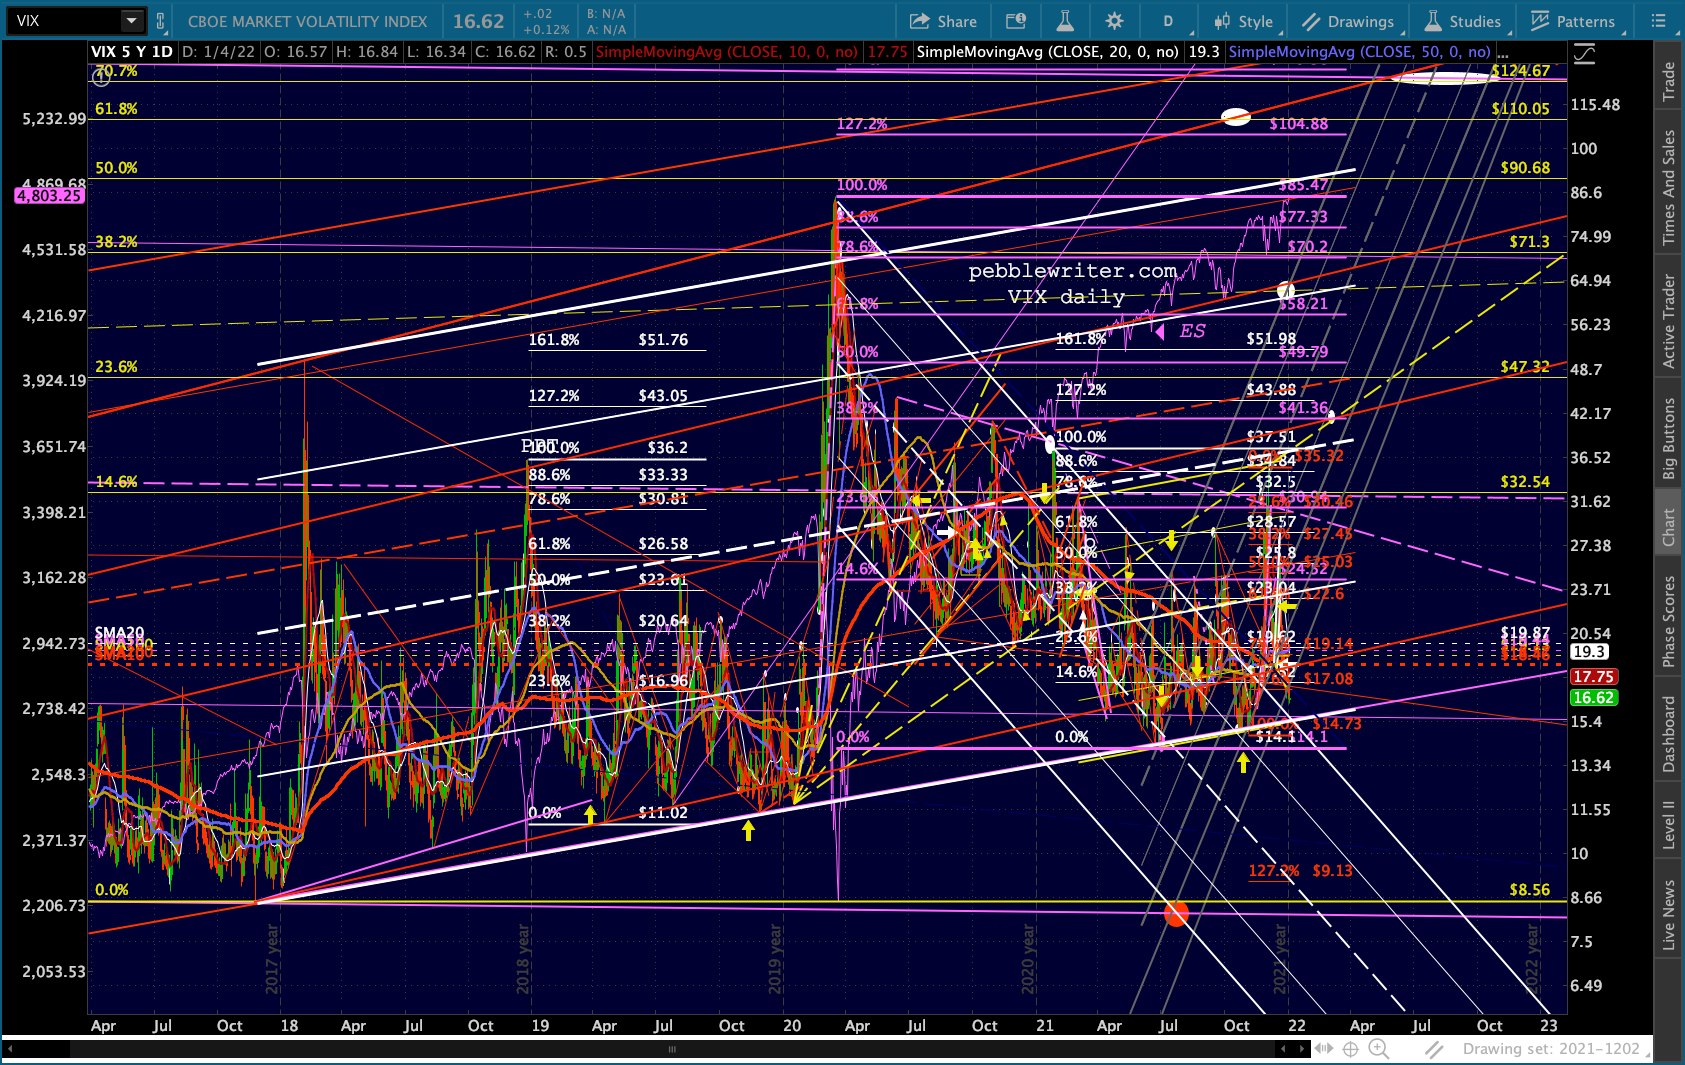 Bottom line, declines in equities may continue to be hard to come by. Even if the Fed allows a bearish equity scenario to unspool, there are other central banks and institutional investors with plenty of juice and competing interests. Until we see some weakness enter the equity markets, the assumption should be that the meltup will continue and the better trading opportunities will be in the factors used to prop up stock prices.
GLTA.