

The Dow, the most easily and commonly manipulated index, has gone nowhere since failing to hold its 3.618 Fib extension at 34,430. It begs the question: what’s the holdup?
 Usually, when a closely followed index goes sideways for a while, it’s because an important moving average is moving into position for a backtest. But, is that the case here?
continued for members…
First, a quick overview:
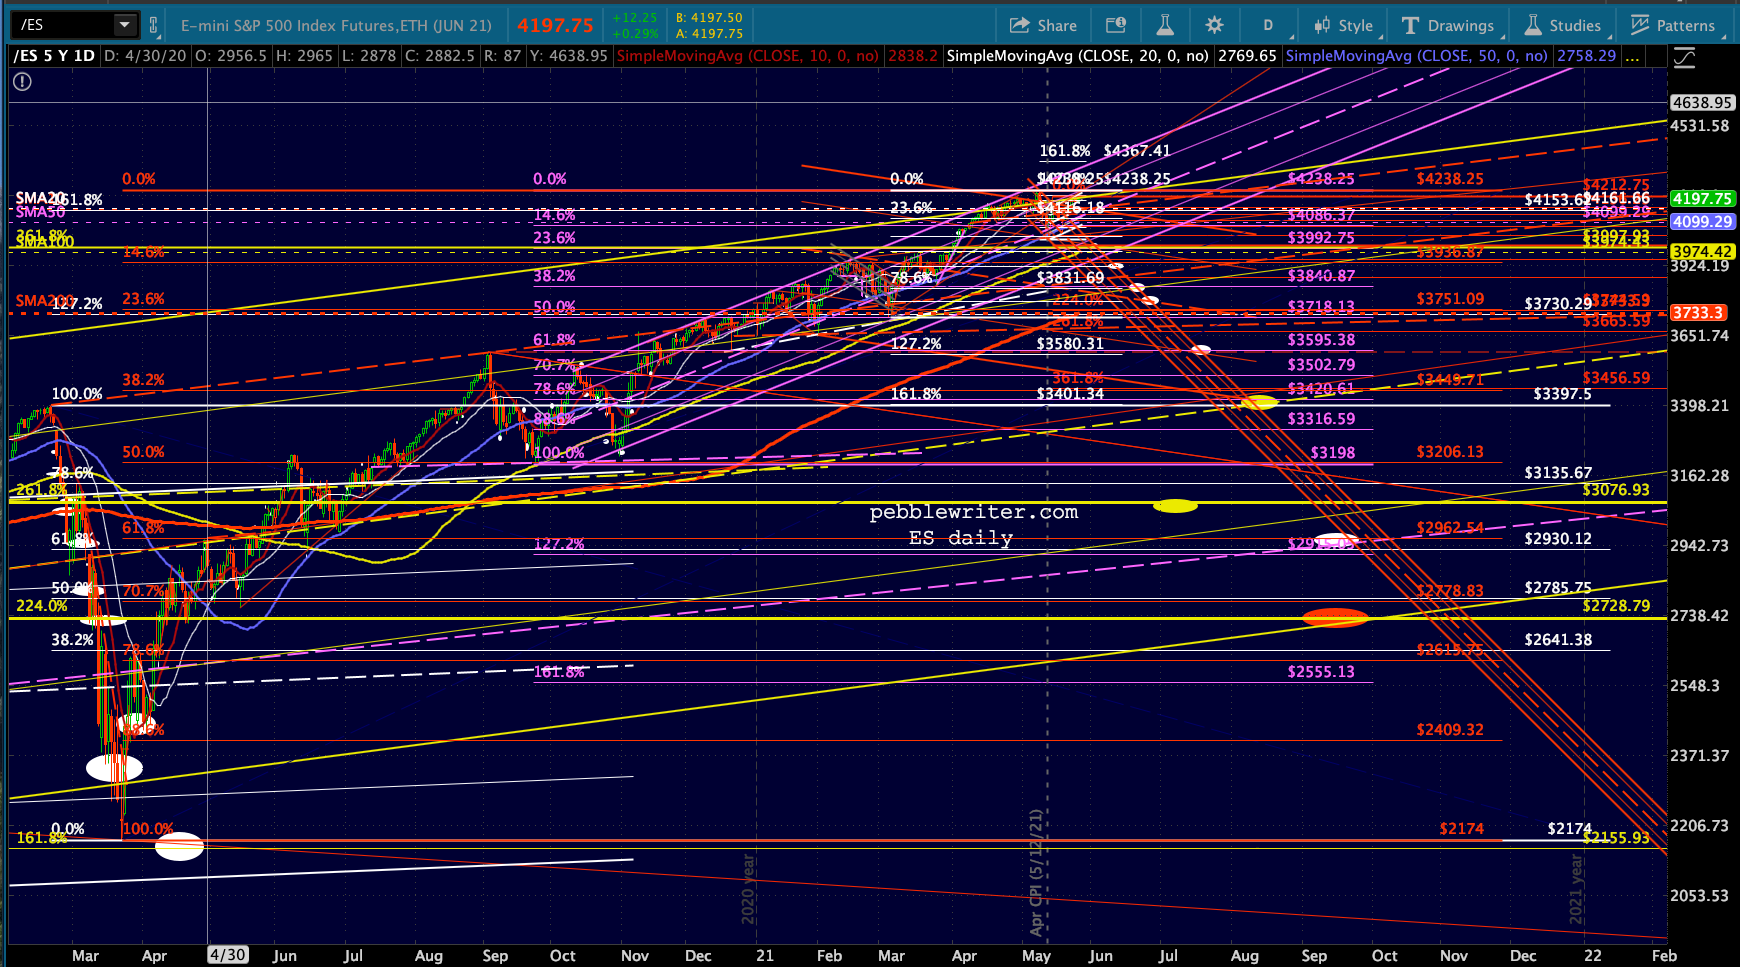
ES’ flag pattern is still intact, with a near .886 tag to boot. Until this changes, this means the next leg should still be down. The flag pattern now points to 4003.75 – barely above the 3.618 at 3997.93.


 Like ES and SPX, VIX is in the process of trashing a perfectly formed channel – or at least that’s the message it’s sending. This one looks to be breaking down – though it did that once before and ended up spiking much higher after CPI came out. I’m prepared for additional downside in VIX in order to keep stocks from breaking down until it’s time.
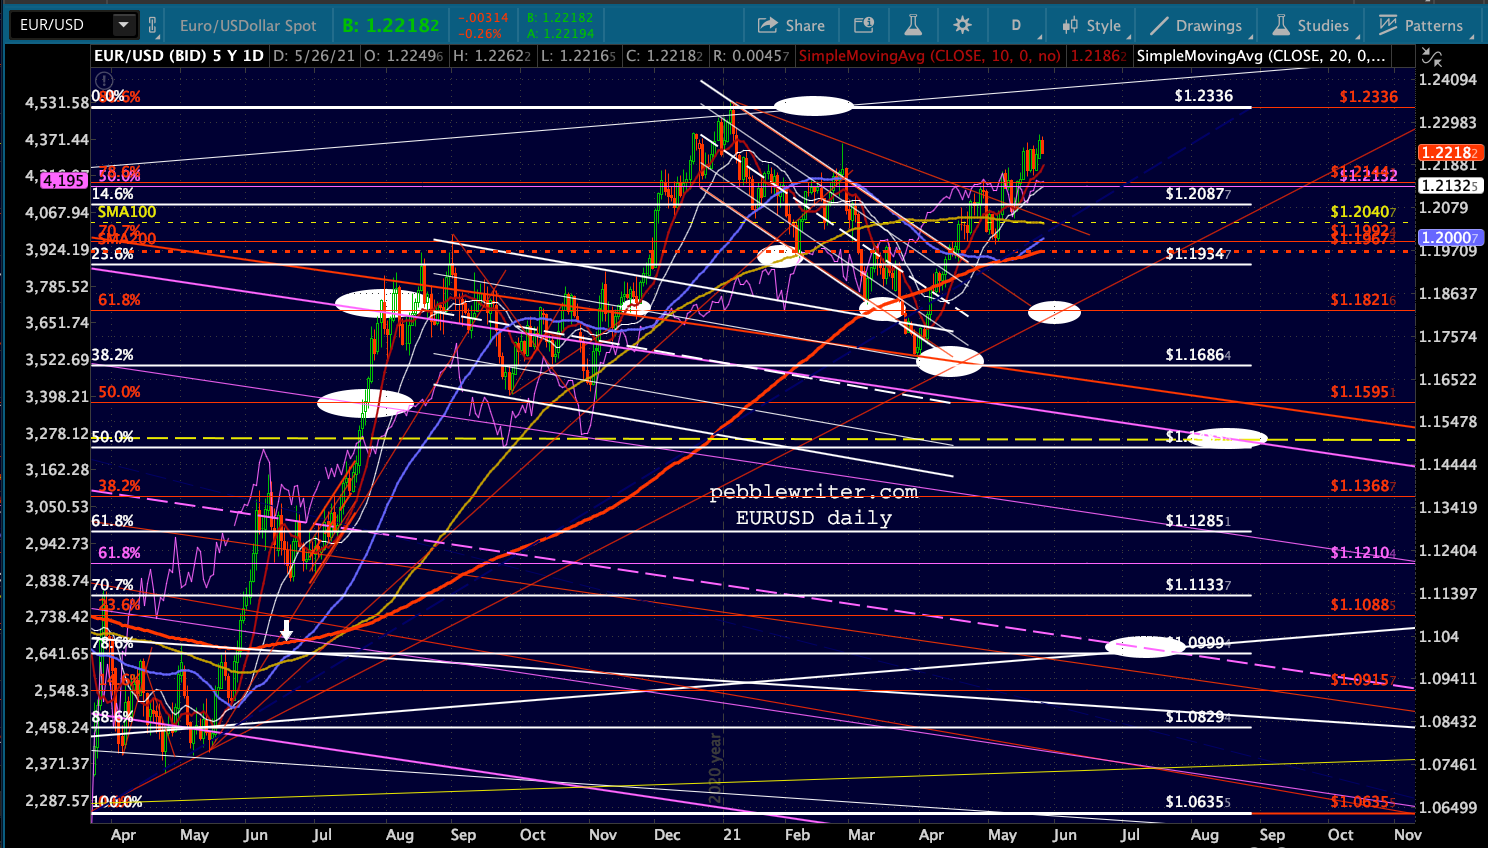
 Our currencies are all still in a holding pattern…


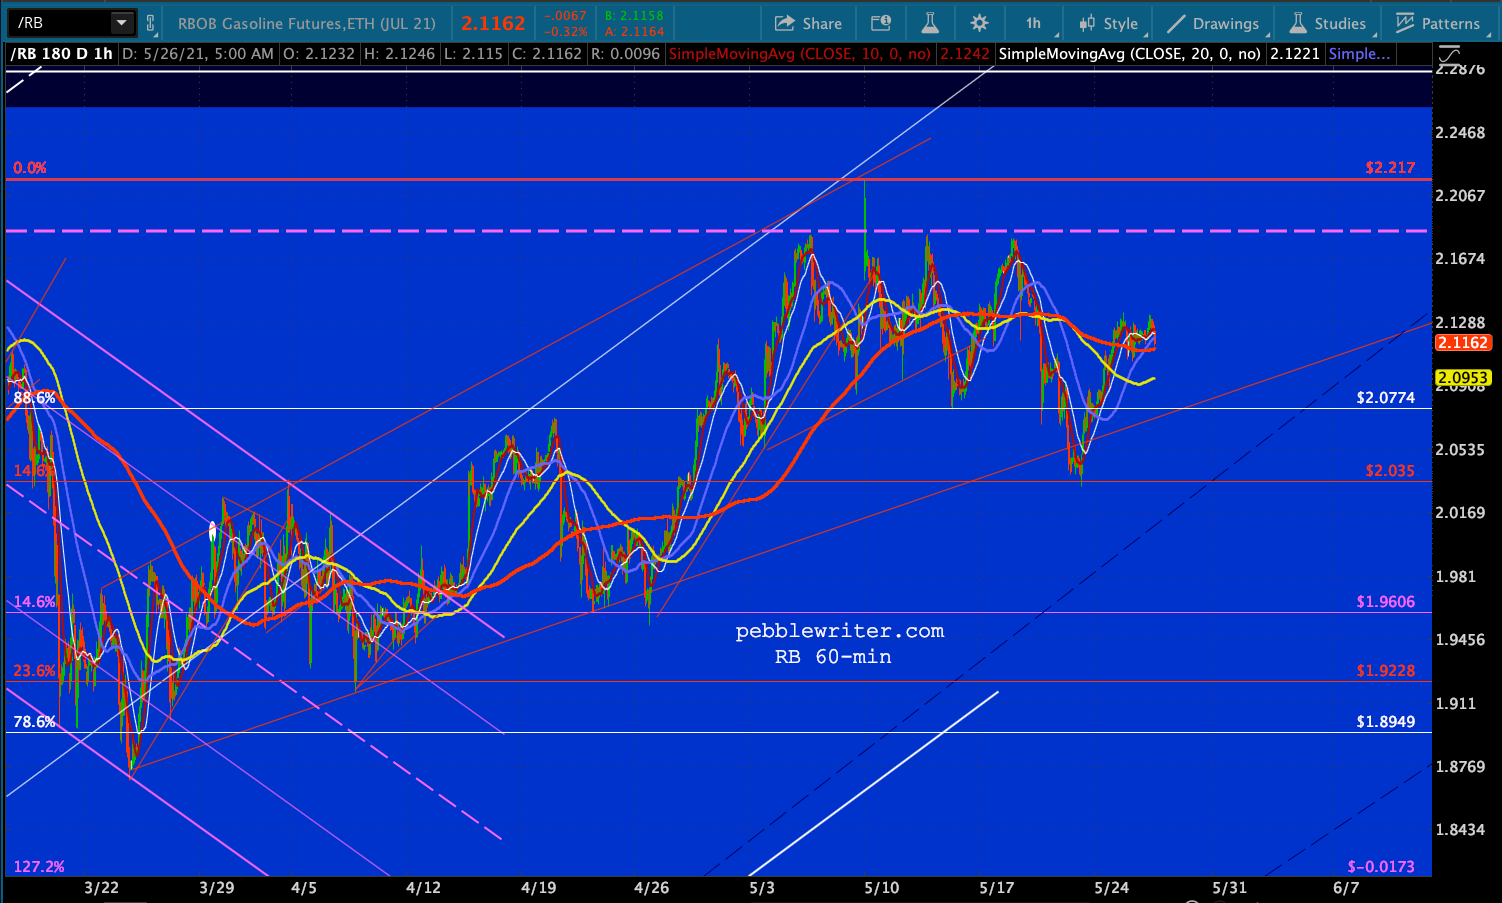
 …as are CL and RB.

 And, bond yields continue to drift lower.

 Getting back to the targets question, let’s look at DJI, SPX and ES. We’ll start with DJI. In addition to reaching its 3.618 Fib extension, it’s back to the top of the rising white channel.
  Major potential Fib targets, then, include the yellow 2.618 at 26702 (a 23.0% decline from the 35,091 highs), the red 1.272 at 32657 (-6.9%), and the Feb 2020 high at 29568 (-15.7%%.) The SMA100 (yellow), which has played an important role from time to time, is just about to the red 1.272, and we already have a target there. And, the red SMA200 (currently at 30,580) is almost to the white channel .786 line at about 30,800 (.12.2%.)
A 10% drop would mean 31,580 – about 3.3% above the SMA200’s current level. Although it’s gradually flattening out, it isn’t likely to reach 31,580 till mid July even if DJI doesn’t sell off from current levels.
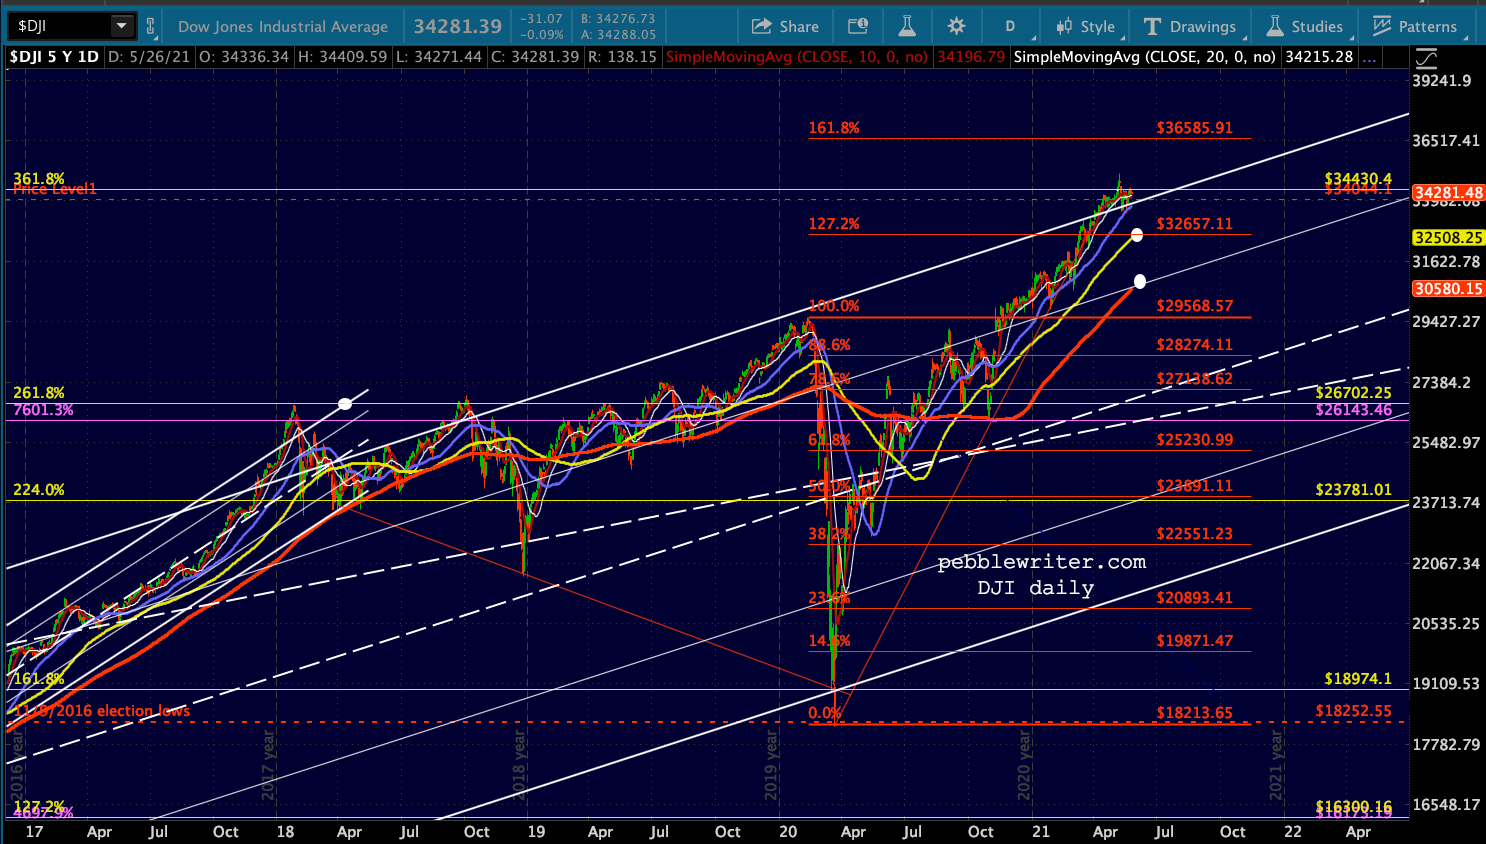 We don’t have to look very hard to see potential analogs for a DJI backtest.
  On 1/26/18, it tested the yellow 2.618 (not quite touching it) and fell 12.23% over the following 10 sessions (2/9/18.) It bounced at the SMA100, but didn’t reach the SMA200 (which would have been about a 14% drop in February) until 4/2/18. By then, the SMA200 had risen another 2.6%, reaching essentially the same levels as the 2/9 lows.
The total drop from 1/26/18, then, was 12.29%. In other words, bears had to wait almost 2 months and hold on during a 10.4% bounce just to earn an additional 0.06% return! They also would have needed to remain short when the Dow experienced a bullshit bullish 10/20 cross the same day the bounce ended on 2/27.
 In all, DJI backtested the yellow 2.24 Fib three times (a total of 16 sessions) and the SMA200 three times (a total of 12 sessions.)
Then it repeated the whole exercise between Oct-Dec 2018 – this time not managing to hold the SMA200 or the 2.24. It fell a total of 19.4% between 10/3 and 12/26, finally bottoming out when the PPT unleashed hell on VIX.
 It tested the 2.618 again on 4/23/19, falling 7.5% over six weeks, and spent about 4 months between June and October crisscrossing the 2.618 while bouncing off the SMA200 multiple times. By December, the SMA200 finally rose above the 2.618 and DJI was presumably in the clear.
But, of course, it didn’t hold. It peaked on 2/12/20 and plunged through the 2.618, the 2.24 and the 1.618, finally bottoming 38.4% later on 3/23/20 only when it reached the 2016 election lows – slightly below the yellow 1.618 Fib first reached shortly after the election. The 1.618 had never before been backtested – not even for a day – in the previous 3 years and 4 months. I don’t need to remind anyone how much attention DJT paid to the DJIA.
 Summarizing the different pullbacks for DJI in 2018-2020, then:
1/26/18: -12.3%
10/3/18: -19.4%
4/23/19: -7.5%
2/12/20: -38.4%
And, the potential pullbacks from recent highs discussed above:
Red 1.272: -6.9%
SMA200: -12.2%
2/20 highs: -15.7%
2.618: -23%
Let’s do the same exercise for ES. It rose above its 3.618 extension at 3998 by 6% before topping out at 4238.25 on 5/9. Major pullback targets would be:
Yellow 3.618: -5.7%
White 1.272: -11.9%
SMA200: -11.9%
Feb 20 highs: -19.8%
Yellow 2.618: -27.4%
SPX rose 7.1% above its 3.618 extension at 3957, topping out at 4238.04 on 5/7. Major pullback targets include:
Yellow 3.618: – 6.6%
SMA200: -11.8%
White 1.272: -12.0%
Feb 20 Highs: -19.9%
Yellow 2.618: -28.1%
The best analog I can find to DJI’s previous reactions were around the 2.24 Fib extension in 2018. SPX topped out on 1/26/18, 6.2% (5.4% for ES) above the 2.24 extension, and subsequently fell back to test the SMA200 ten sessions later at 2703 – an 11.8% (ES: 12.8%) decline in 10 sessions. Note that SPX’s need to bounce at its SMA200 on 2/9/18 prevented DJI from reaching its SMA200.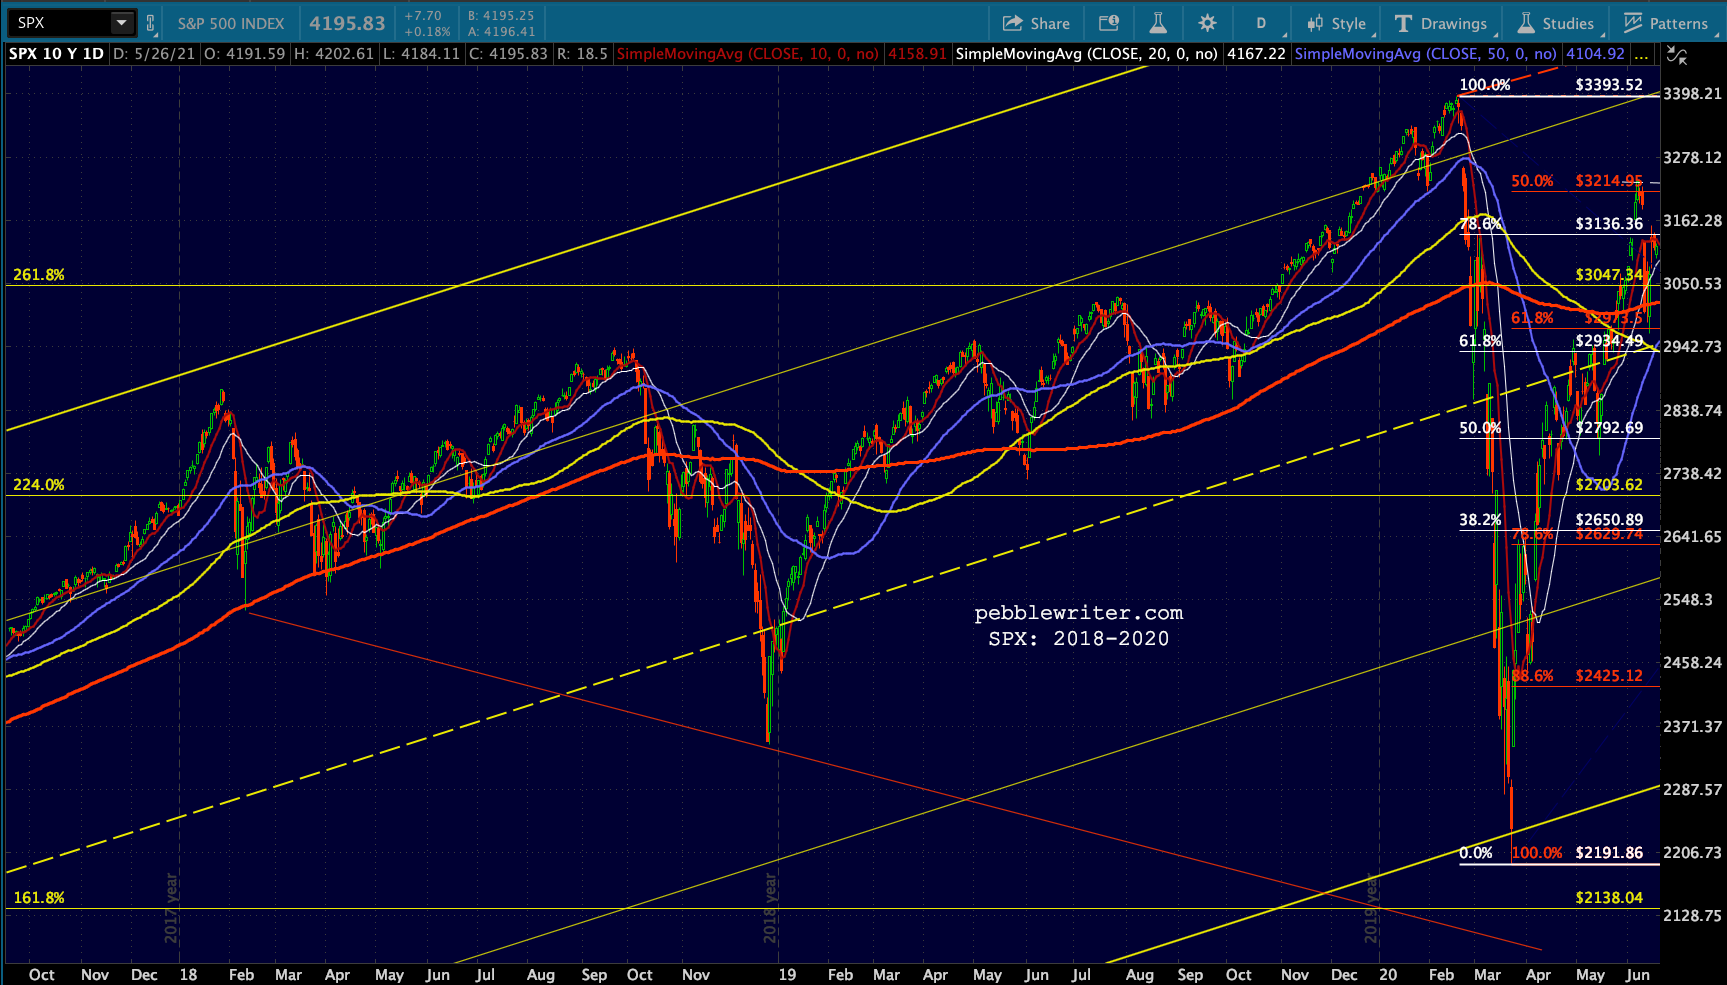 SPX made a slightly higher high at 2941 on 9/21/18, tumbling 20.2% (ES: 21.4%) to 2347 by 12/26/18. And it made another slightly higher high on 5/19/19 at 2954.13 which yielded a 7.6% (ES: 7.8%) decline which slightly overshot the SMA200 and undershot (ES: tagged) the 2.24.
The 2/19/20 high of 3394 (10.2% above the 2.618, 10.4% for ES) was followed by a 35.4% (ES: 36%) plunge to 2192 by 3/23/20. No coincidence that the SMA200 had reached the 2.618 at 3047 on the very day SPX plunged to reach them both. Needless to say, TPTB would have loved to arrest the decline at that double support.
Ultimately, SPX came within 2.8% of its 1.618 at 2138 while ES came within 0.8% of its. As mentioned above, the reason they couldn’t complete the backtest is because the DJIA had already dropped below its 1.618 and was in danger of dropping below its post 2016 election lows.
Nearly every one of the above pullbacks had something in common. In general, they pushed through resistance and backtested it rather than backtesting after running up against resistance in the first place. It’s a safer maneuver compared to, say, reversing at a major Fib and backtesting the next lower Fib as occurred in 2014-2016.
The first successful push above the 1.272 was in April, which overshot it by 4% before completing a 4.3% backtest five sessions later. It repeated the exercise on 9/19/14 when, from 9.8% above the 1.272, it backtested it over the next three weeks. It finally reached the 1.618 on May 21 (within 4 points) and tumbled 12.5% over 3 months, bounced 13.3% for 10 weeks, then cratered another 14.3% over the next 10 weeks.
 Now, let’s play pretend. Suppose we’re the Fed and are trying to limit the fallout from the inflation spike. There are several dates over the next month that I’m worried about in terms of freaking the markets out:
May 27: GDP deflator
May 28: PCE Prices
Jun 2: Beige Book
Jun 10: May CPI
Jun 15: May PPI
Jun 16: FOMC Meeting
Each of these has the potential to call BS on inflation being “transitory.” Given that the month of May is almost over and oil/gas prices are still riding high, another 4%+ CPI print wouldn’t surprise me.
April CPI came out on 5/12, but ES peaked two days ahead of it on 5/10 and began its 4.9%, 4-session decline. I imagine this one will be worse. Where would we want to take a stand?
Target #1: 3.618
The first real support for the major indices would be SPX’s 6.6% (from its highs) decline to its 3.618 at 3956.64, which aligns with declines of 5.7% for ES and 6.9% for DJI. All 3 will have also backtested their SMA100s. This could be comparable to the 1/26/18 setup where ES and SPX started 5.4% and 6.2% above their 2.24 Fibs and DJI which started right at its 2.618 Fib (versus its 3.618 now.) If it happens in the next day or two, both ES and DJI would also tag their purple channel bottoms.
Target #2: SMA200
Remember, SPX and ES didn’t hold the 2.24. They dropped all the way to their SMA200s, completing 11.8 and 12.8% declines. DJI dropped 12.3%. This size decline would compare very closely with the present day SMA200 support for DJI, ES and SPX which are packed tightly in the range of -11.8% to -12.2%. Timing? SPX and ES’ SMA200 are already above their white 1.272 – could be any day. Maybe as soon as Friday or a Monday plunge following Friday’s data. This would be about 3 weeks from the top, comparable to those early 2018 declines.
Target #3: Feb 2020 highs
If the SMA200s don’t hold, the next real support is the Feb 2020 highs: a 19.9% drop for SPX and ES and a 15.7% decline for DJIA (if DJI can outperform, otherwise it’s -23% to the 2.618.) If DJI plunges all the way to its 2.618, it could easily drag ES/SPX down to theirs. This would be comparable to the Oct-Dec 2018 decline (SPX -20.2%, ES -21.4%, DJI -19.4%.) Timing? End of July (FOMC meeting July 27-28?) early August, to backtest the rising yellow channel midlines for ES/SPX and all three’s 200-week MA (just like SPX and ES did in Dec 2018.) This timing would also be comparable to the Sep-Dec 2018 correction.
I have a little medical thing to take care of tomorrow so won’t be able to post in the morning. Nothing major, just a bunch of spinal injections. If I’m not too wigged out afterwards (I truly detest needles) I’ll try to post at the end of the day. And, I hope to take Friday off. Graduation time around here for my two youngest daughters.
GLTA.
continuing…
3776