Futures are up moderately on positive earnings reports from several key equities.
 continued for members…
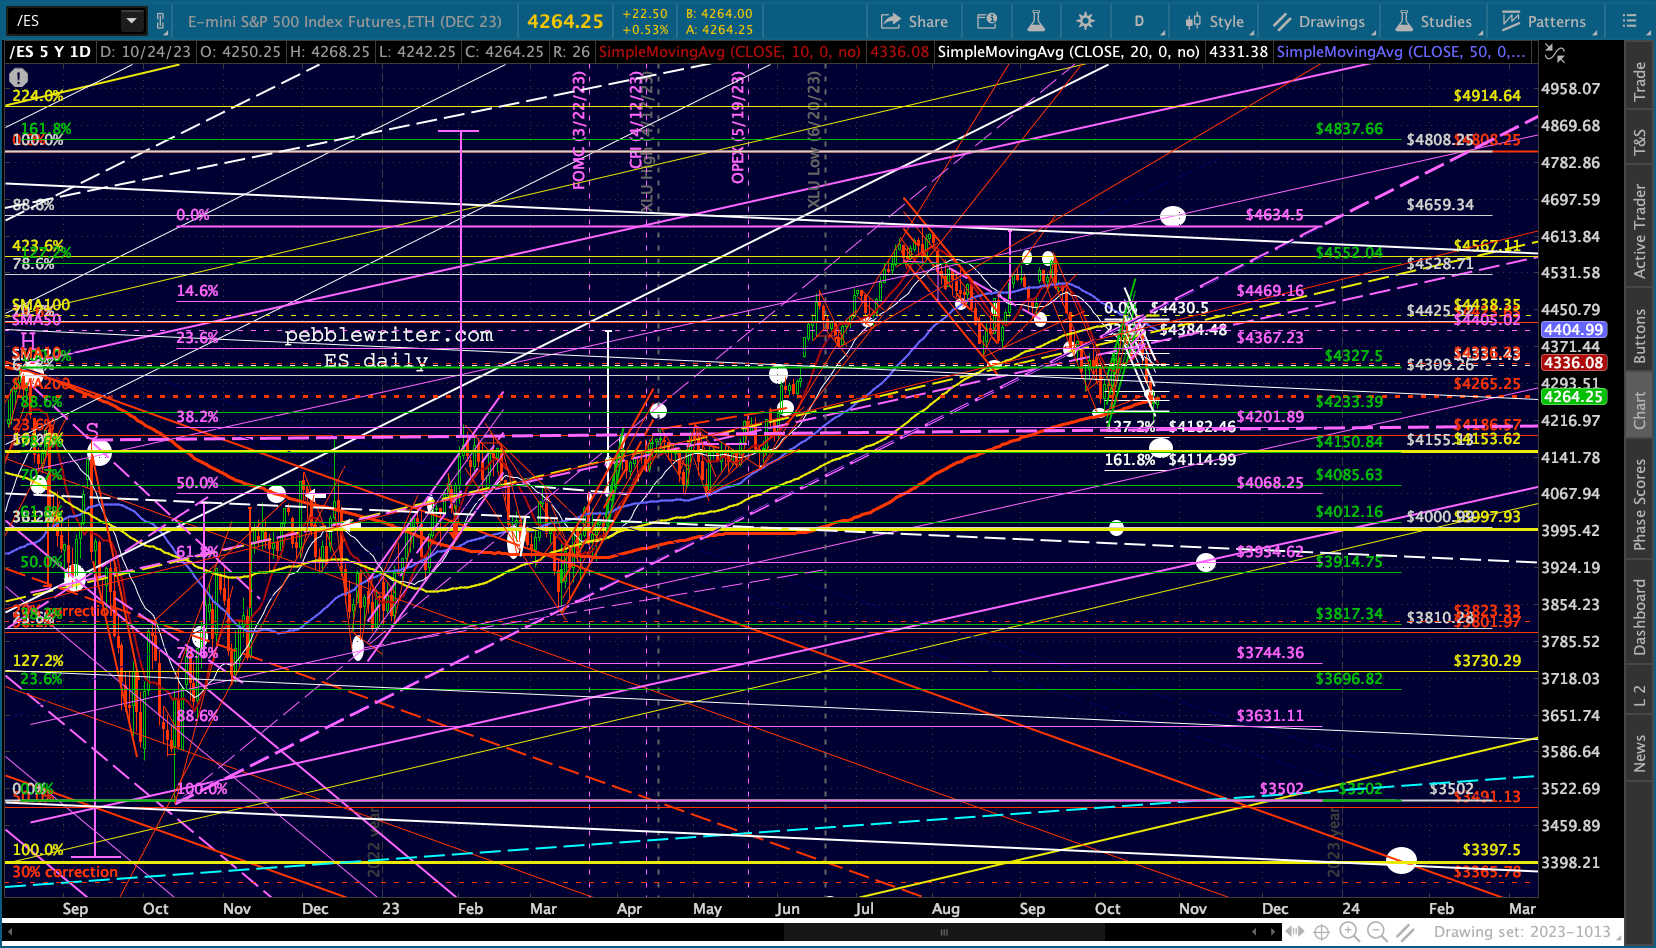
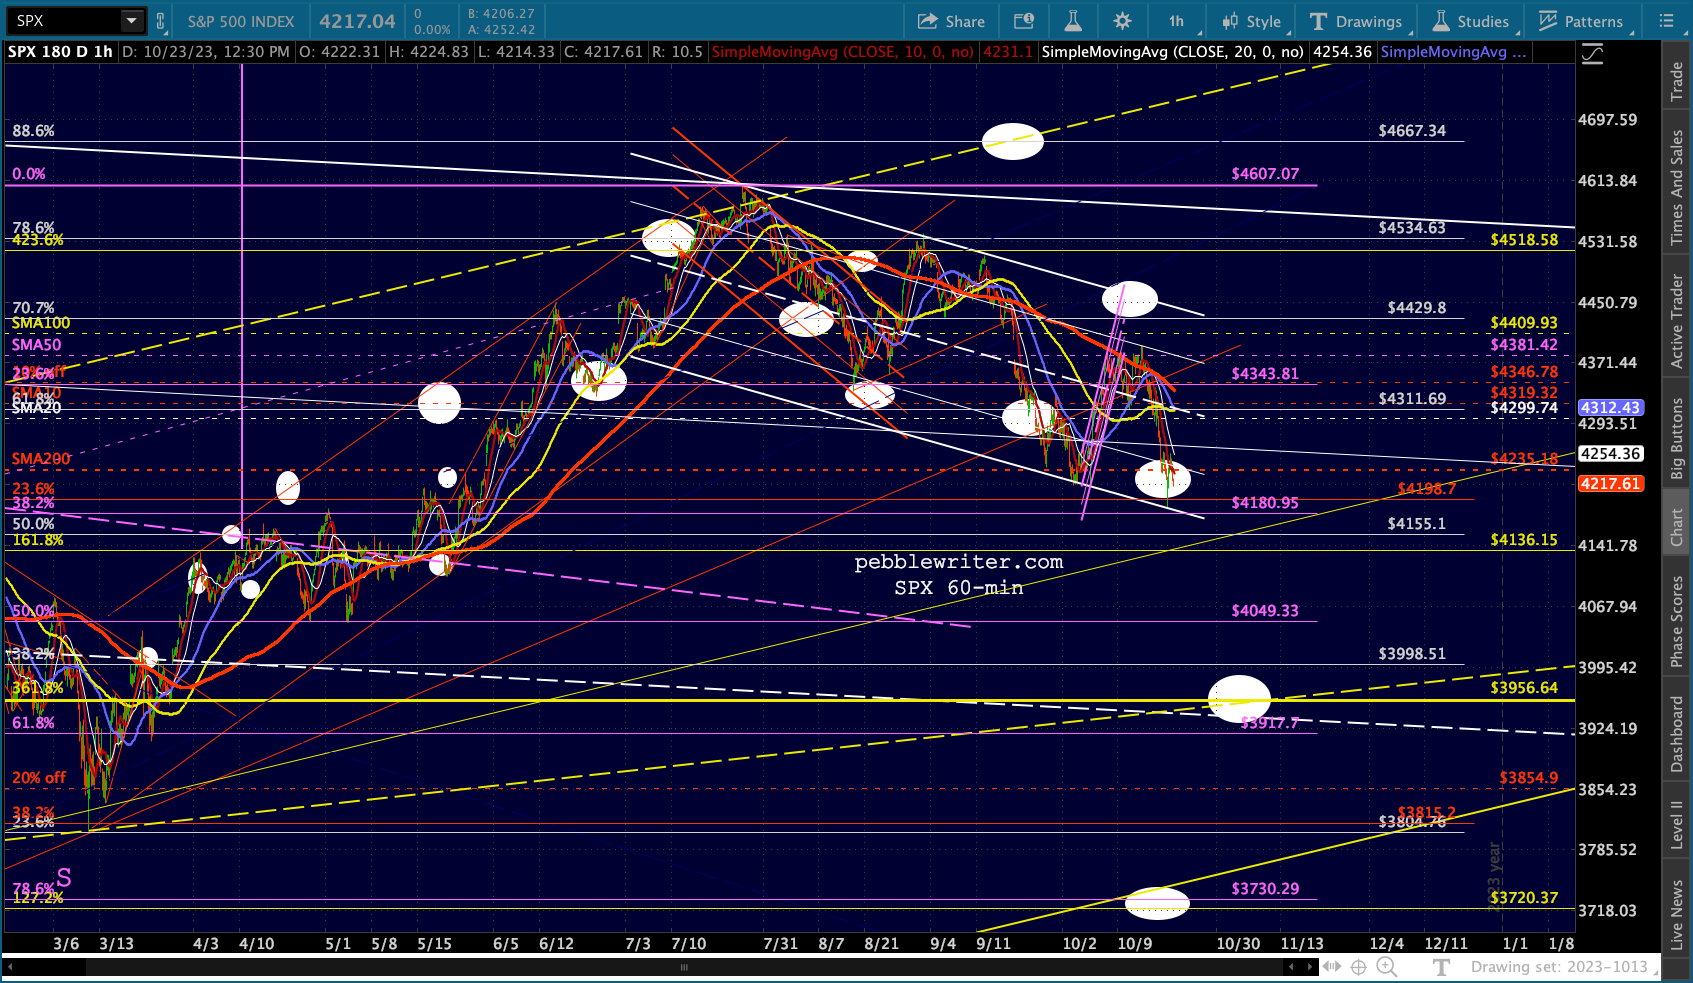
ES is back above its SMA200. At this rate, SPX will certainly test its as well.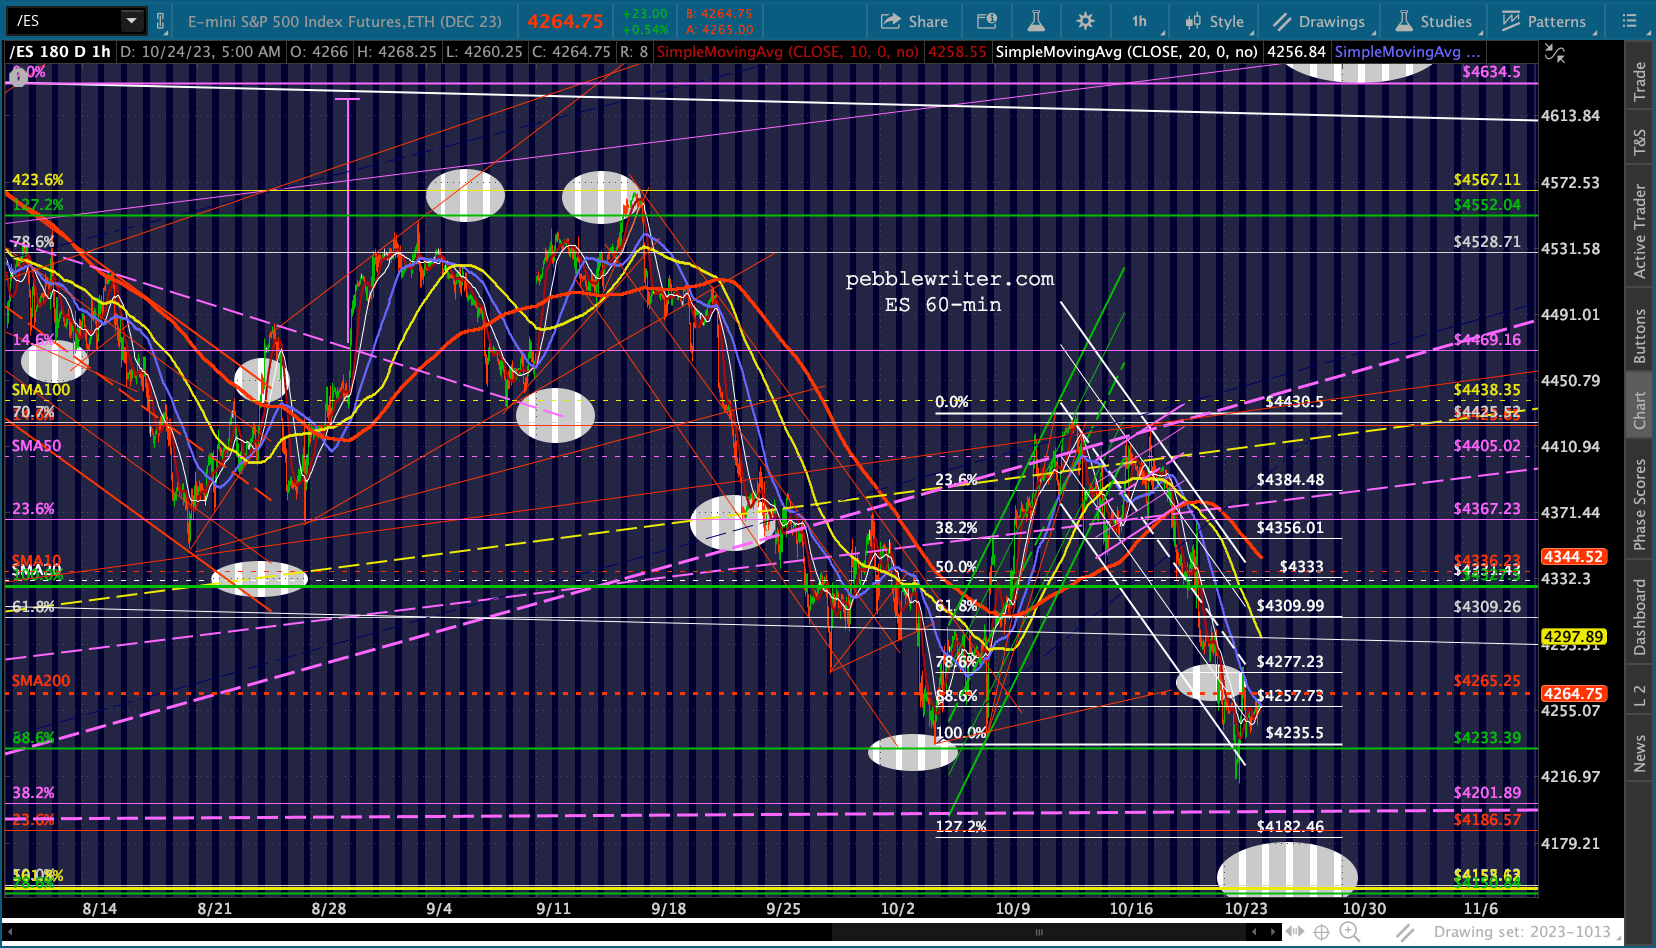
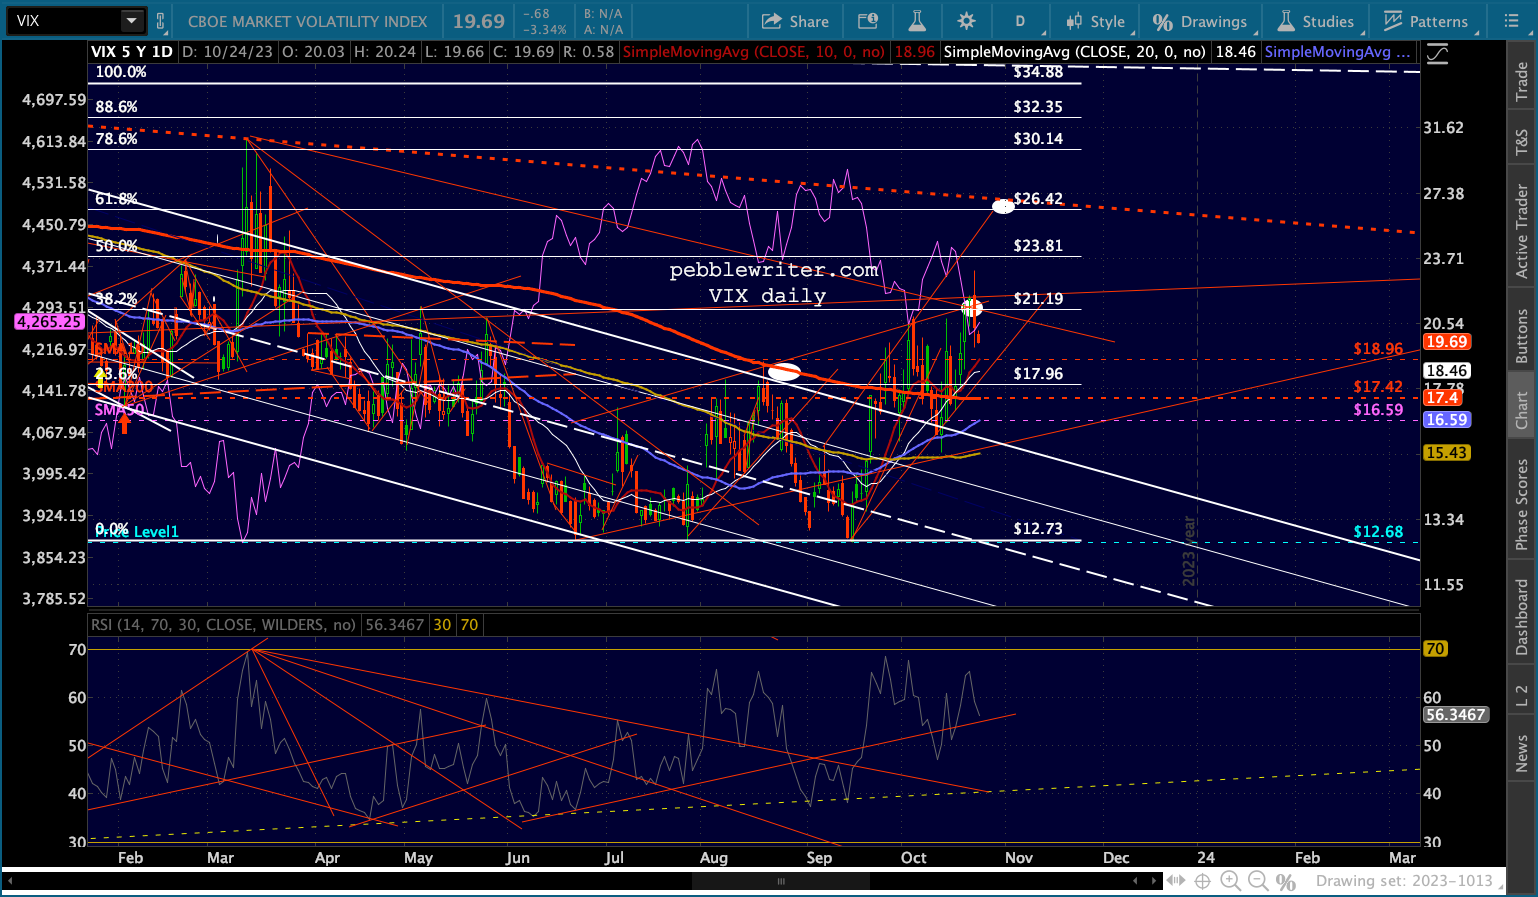
 As discussed yesterday, VIX’s reversal of its breakout would be supportive of stocks.
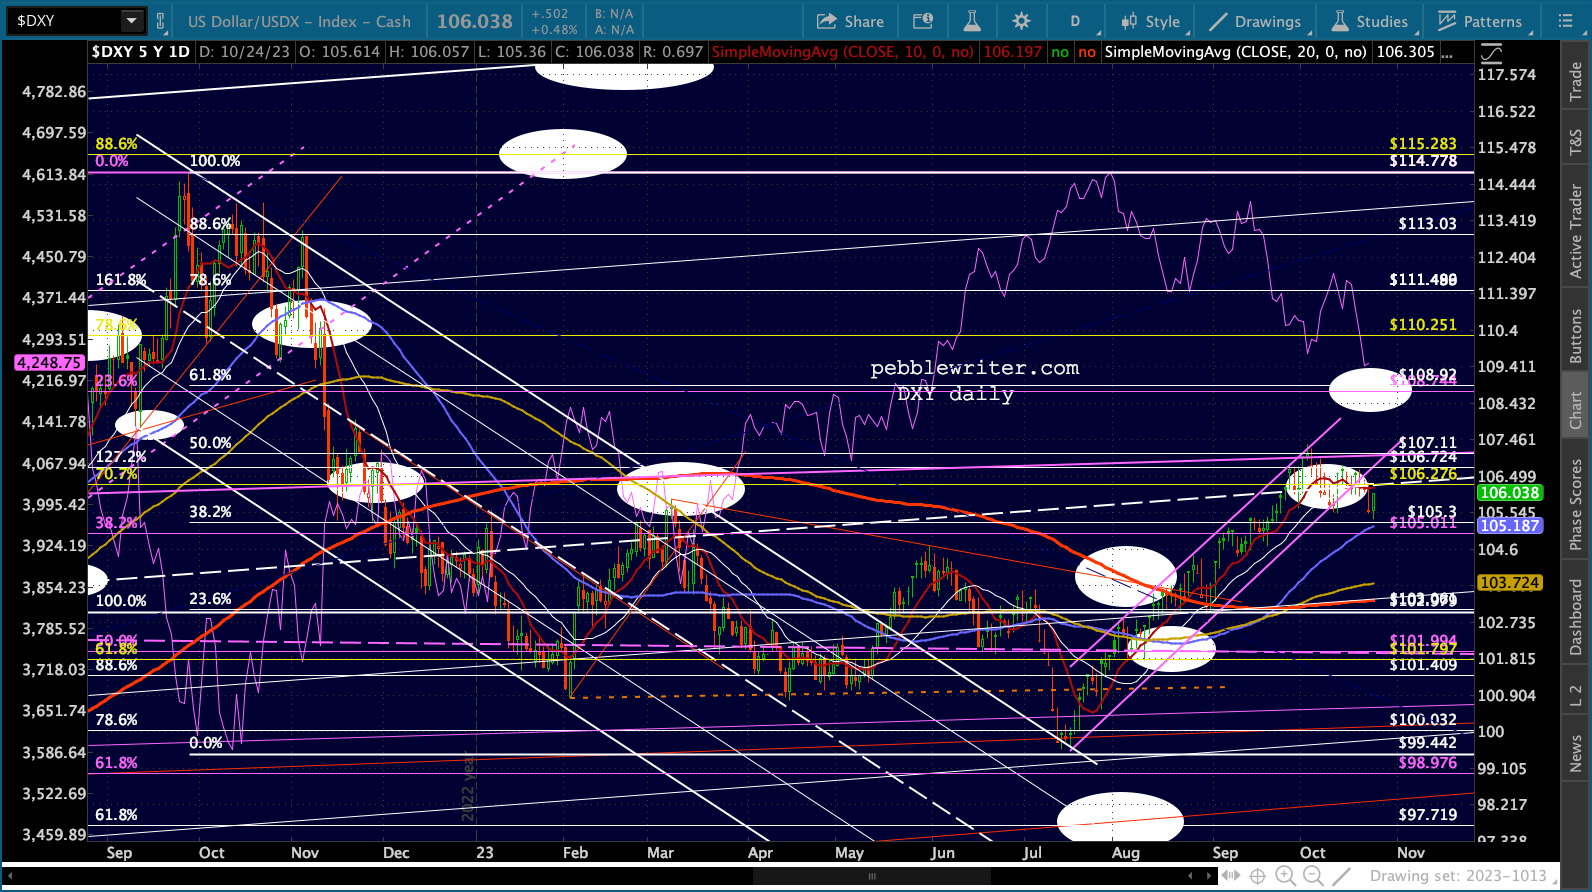
 As we discussed yesterday, EURUSD has broken out of the tight falling red channel and should backtest it today or tomorrow. If it is able to remain clear, then it would help equities bounce.
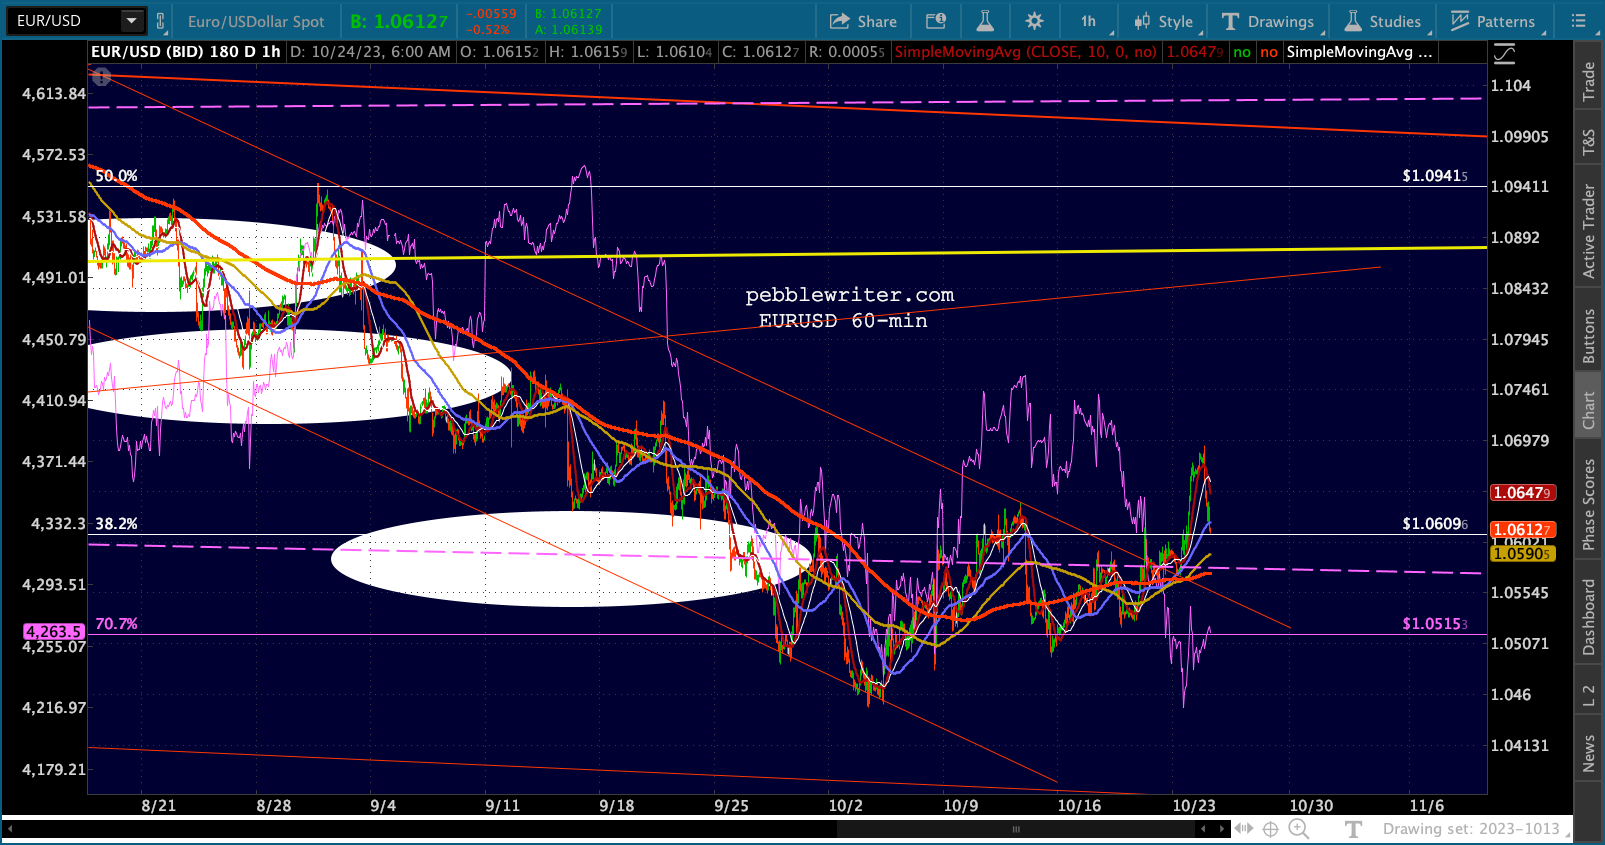 But, the daily chart still suggests lower prices – a stronger dollar – which would suggest lower equity prices.
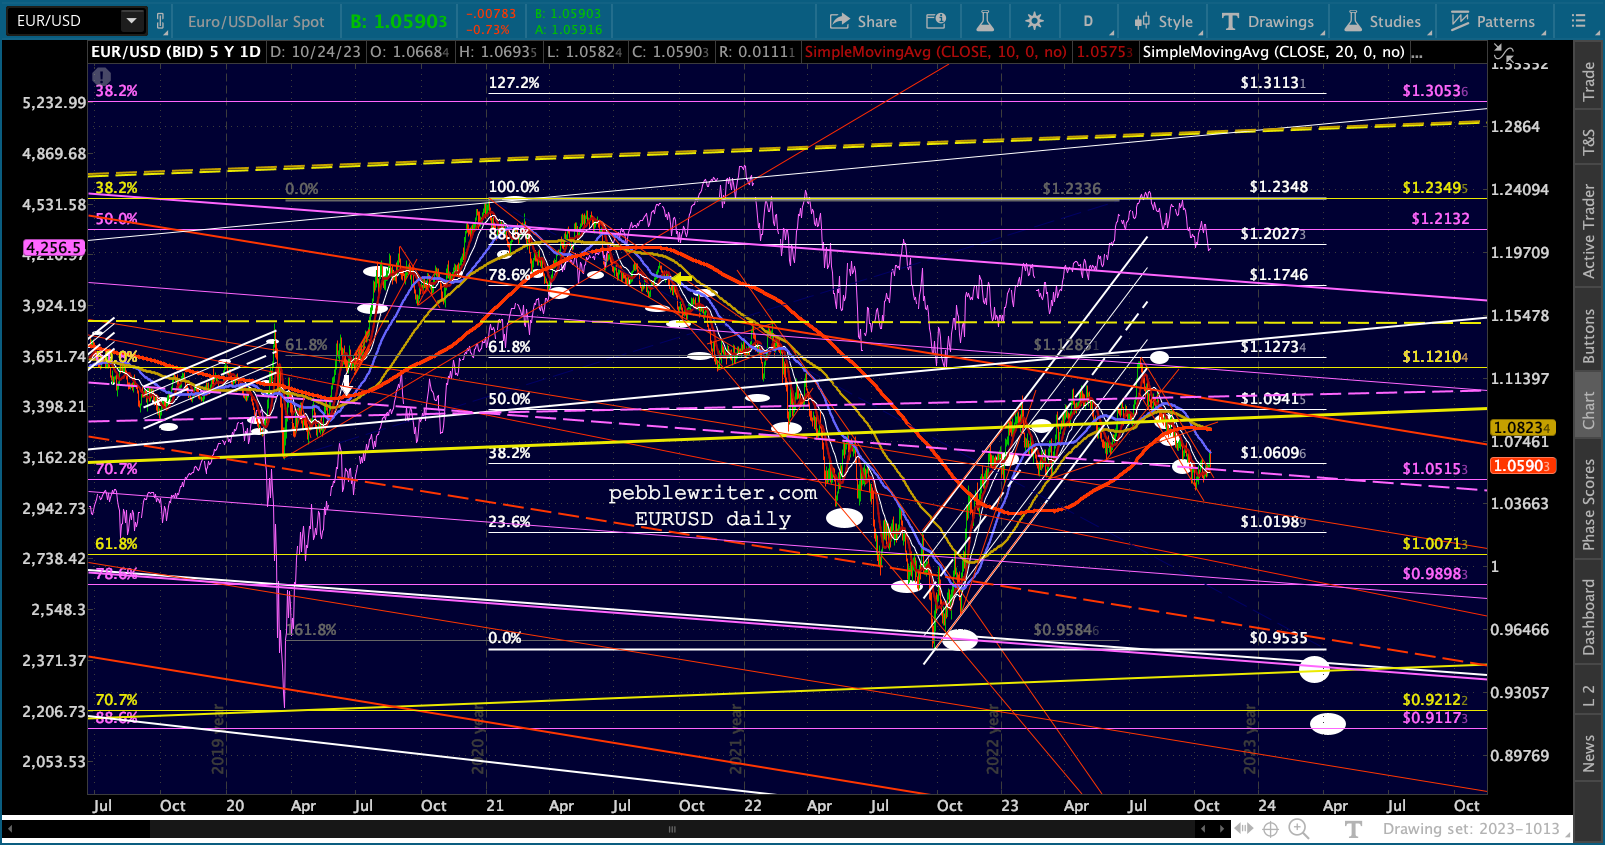 USDJPY continues its slow slog higher, still testing its 10/21/22 highs of 151.93 and likely headed to 159.14. I suspect that new highs will wait until the NKD reaches its next support level.
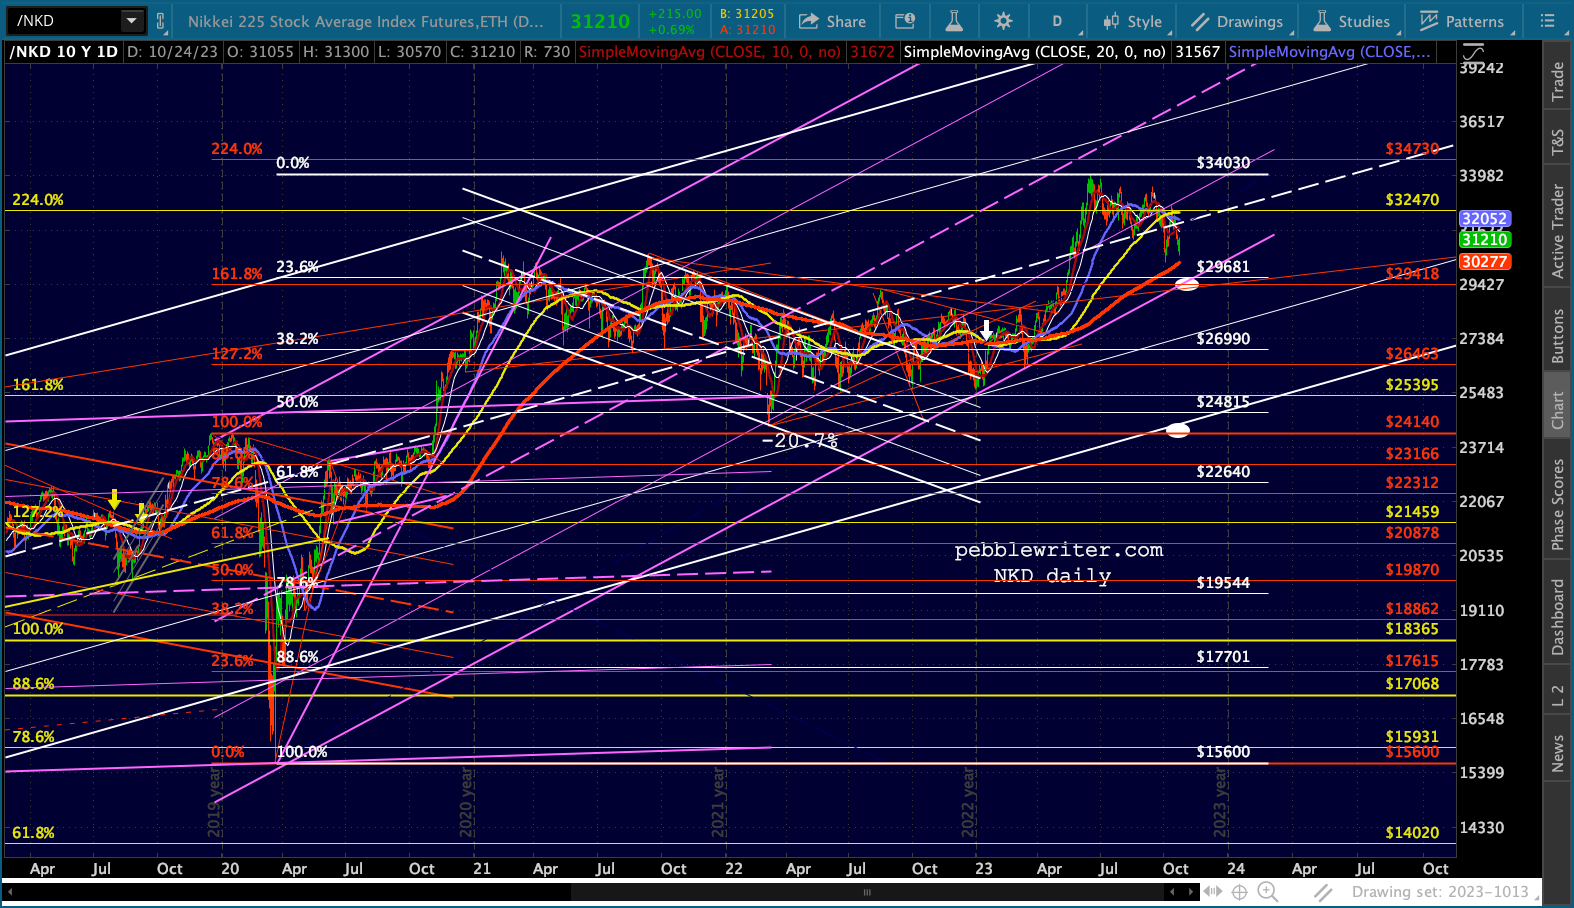
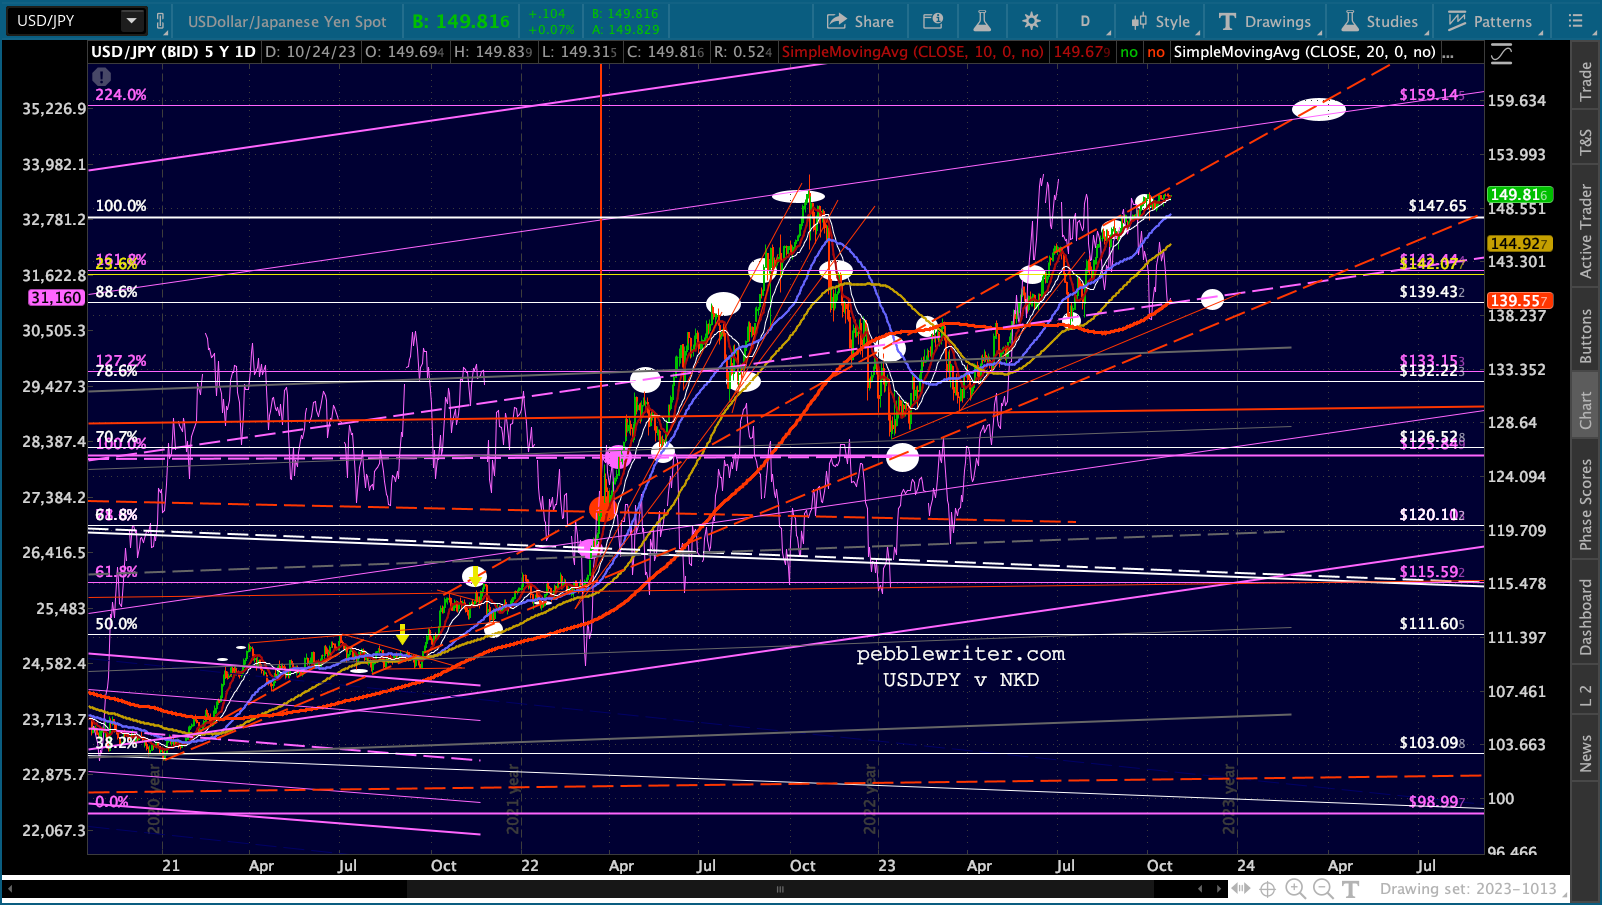 NKD has yet to backtest its SMA200 or the purple channel bottom, so we’ll look for USDJPY to break out at that time.
 EURUSD’s breakout is solely responsible for DXY’s breakdown from the tight purple rising channel. It bounced off its SMA50, but if EURUSD keeps going DXY is headed for its SMA200 down at 103.30.
 Oil and gas are both lower again today. Our forecast remains for lower energy prices in order to take pressure off interest rates. But, obviously, the situation in the Middle East remains a huge wild card.
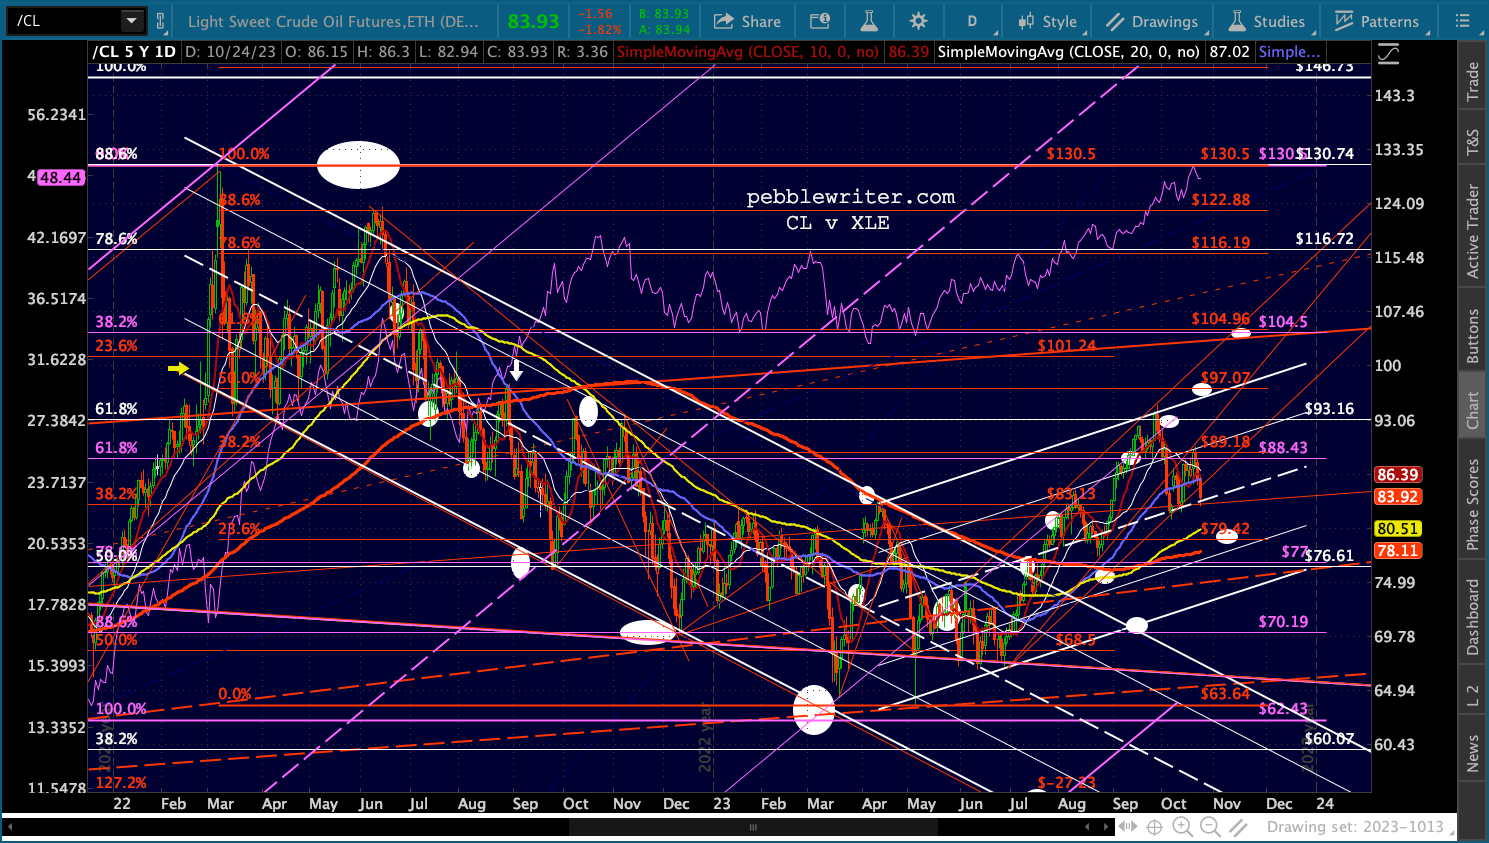
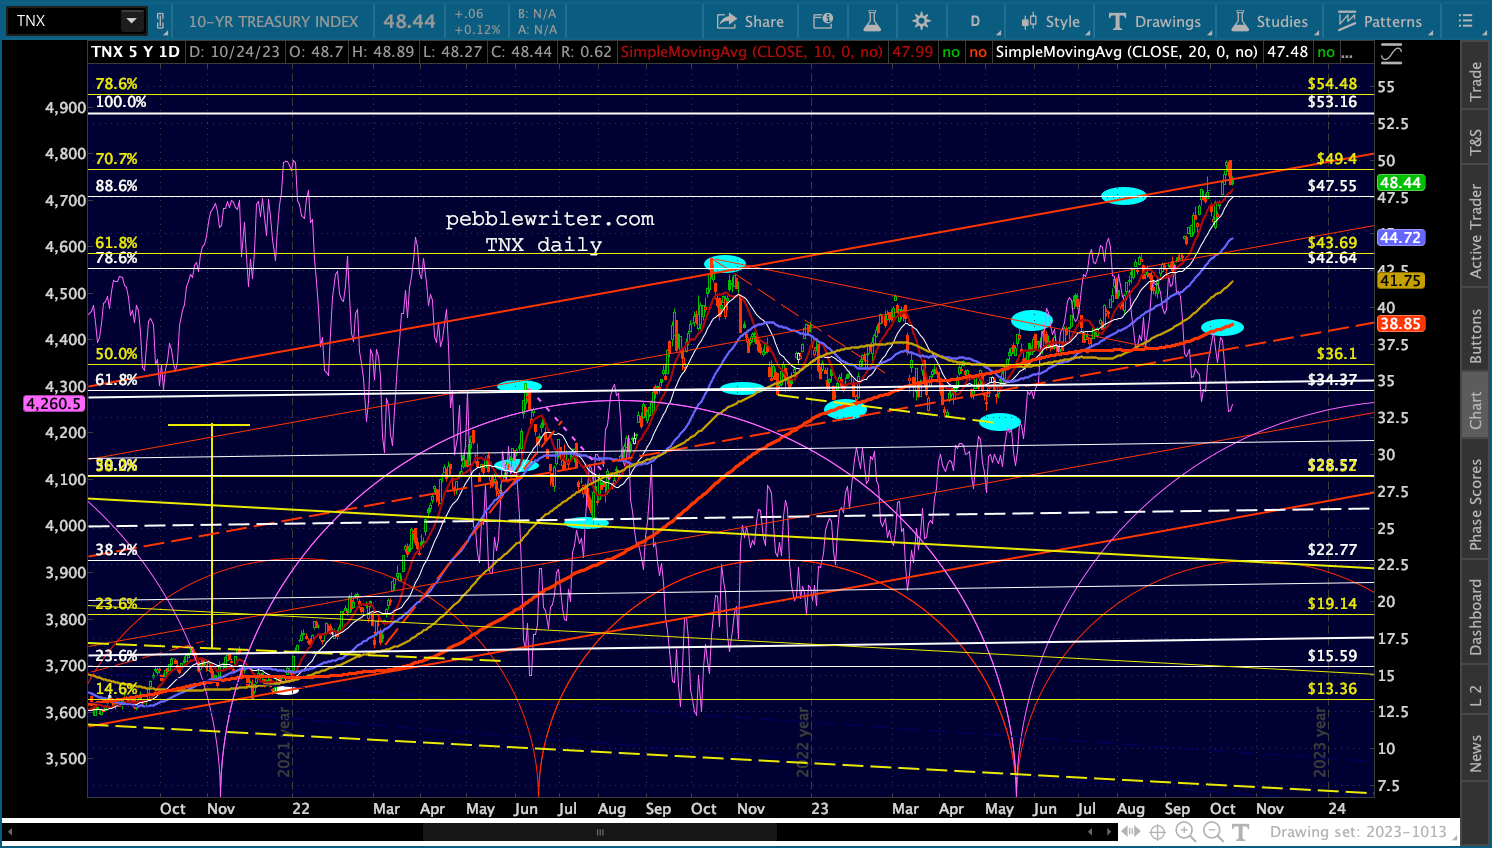
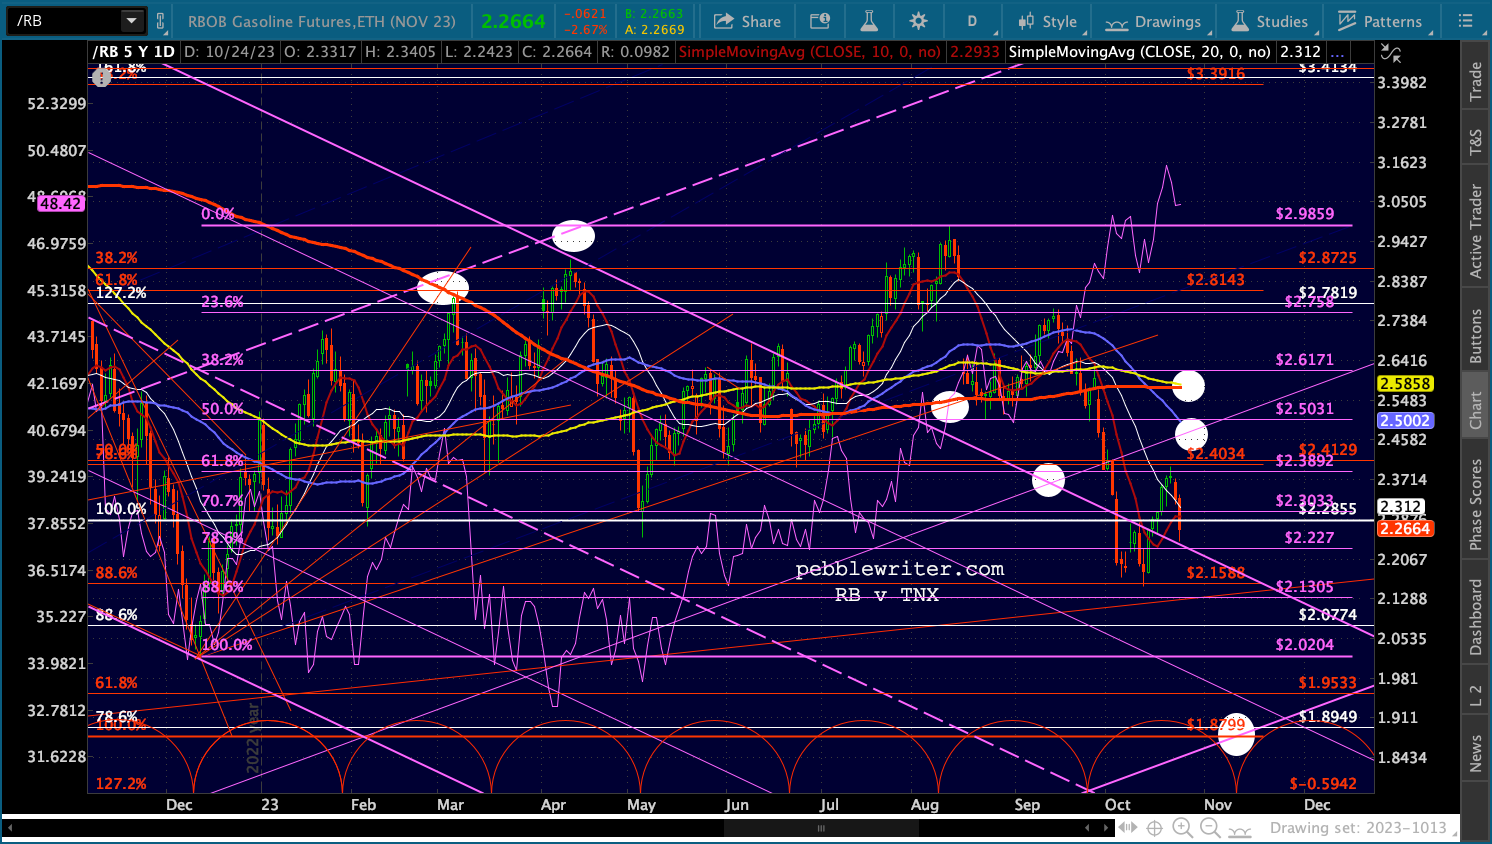 However, a significant expansion of hostilities would be expected to usher funds into bonds from equities – thus lowering interest rates. Bottom line, the most likely path for rates remains lower. The 10Y crept up past our 4.775 target to test 5% – a nice round number.
I think we go lower from here, likely testing 43.69 and/or 42.64. Lower support would mean the SMA200, currently at 38.85. But, I can’t see the Fed allowing a drop below 4% at this time.