Futures are up slightly on as investors look ahead to tomorrow’s FOMC decision.
 continued for members…
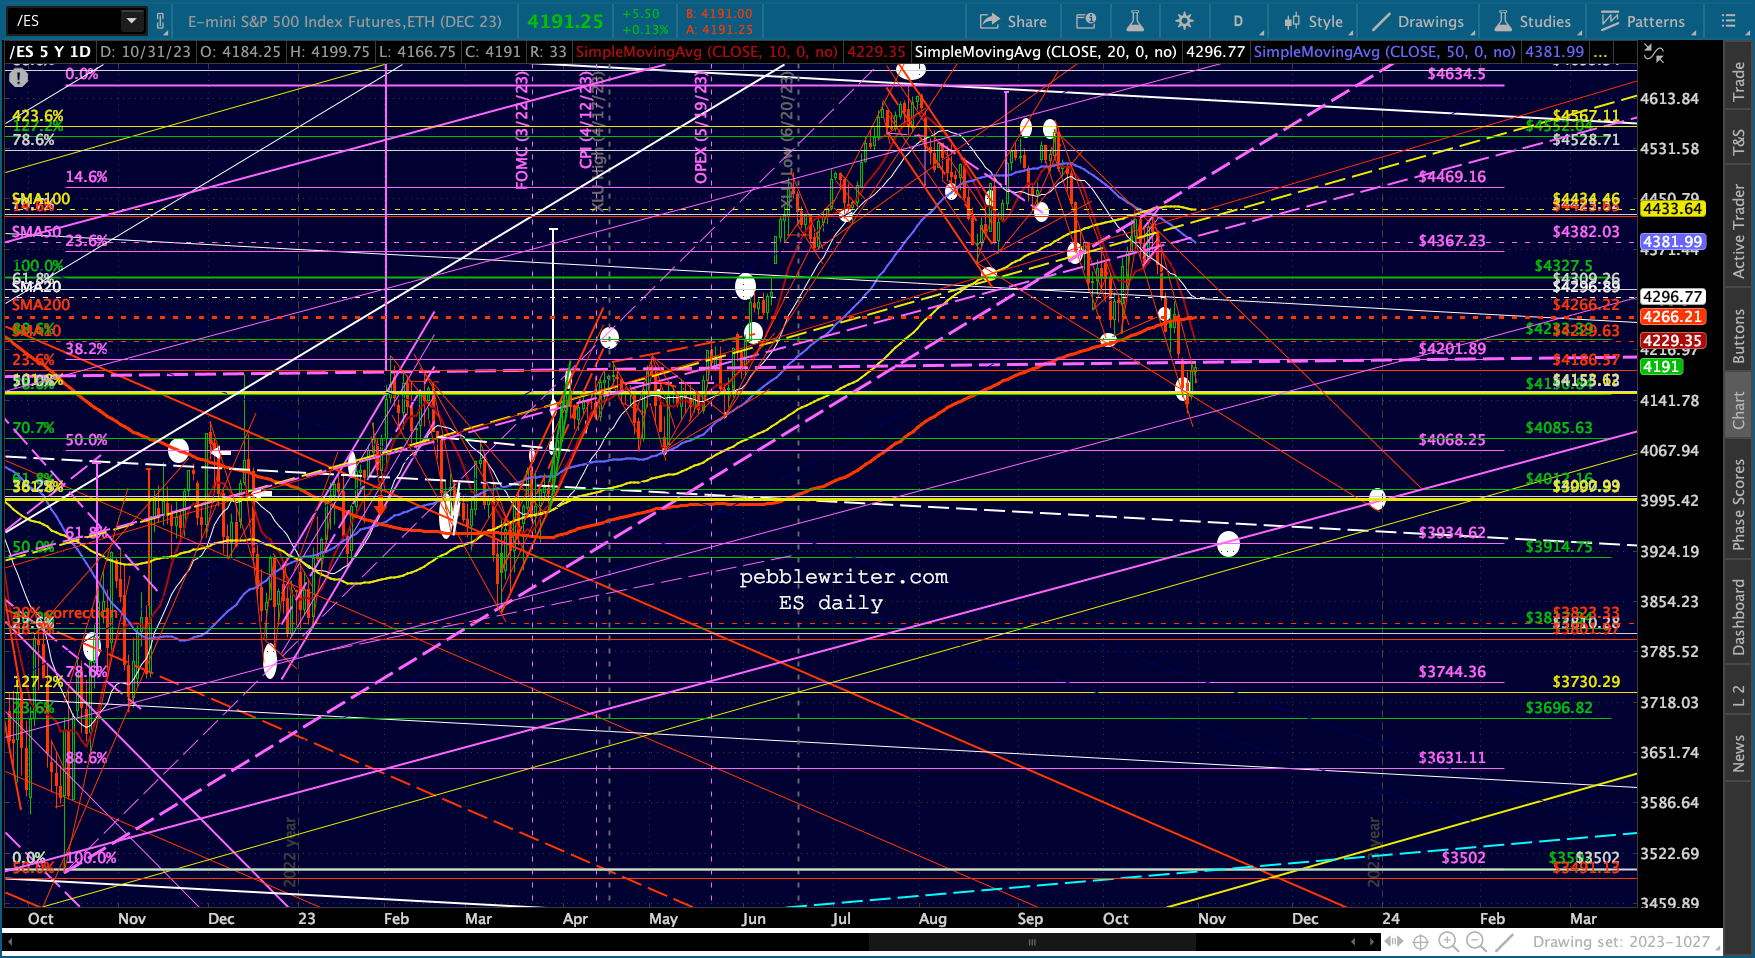
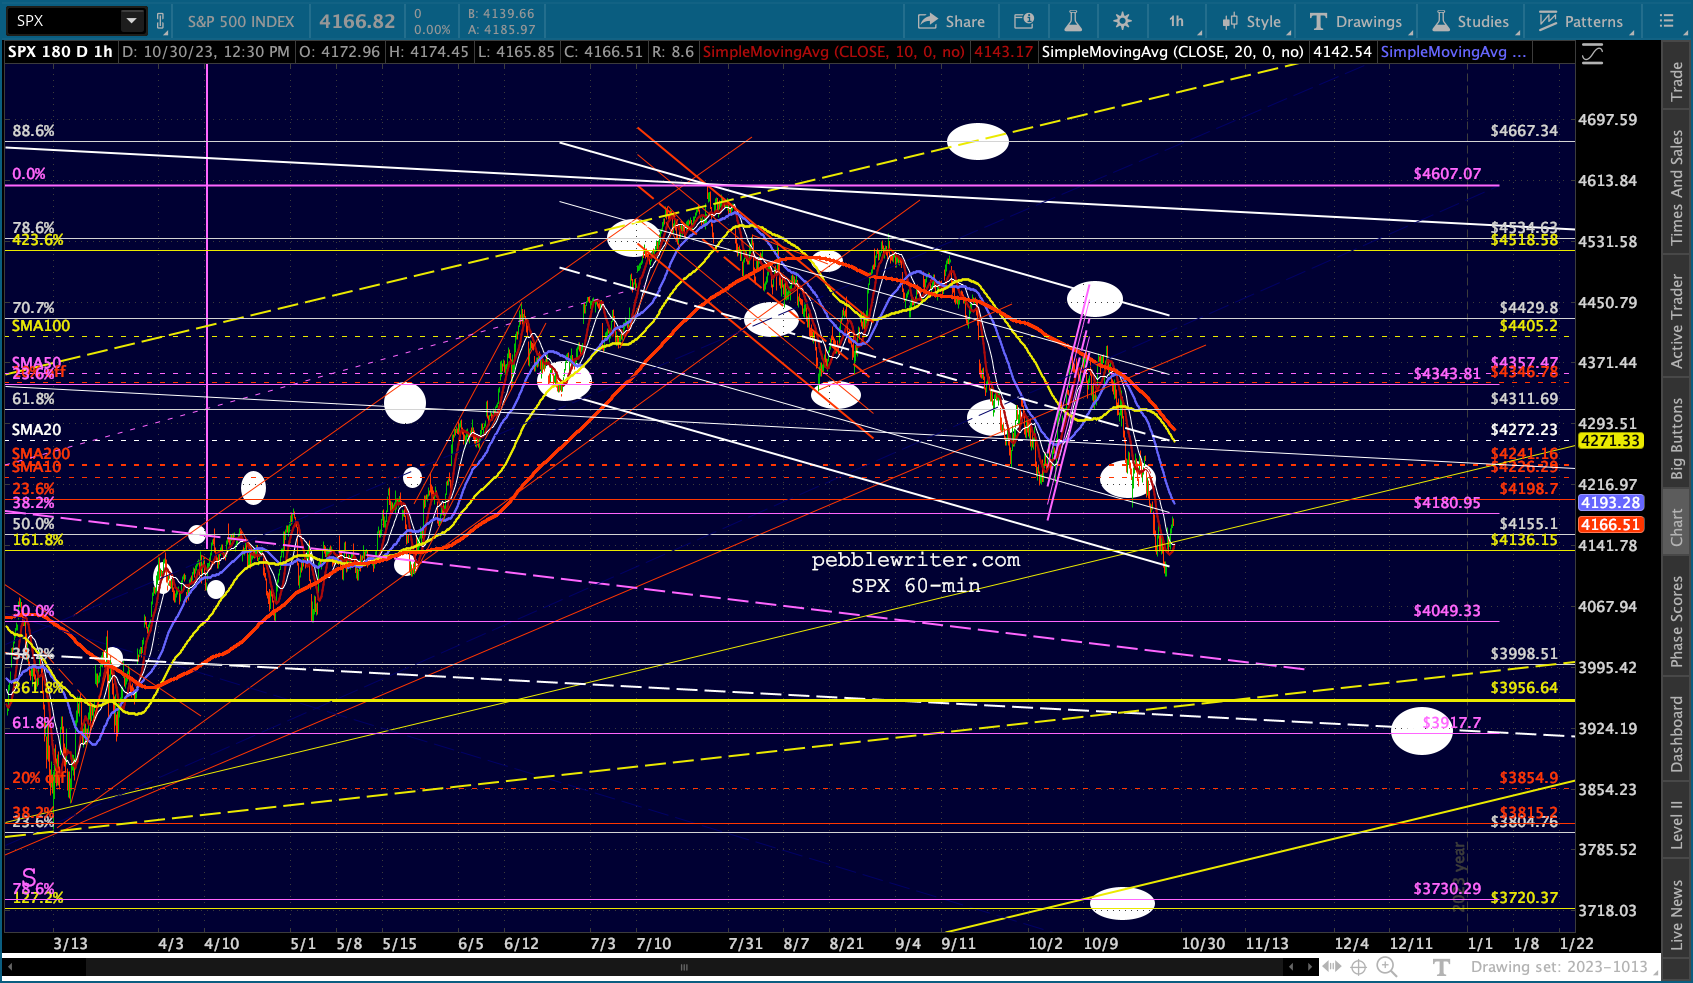
The equity picture shows a breakout above the red TL on the 15-min chart, but larger patterns still undecided but with a bearish tilt based on Fibs and moving averages. Overall, it smacks of a fairly common meltup into an FOMC meeting which will result in lower equity prices.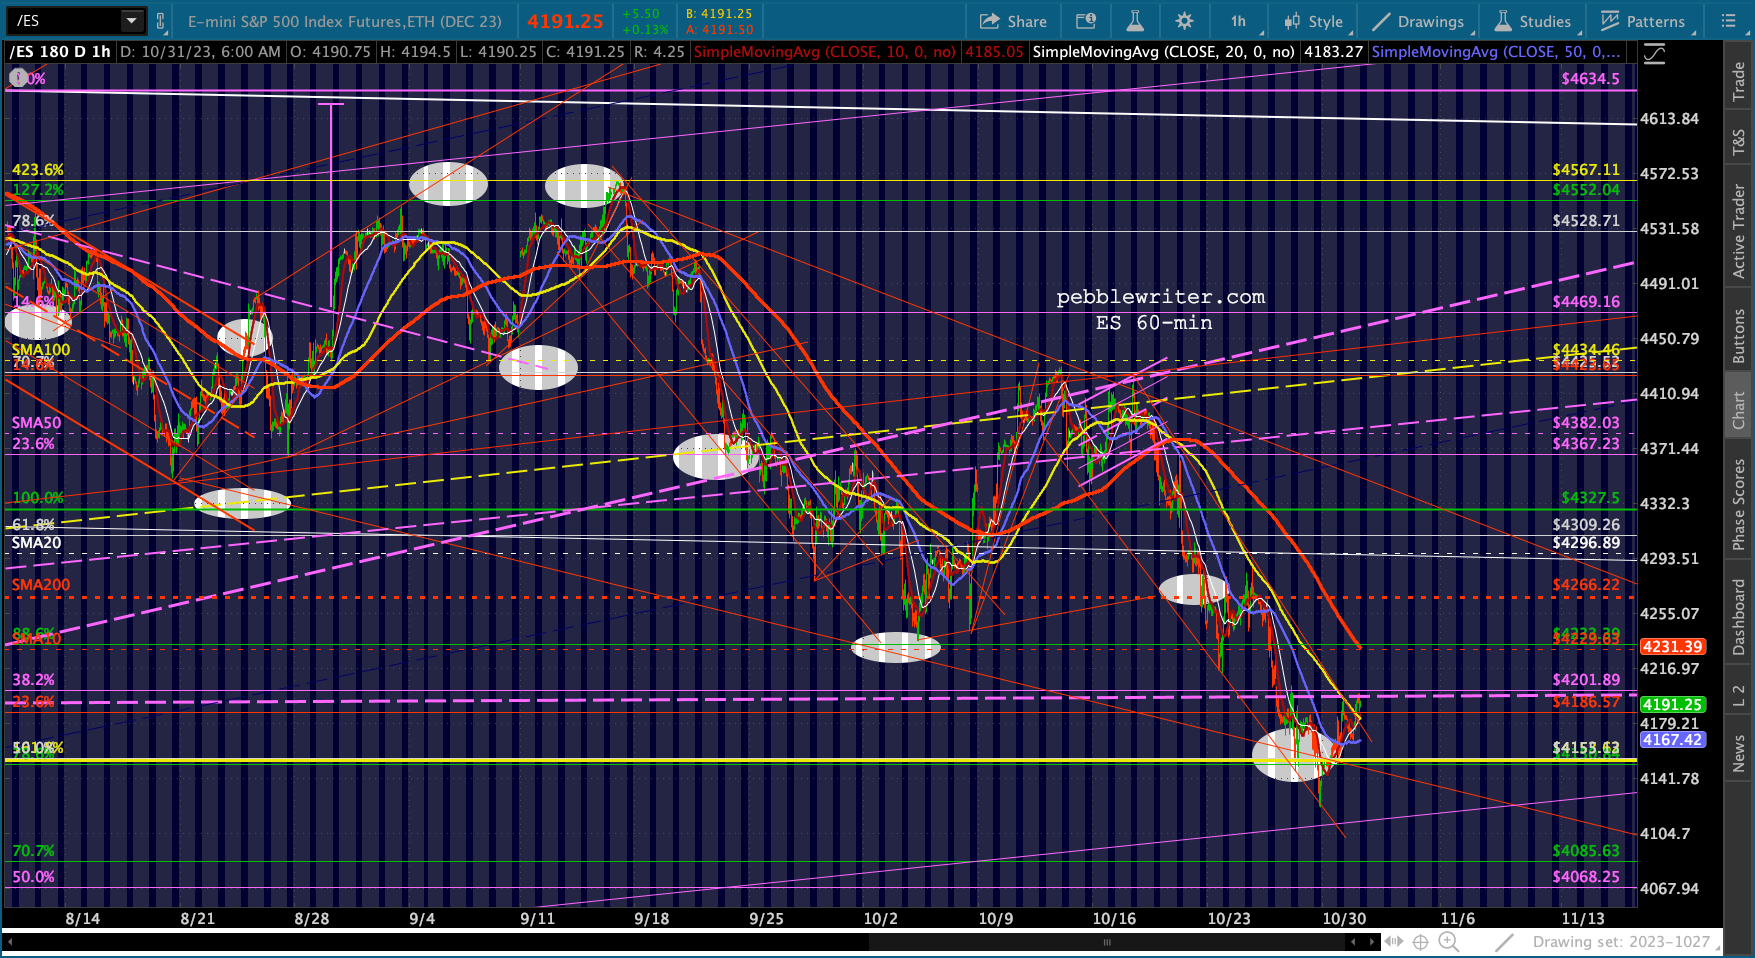
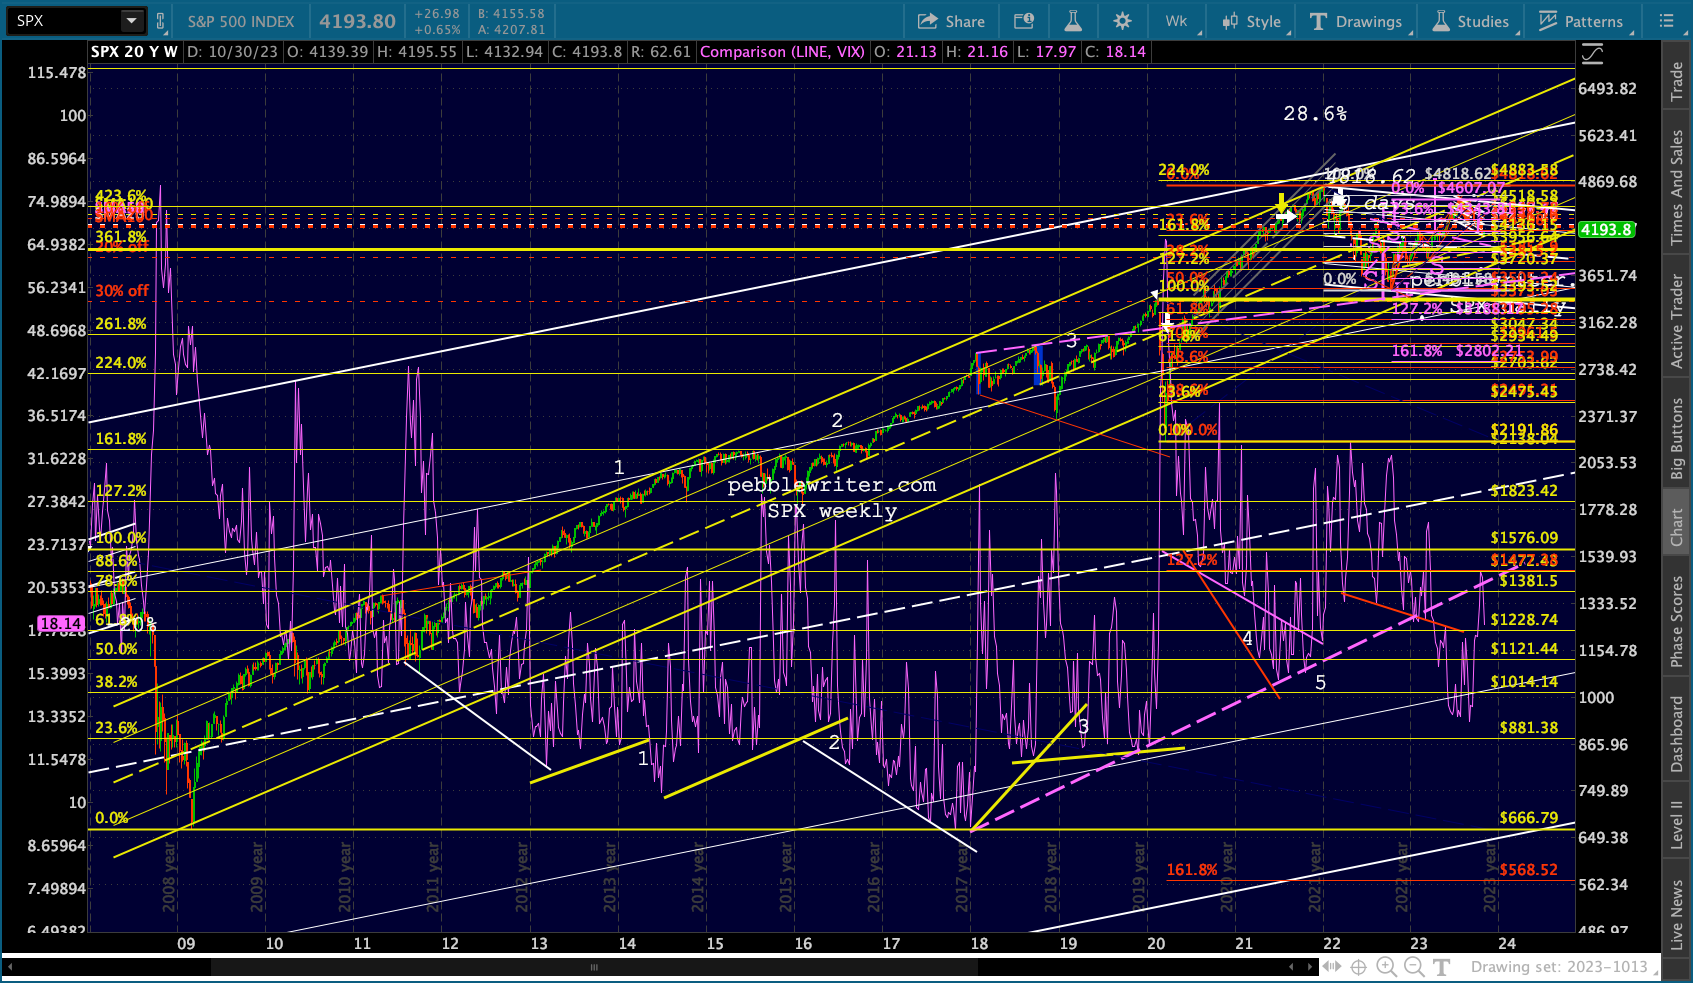
 VIX must now decide on a breakout or breakdown. Nov 4 was a significant low for equities in past years.
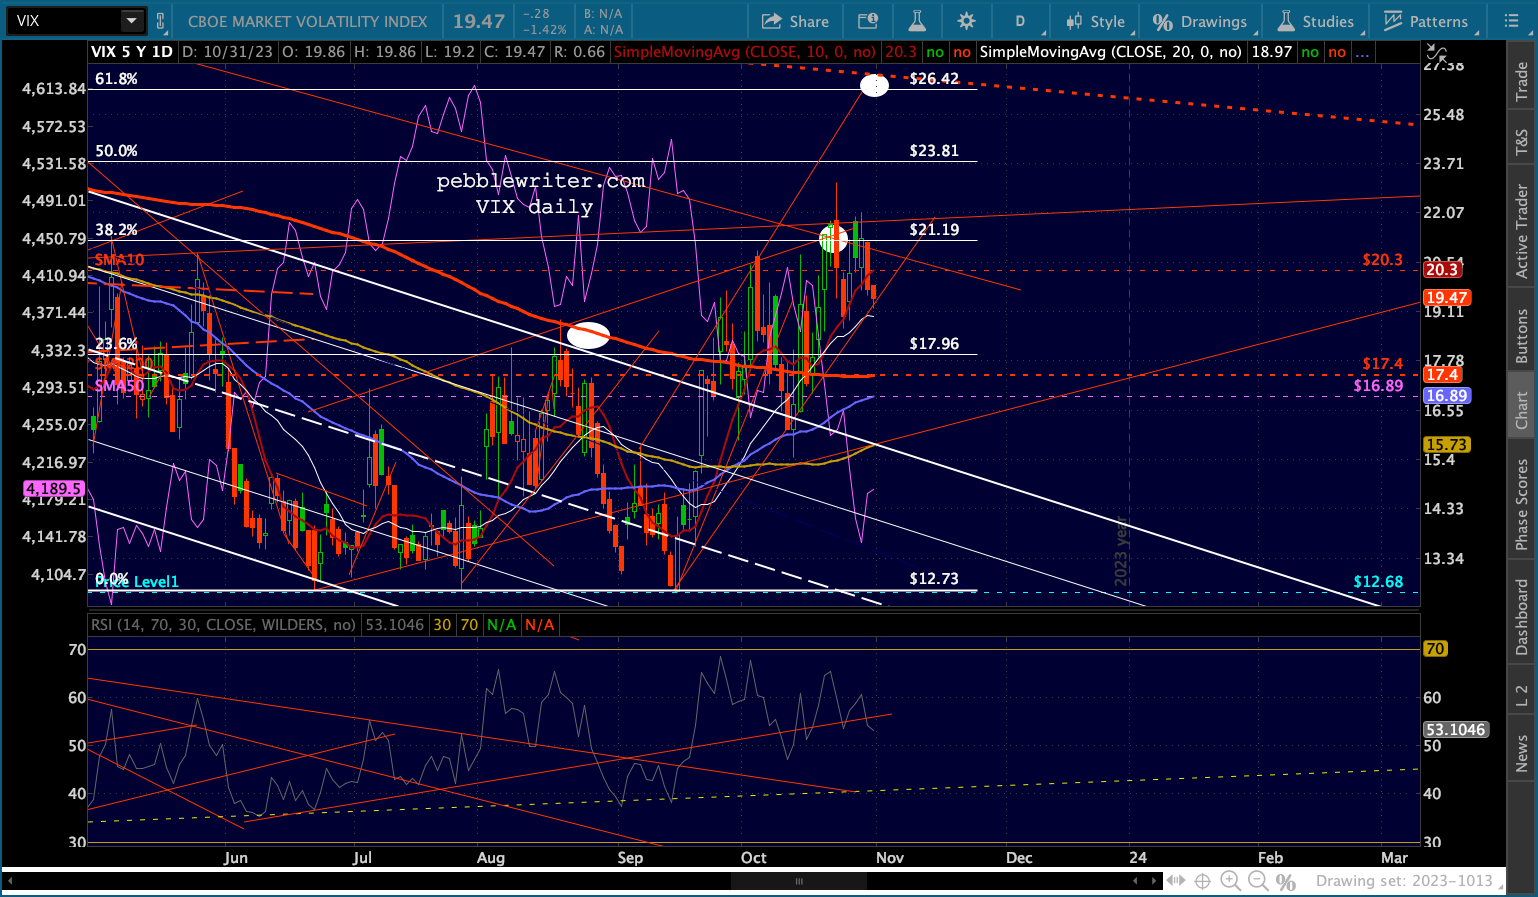


 Oil and gas are getting a slight bounce…
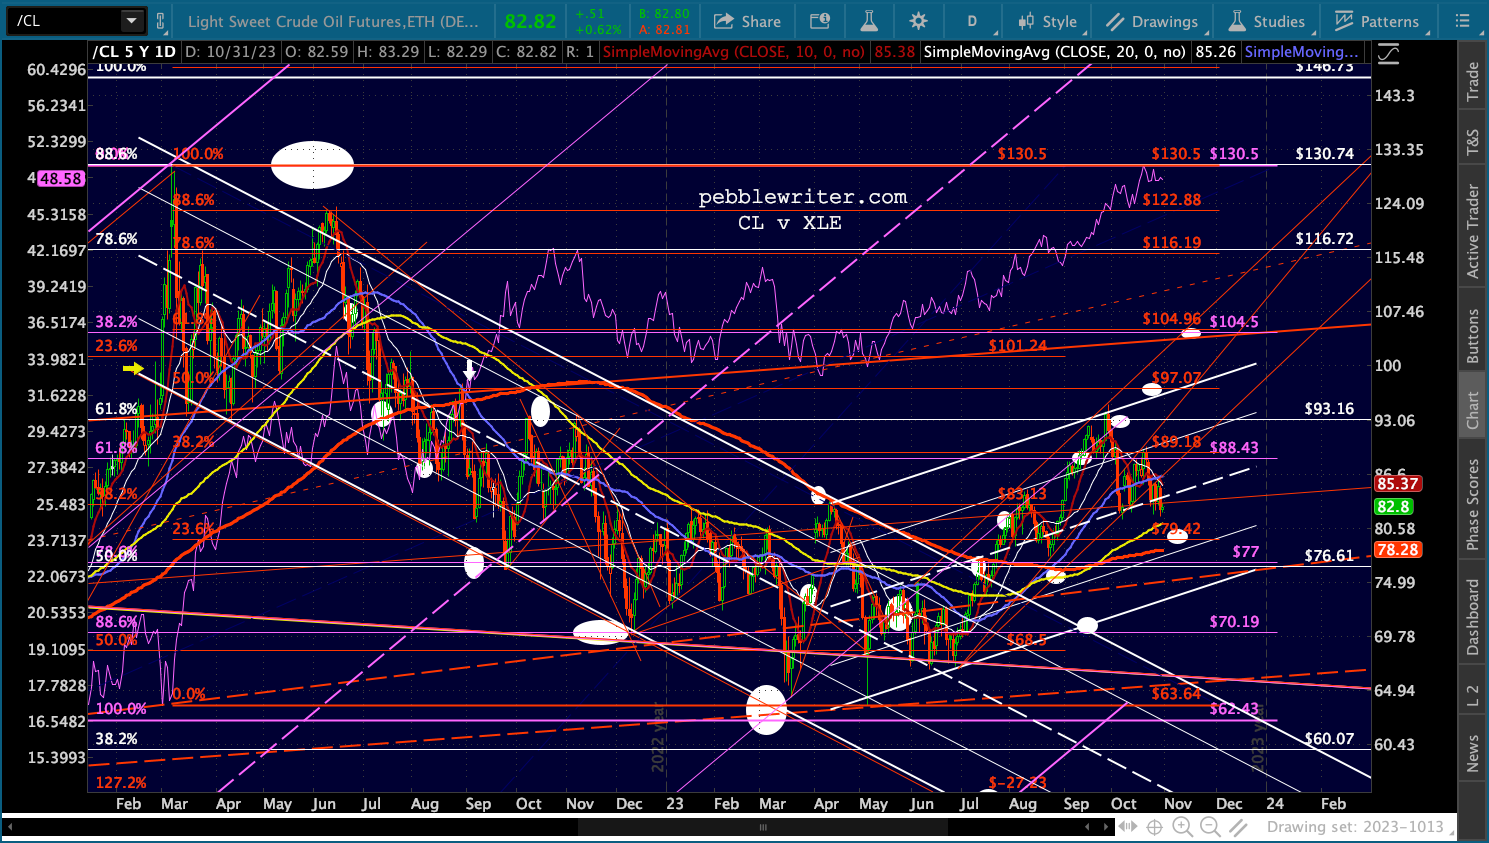
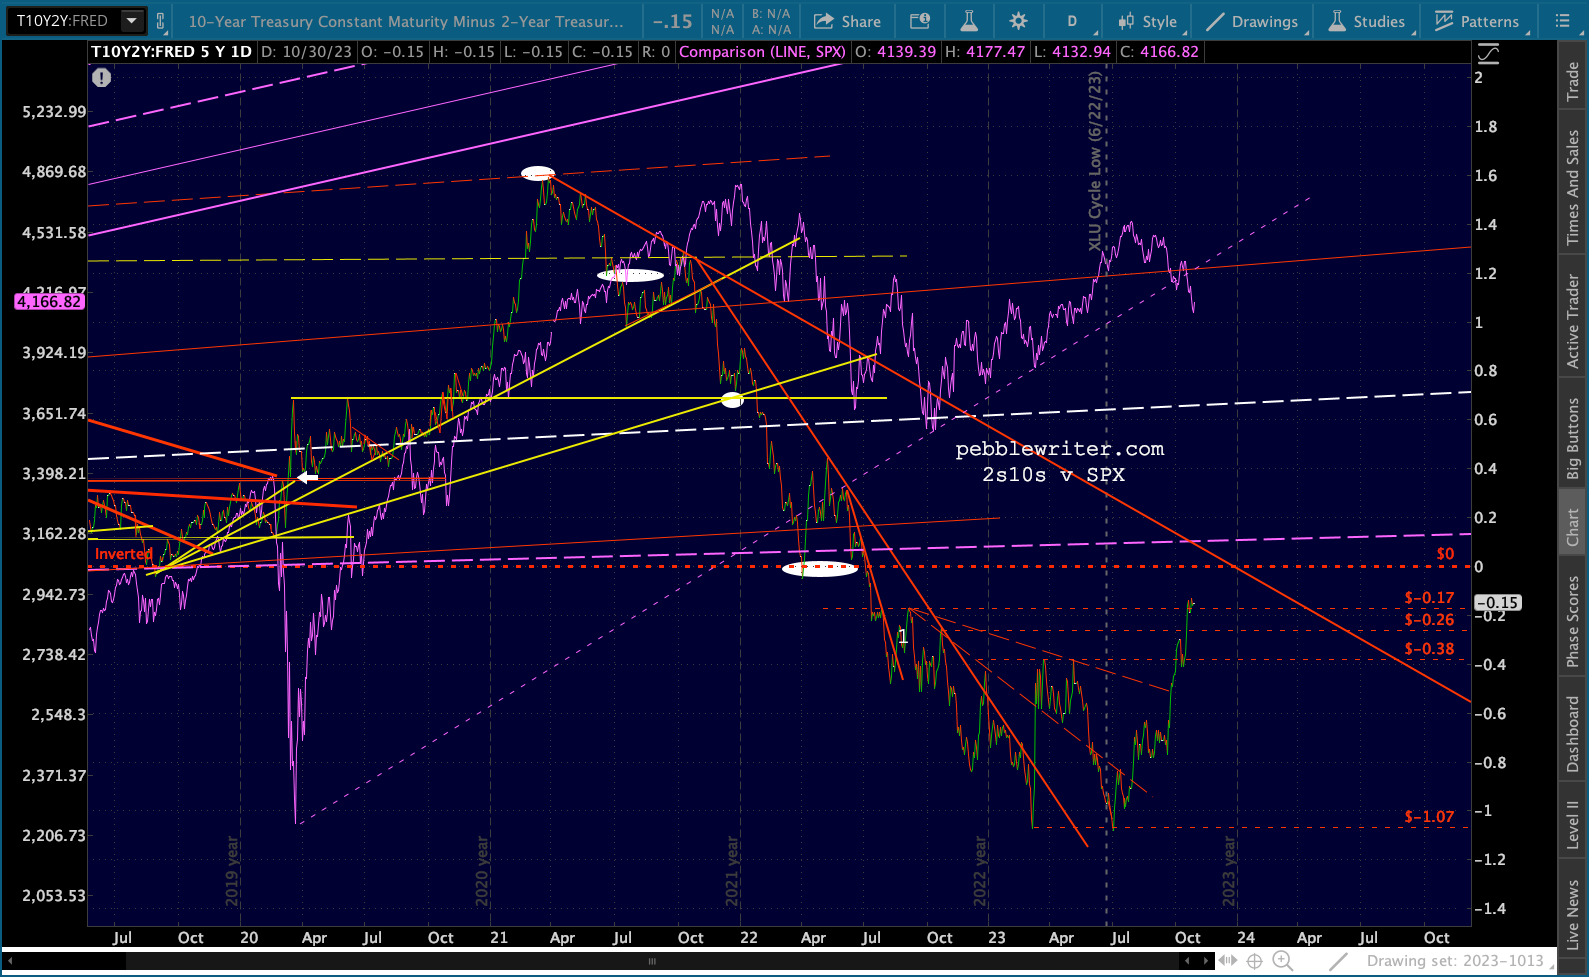
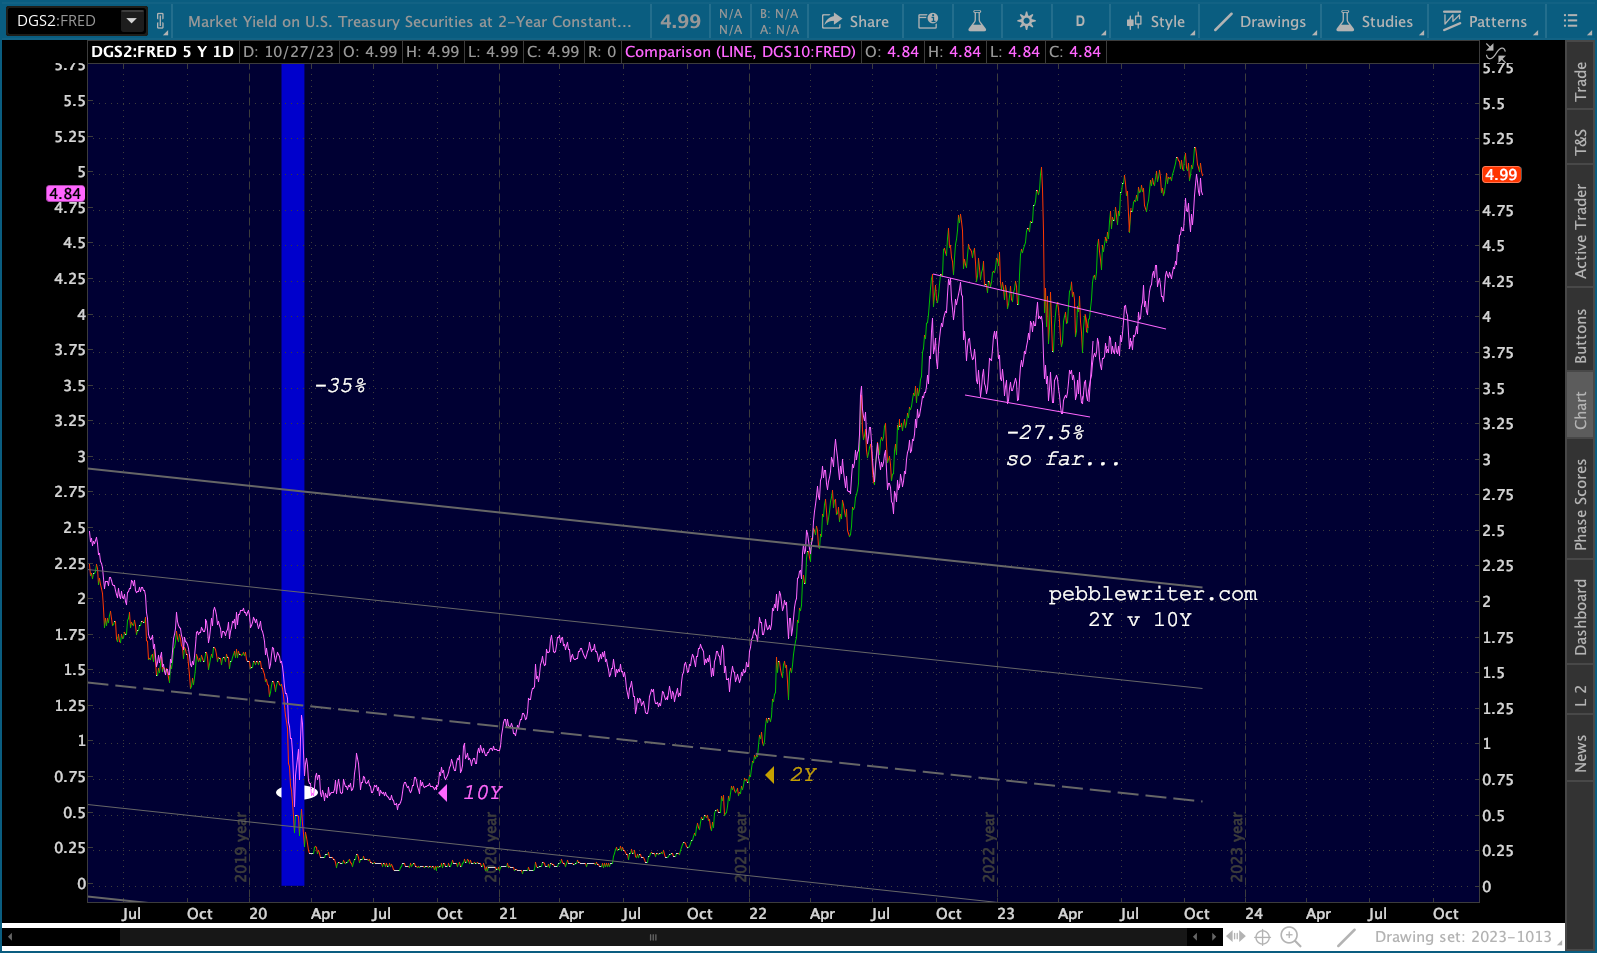
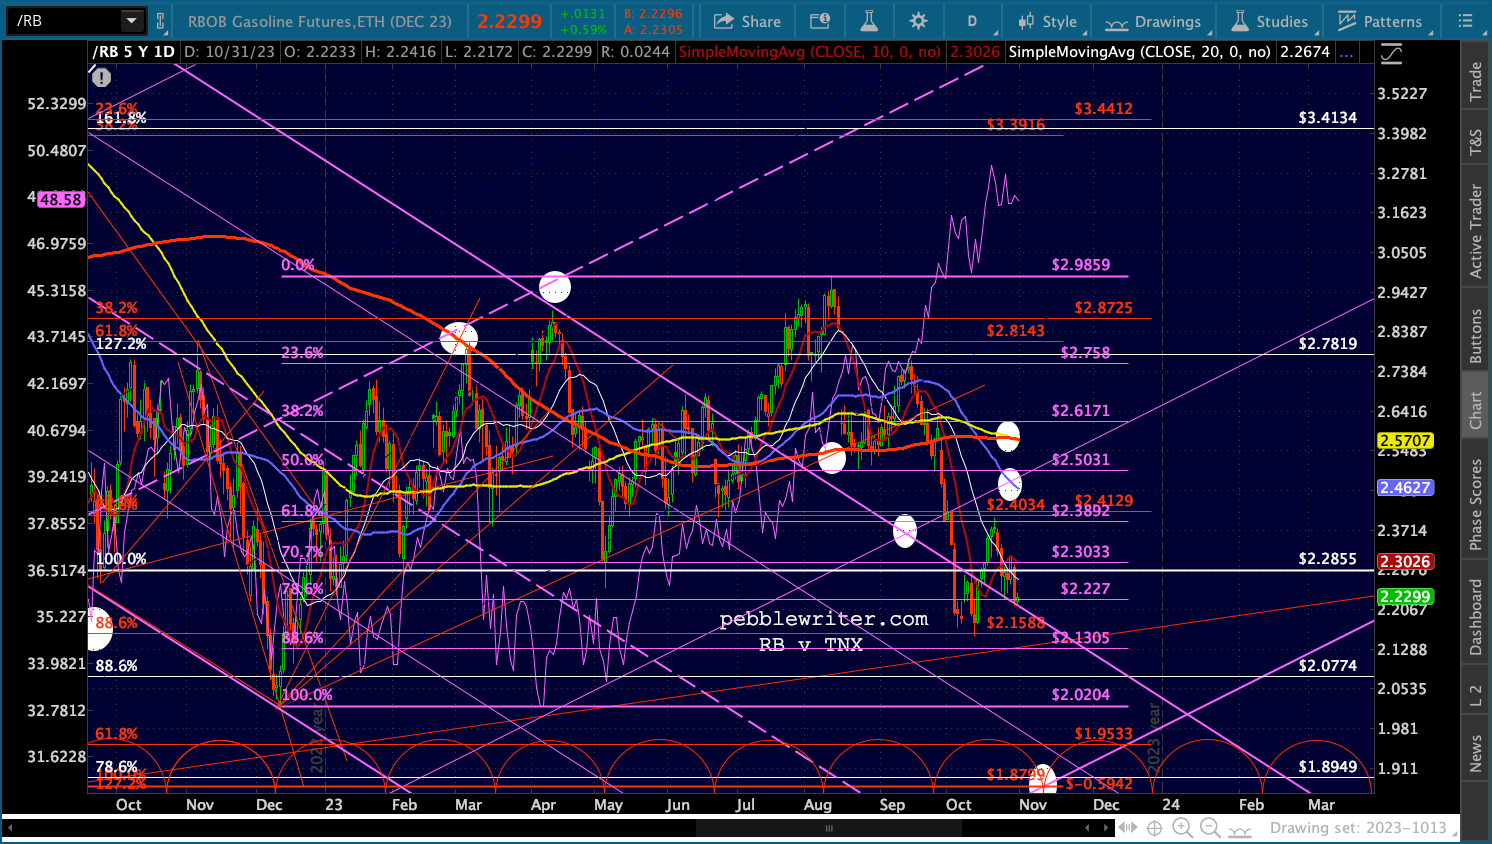 …while the 2s10s inches toward an end of the inversion.
 UPDATE: EOD
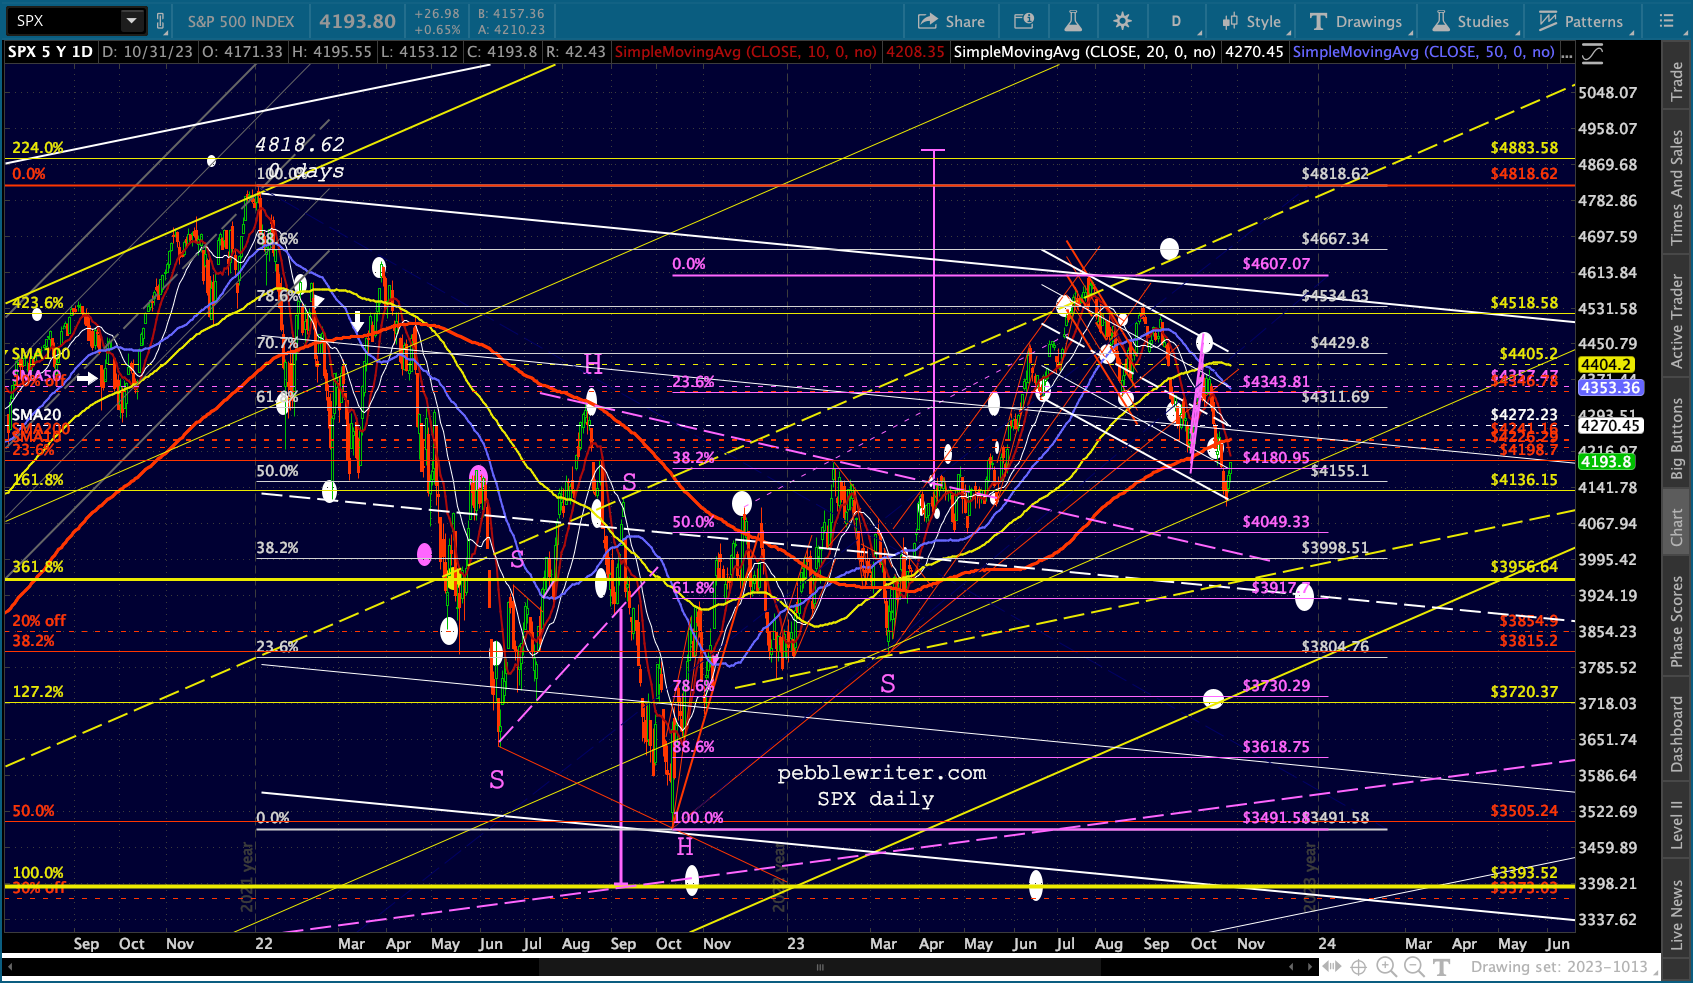
A strong bounce into the close after VIX broke down. Although SPX’s rising yellow channel has had plenty of wins and losses, the .236 line has had a few key saves along the way – notably Dec 2018 and Mar 2023 (yellow arrows.)
I haven’t put that much stock into it due to the many times SPX overshot or undershot one of the channel lines, but I point it out just in case the year-end run for the barn gets an early start. A drop by VIX through the SMA200 would help the bulls out immeasurably.
Note from the SPX/VIX overlay chart that VIX backtested and reversed lower after tagging the dashed purple TL in the 2nd chart below. This is an encouraging sign for the bears, but there have been so many headfakes with VIX that it’s always dicey to bet on this indicator.