

The universe has no trouble surprising us at times – things that make you stop and say “hmmm.” It is perhaps ironic that Shinzo Abe, architect of the greatest experiment in central bank monetary expansion and market manipulation in our lifetimes, has been shot dead as that experiment is being unwound. Naturally, the Nikkei futures are higher – which is what Abe would have wanted. Meanwhile, US markets are experiencing a little indigestion after learning that jobs growth is still strong, prompting Fed president Bostick to affirm his desire to raise rates another 75 bps this month.
 continued for members…
Nothing has really changed with our outlook, though VIX is still slipping lower as a variety of SMA50s are coming into view. 


 We should keep our eyes on EURUSD, which officially reached our 1.0071 target this morning. As we discussed a few days ago, a drop through it – which I expect – would be quite bearish for stocks.

 Gold and silver still look vulnerable here – especially gold.
 BTC’s bounce should be on its last legs.
 And,CL and RB are both still bouncing, with the next leg down likely right around the corner.
 I suspect it will stop TNX’s latest bounce in its tracks.
 UPDATE: 11:00 AM
Is a last backtest of the SMA50 in the cards? Maybe.
If it were to happen today for SPX, it would mean a nearly 70-pt gain on the day to the yellow 3.618 at 3956.64, then a 600-pt drop in 7 sessions (assuming the analog holds) ending Jul 19.
It would be comparable to the last leg down from 4165 on 6/7 to 3640 on 6/16: 525 points in 7 sessions. It’s perhaps important to note that on 6/7, SPX came within 68 points of the SMA50 before reversing – almost exactly the same as now.
Note that the C=A leg would put SPX at 3405.22 – only 11 points from the Feb 2020 highs immediately prior to the COVID crash. Could it exceed the target just a bit and tag 3393 (which is also the purple .886 retracement) instead?
At that point, it would be down 29.57% from the highs as opposed to the 30.4% suggested by our analog – close enough in my book.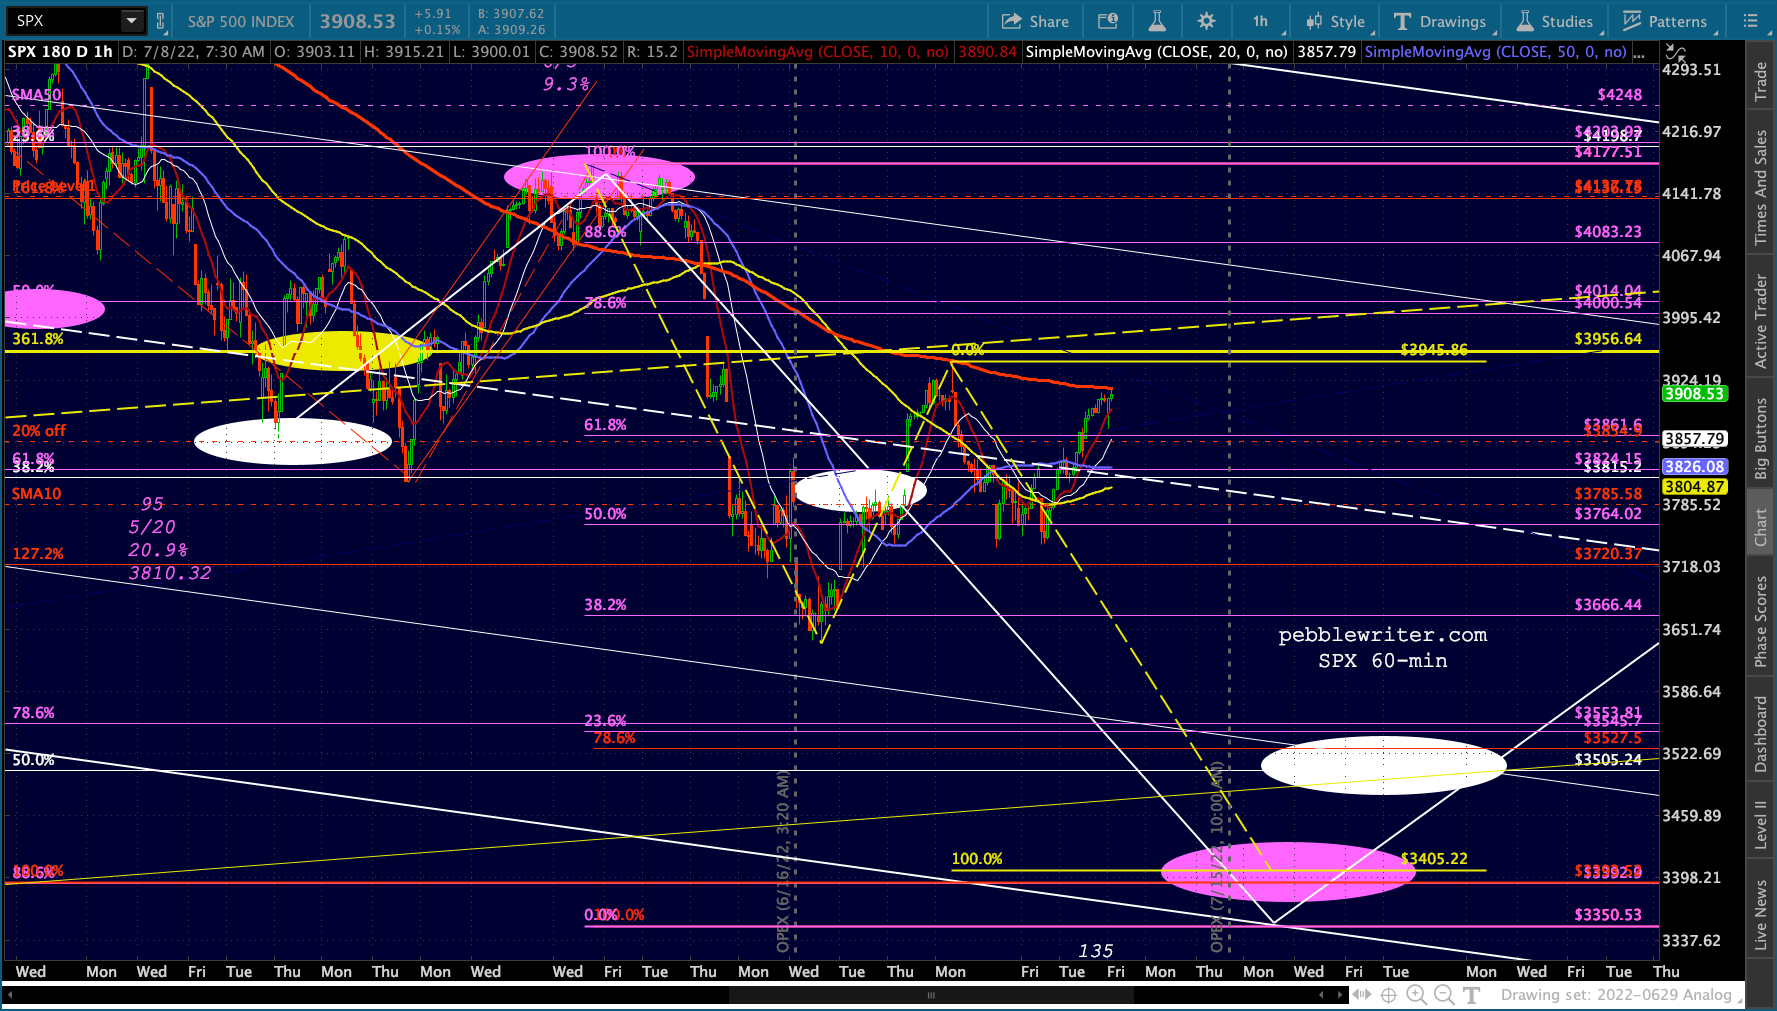 It’s an even better fit for ES – which is arguably the chart that’s more likely to follow the technical indicators. A C=A pattern starting on 5/30 at 4202.50 and reversing at 3950 on 6/28 points to 3386.75 on Jul 19. This is just 11 points lower than the Feb 2020 highs for ES.
 If you’re wondering why VIX’s ongoing collapse doesn’t argue for a higher high today, note that the peak, the start of SPX’s 13% collapse in June, came before VIX had bottomed out. Note the yellow arrow in the chart below. VIX continued to decline, but SPX was done. ES had topped out 3 sessions sooner. In other words, the continuing decline of VIX did not produce new highs for stocks. It was a total head fake – or, at the very least, ineffectual.
 I know it’s hard to get excited about shorting on a day like today, when another overnight dip was convincingly bought. But, that’s the thing about analogs. When they succeed, it’s almost always in spite of overwhelming evidence to the contrary.
If nothing else, it’s a testament to the willingness of TPTB to shake out all the weak hands and position themselves advantageously prior to a sharp downturn. I guess we’ll find out. If I’m right, this is a great opportunity to make a potential 5x directional bet.
 GLTA.
GLTA.