

Once in a while, charts are so crystal clear that we can see the future as easily as we can reflect on the past. Gold is not one of those charts. The zigs and zags come fast and furious and rarely correlate with anything happening in the real world. Witness the indifference this so-called inflation hedge has shown toward the highest inflation in 13 years.
But, the charts have pointed out some excellent trading opportunities along the way – usually by highlighting trend changes (or continuation patterns) that offer strong directional hints.
I thought it might be interesting to reflect on the use of channels. What do they tell us, and how can we use them to guide our trading?
By the time we layer in all the trend lines, Fibonacci levels, moving averages, etc. charts can start to take on a rat’s nest look.
 But, if we strip away some of those things, the channels tell a very compelling story. GC’s long-term chart, for instance, starts with a long, pretty well-formed channel. It did a reasonably good job of guiding prices from the late 1990s until 2014.
 When it broke down in late 2014, it was a clear signal that the long-term trend had given up the ghost.
 We can see that the breakdown followed a pretty clear trend lower, marked by the red channel below.
  When GC rallied out of that falling red channel – a clear buy signal – we were able to construct a less bearish falling purple channel that guided prices for several more years. When GC reached the bottom of that channel, it accurately signaled a good buying opportunity. That signaled was reinforced when, in 2019, GC broke out of it.
  Once a few parallel highs and lows were established, we had a rising channel once again. But, GC broke out of that rising channel, requiring a more aggressive one.
 We added the rising purple channel to accommodate it…
 …and expanded the red channel to make room for the new highs.
 Although it’s a little early to say with any certainty, the rising purple channel is threatening to break down. It obviously sets up a backtest of the rising red channel’s midline (the dashed red line.) If the two of them are breached, it would be a very bearish signal – particularly in light of the drop through the 200-DMA.
Put it all together, throw in some trend lines and other chart patterns, and we get a pretty clear picture that GC is on the verge of a breakdown. The chart doesn’t necessarily tell us which way it will ultimately go, just that we’re at an important juncture – very useful information indeed. The factors have been busy overnight, seemingly in quarter-end mode to prompt a bullish run for the barn. Will it be enough?
 continued for members…
ES is off this morning, but at this point it’s a backtest of a bullish breakout. Whether or not it holds is another question.
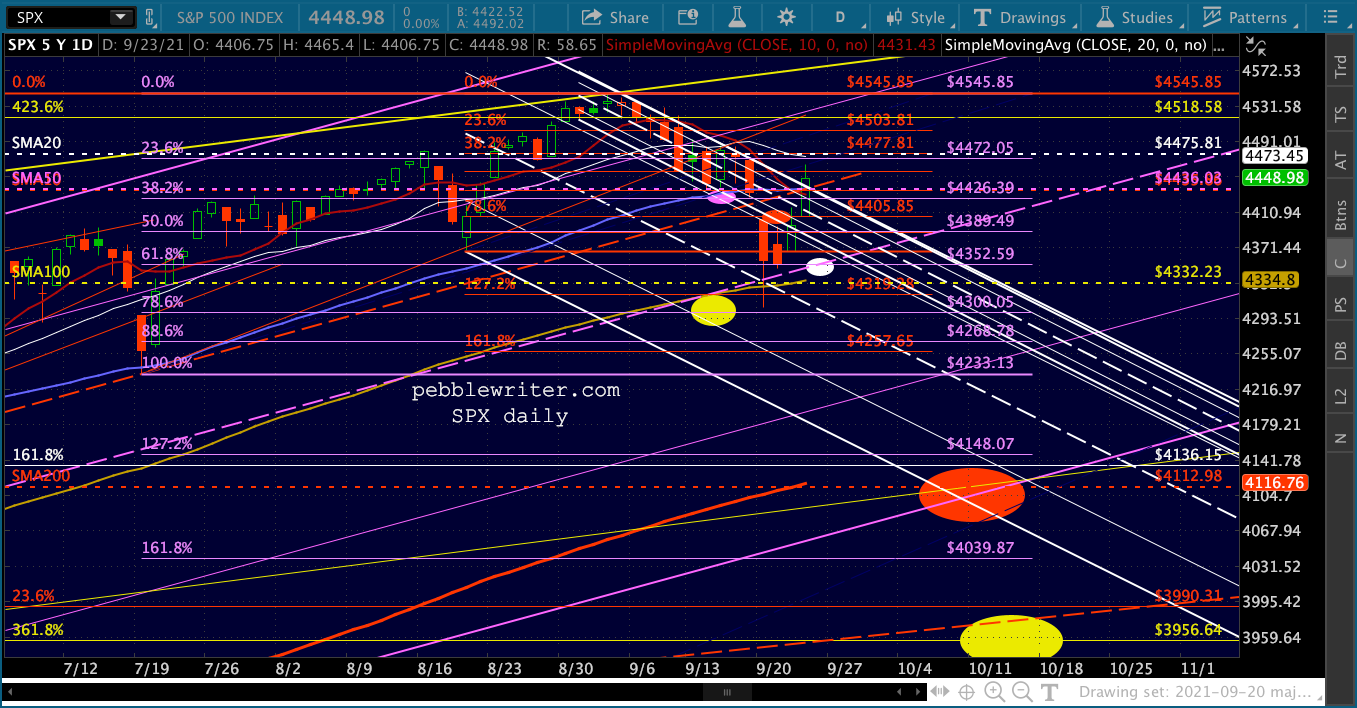
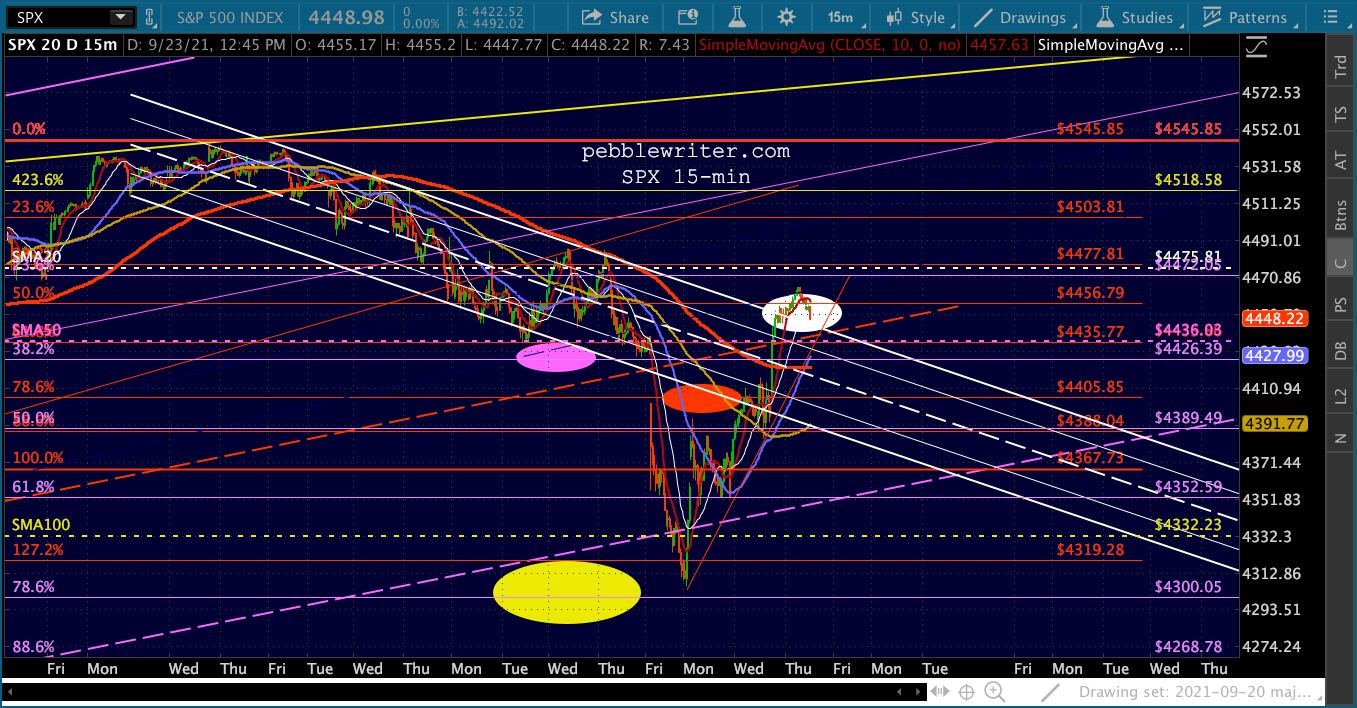 We can see the same thing going on in SPX.
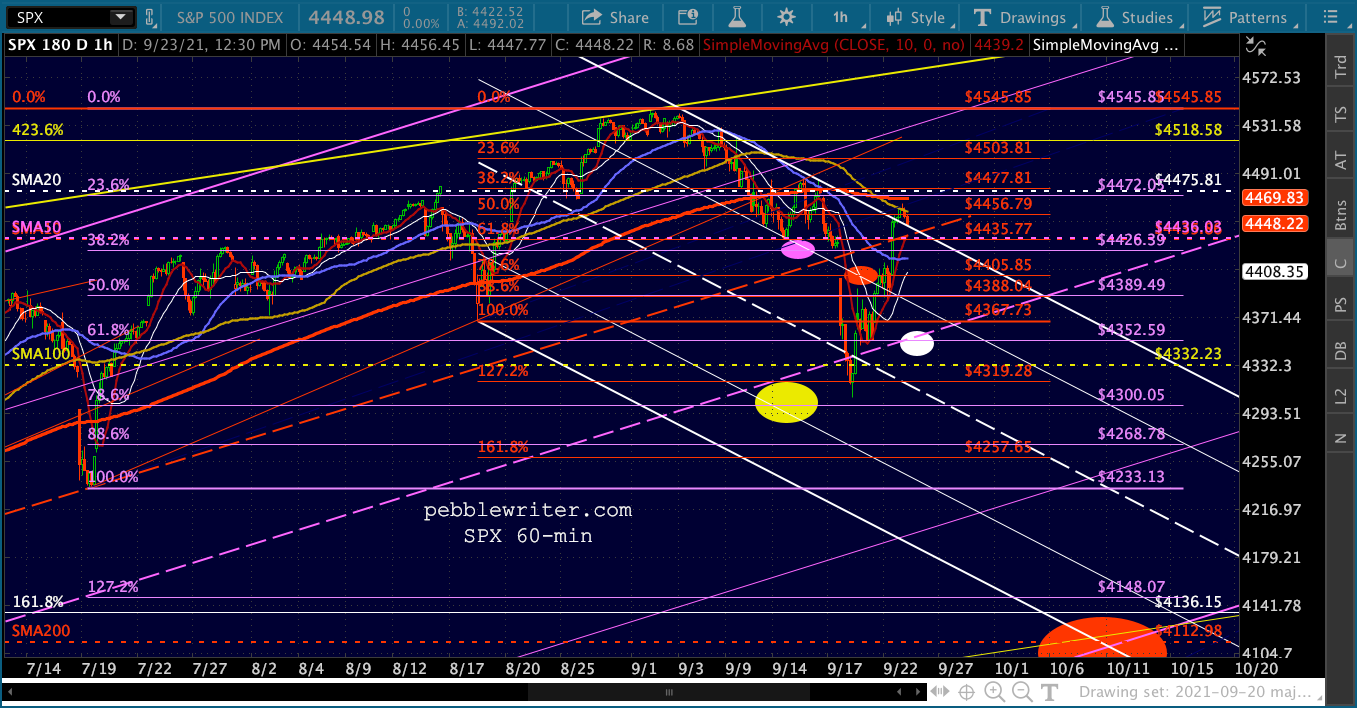
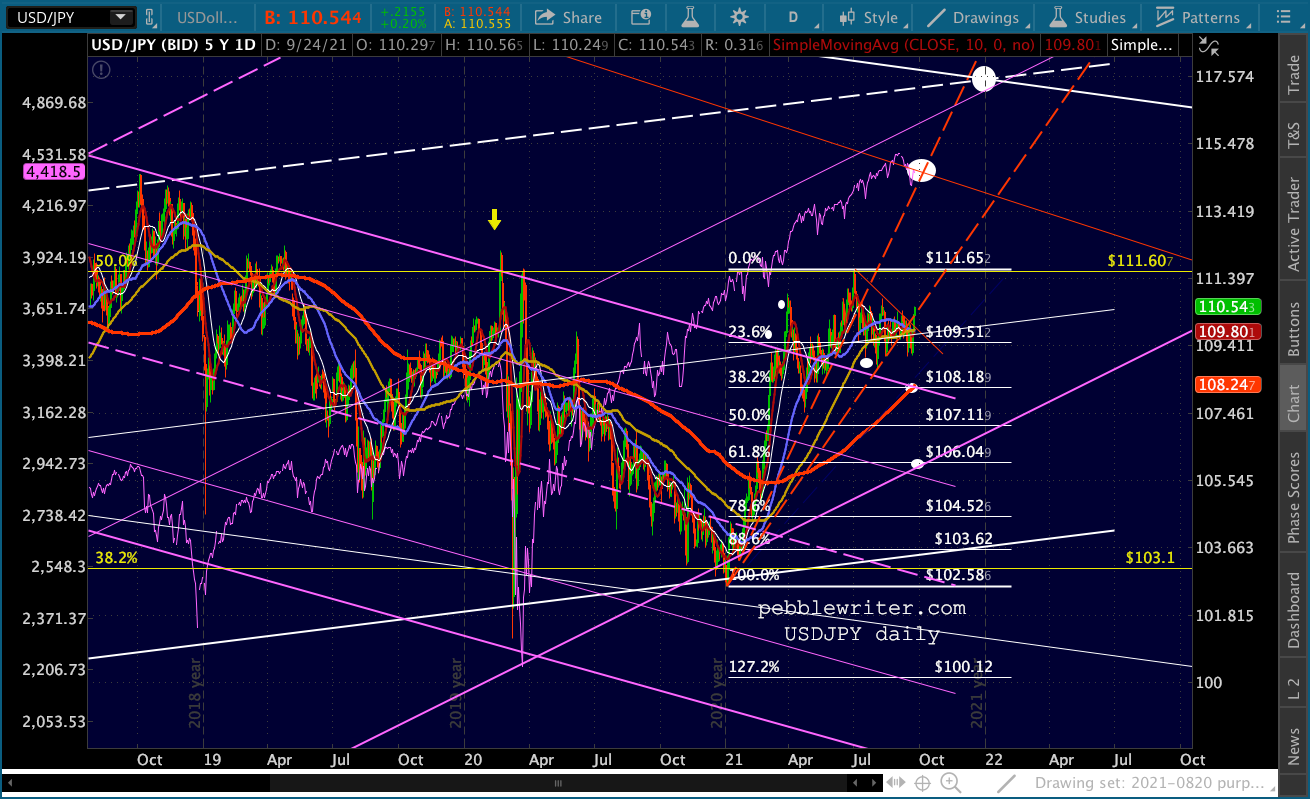
 The instigators are being led by USDJPY, which is threatening to break out rather than backtest the channel top and SMA200…
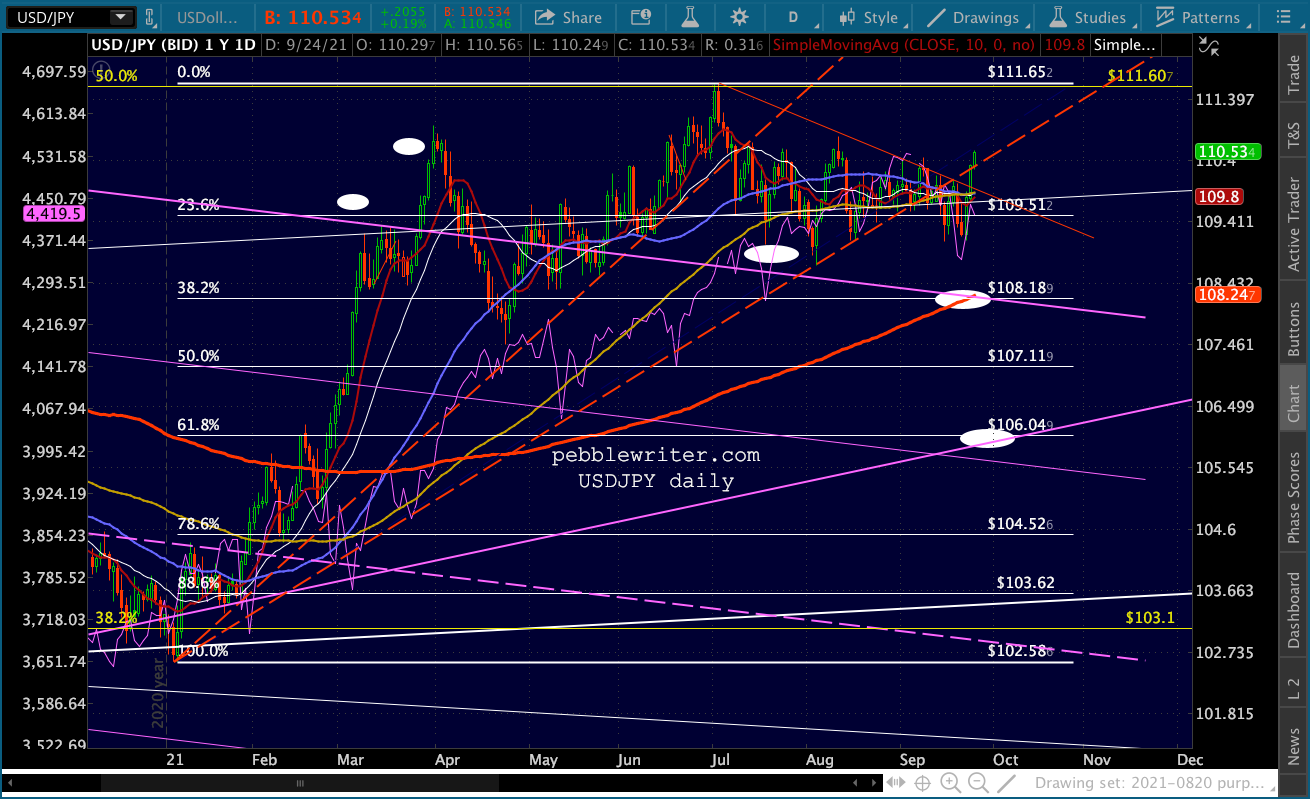
 …and ZN, which is apparently breaking down.
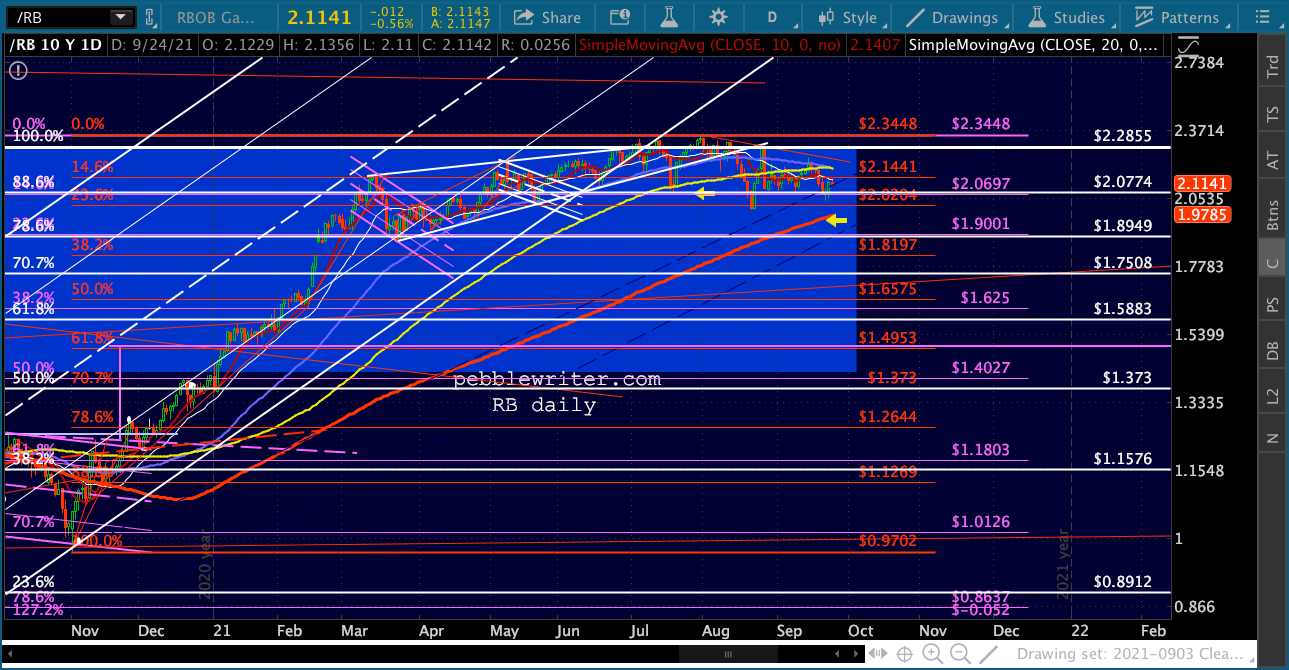
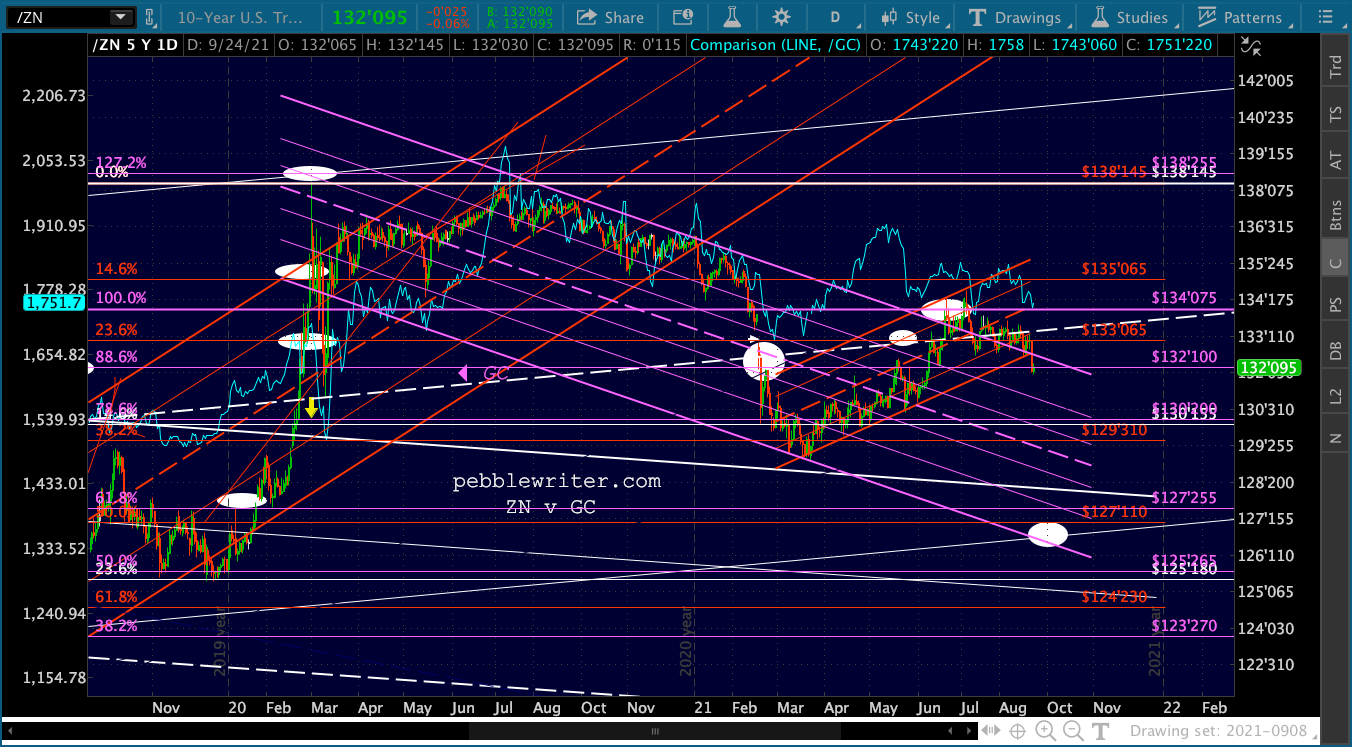 Elsewhere, we still have oil and gas threatening new highs.
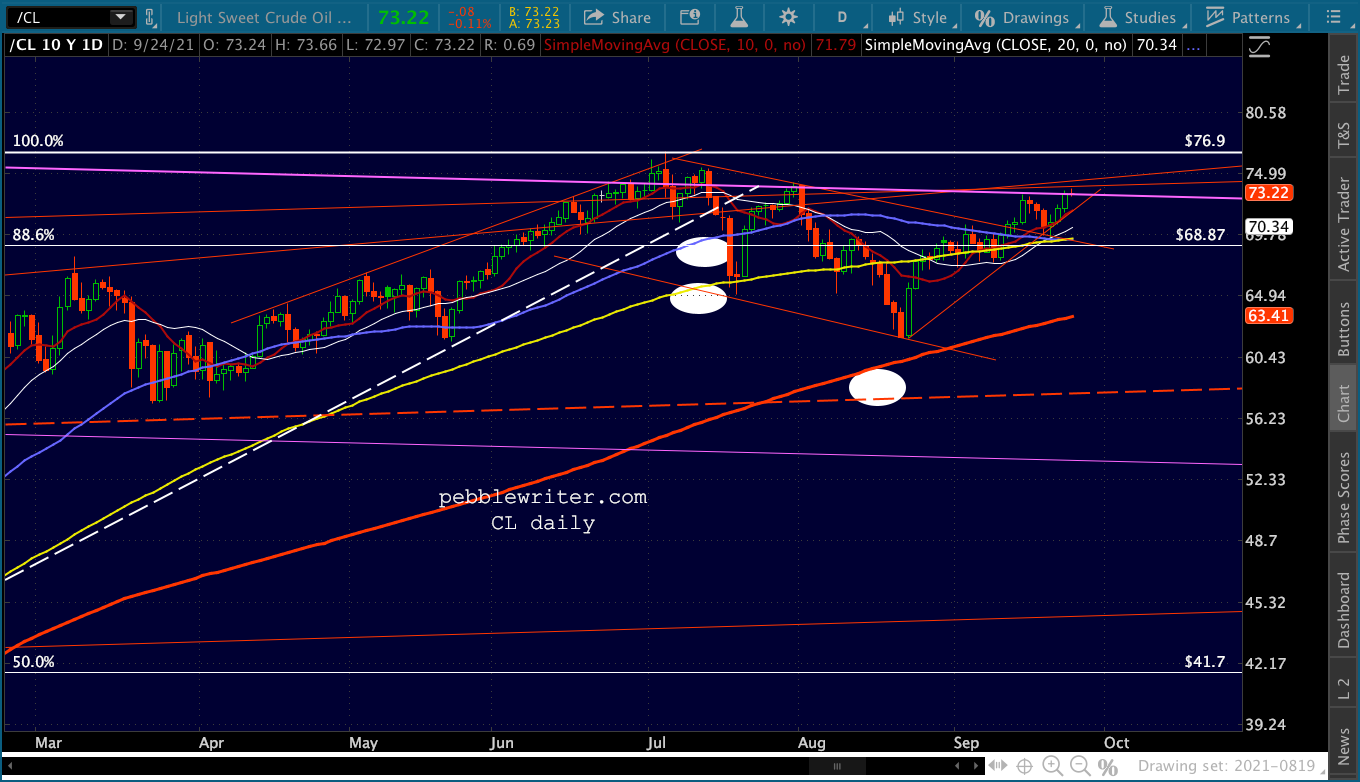
 And, the EURUSD is still shuffling sideways, postponing (at least) its backtest.
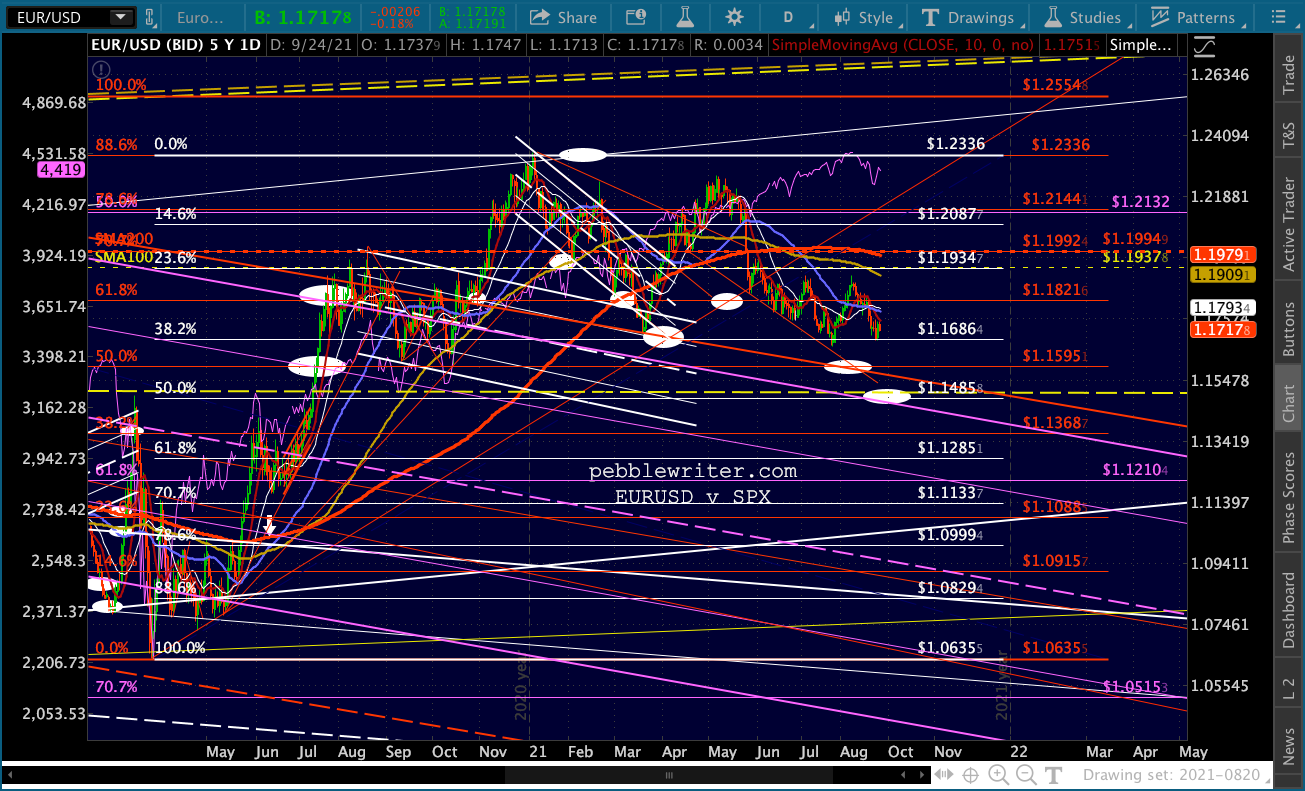
 Silver is still looking scary…
 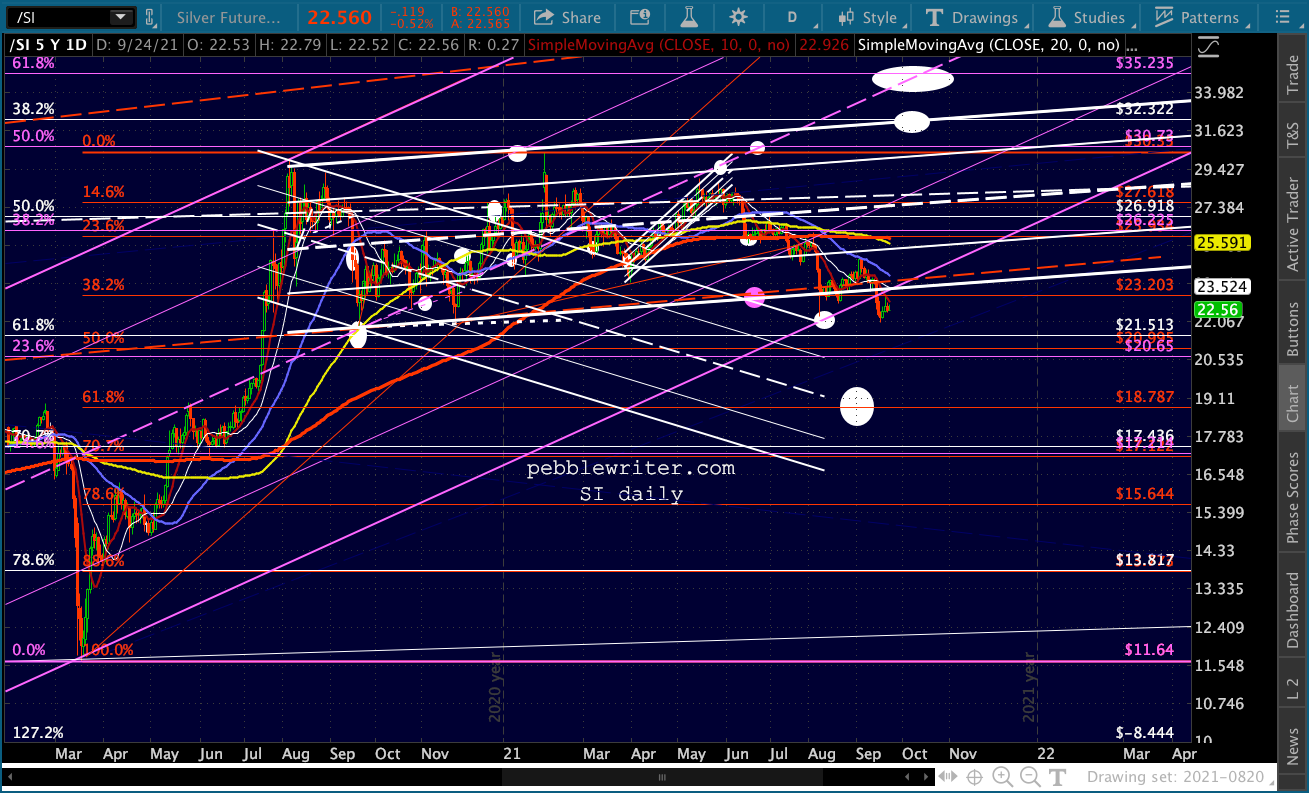 And, GC’s rising purple channel has definitely broken down – though we wait to see whether the backtests mentioned above (not to mention the IH&S backtest) will hold.
The big dog is still VIX, which is back inside its falling white channel and back below its SMA200;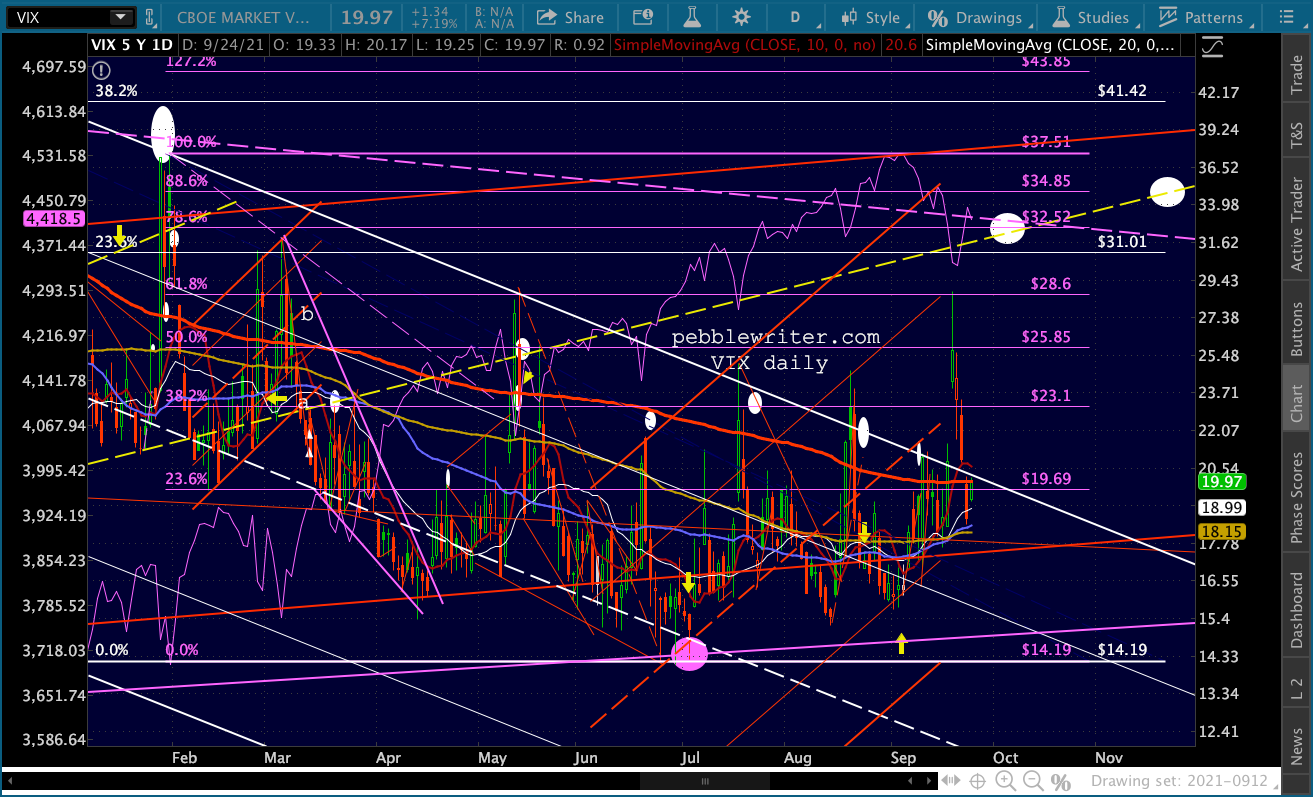 I still believe we have another leg down in the markets, but you really couldn’t tell from the factors. Then again, it’s Friday, nearing the end of the month and quarter.
I’m traveling today, so will sign off for now. GLTA.