

Texas, the energy capital of the US, is running short of energy. The cold snap is breaking records throughout the state, with temperatures so low that many wind and water turbines are frozen and not able to produce energy. Refineries are shut down. As of last night, over 3.5 million Texans are without power.
Not surprisingly, oil, gasoline and especially natural gas prices have shot higher.
 continued for members…
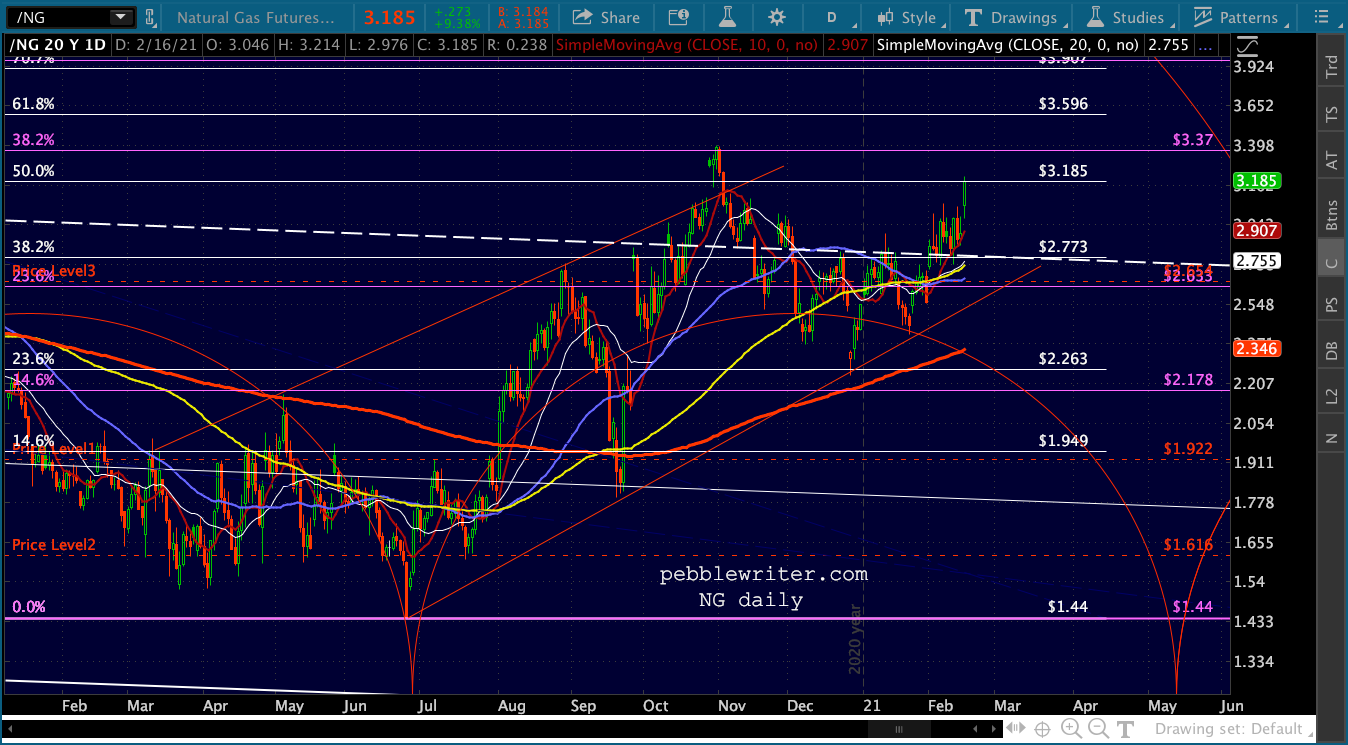
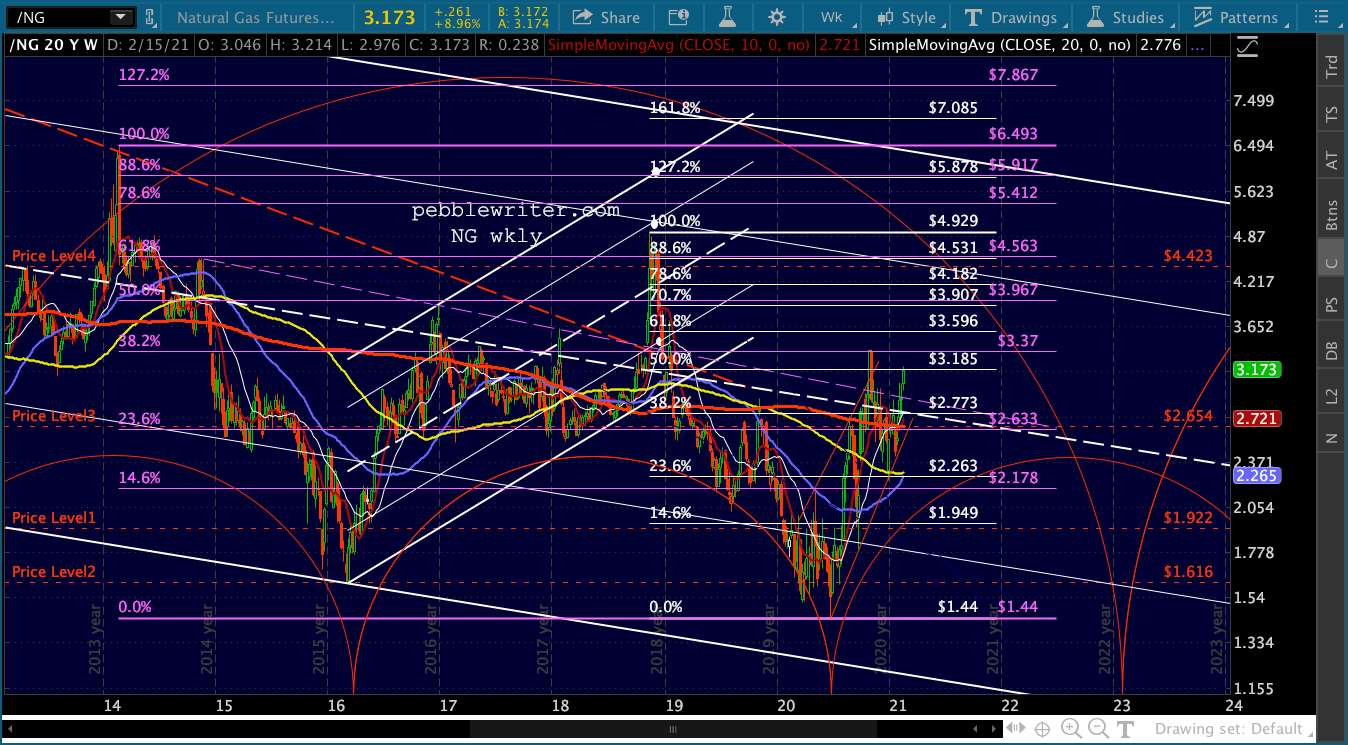
This is a bit of a breakout for NG, with current prices surging past the falling white channel midline.
The channel had been well-defined until its Jun 2020 low failed to tag the channel bottom. It has been quite a while since it tagged the channel top. In Feb 2014 and Nov 2018, NG managed to tag the channel’s .786 line after pushing briefly past the midline.
It’s important to note how quickly most of these surges past the midline failed. The one in November 2020, for instance, lasted less than two weeks.

 Gasoline also spiked, with RB coming quite close to its Feb 2020 highs (1.8033 on Feb 20, 2020)…
 …while CL, up less than 1% on the day, is has been less affected – though it has already topped its Feb 2020 highs.
 I grew up in Texas and can attest that while power occasionally went out due to an electrical line icing up and snapping during an ice storm, widespread power outages were unheard of.
This breakdown is all about a power grid being built around normal weather patterns. According to the CEO of ERCOT, Texas’ power regulator, the supply of natural gas to power plants was limited, and half of the system’s wind turbines had frozen, keeping at least 12k megawatts offline.
I doubt anyone installing hydroelectric or wind turbines in Texas lakes ever thought about sustained temperature readings of 0-10 degrees. But, a similar incident occurred in 2011. Texas, which has its own power grid, had to import power from Mexico.
We are seeing much colder weather in the Midwest and Rockies, but their grids can borrow from one another and were built to handle this kind of weather. The weather is forecast to warm up in the coming days, with most large cities back above freezing by Wednesday and in the 60s by this time next week. I suspect this is the last gasp for oil, gasoline and natural gas prices.
Some might be wondering how they keep rallying when the obvious inflation problem is looming – the base effect we’ve been talking about for months. Yes, there are obvious fundamental factors and threats to consider: rising Houthis-Saudi conflicts, Russian antics, Iran’s nuclear stance, a recent rocket attack in Iraq and increasing animosity between the US and Turkey. But, last week’s CPI report sheds a light on the true reason: monetary policy.
The 0.3% MoM CPI reported would have been negative had it not been for energy commodities’ 7.3% increase.
 But, it’s the YoY figure which will soon cause problems. At current prices, the 8.7% YoY decrease will turn into a large increase in 1-2 months. According to the BLS, regular gasoline dropped 8.6% YoY in January. This is pretty close to EIA’s data, which shows a 8.4% drop.
The current nationwide price is about 2.52. If it holds steady, Feb gasoline would rise 3.2% YoY, Mar would rise 12.8%, and April would rise 36.9%.
 Now, let’s talk timing. Note that gas prices peaked in the first week of Jan 2020 and dropped steadily until a slight bump for the last two weeks of February – where we are now in 2021.
  The data below shows the detail behind the sharp drop following the February bump in the chart above.
 Bottom line, the Fed has needed modestly higher energy prices up until this point to keep MoM CPI from going negative and to keep YoY CPI from going too high. If a YoY price increase rose from -8.7% to +37%, CPI and interest rates would be well over 2%.
They will need to switch from a regimen of rising gasoline price to help to bolster inflation to one of gasoline prices falling to help suppress inflation – particularly if the price increases in medical care, clothing and food continue.
If I’m wrong, it would mean the FOMC is fine with soaring inflation and expects to be able to explain the inflation bump as transitory (it will be) and that there is no need for interest rates to double from their current levels. I have a very hard time believing that they’ll take this chance.
* * *
Elsewhere in the markets this morning, futures are higher across the board, though off their overnight highs which came within 38 points of ES’ 3.618 Fib extension.
 Note that SPX is only slightly below its 3.618, closing only 22 points below it on Friday.
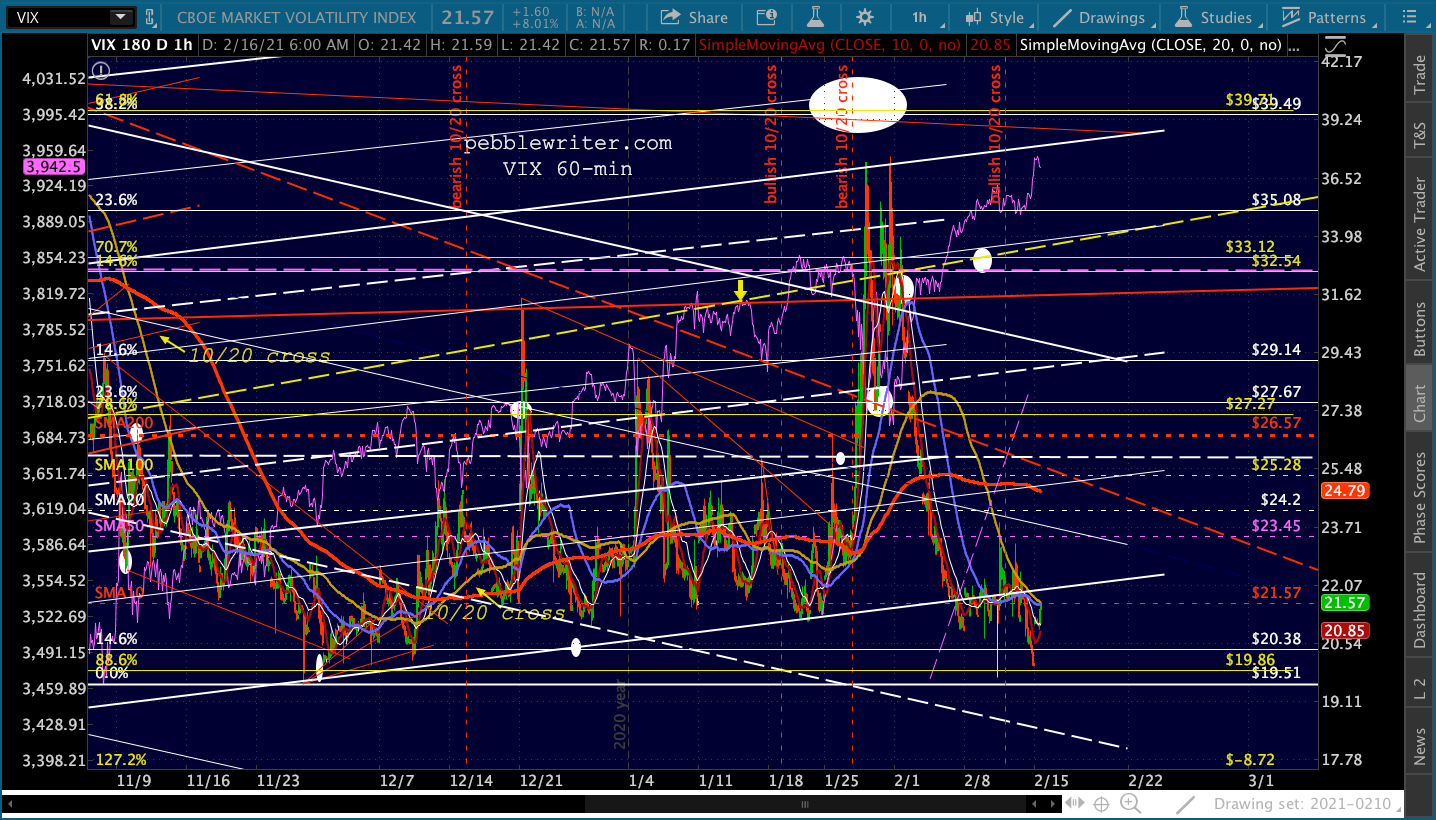
 As has been the case for weeks, VIX is being very active in spurring equity algos into buying spasms. At present, it has backtested the white channel bottom it broke below last week.
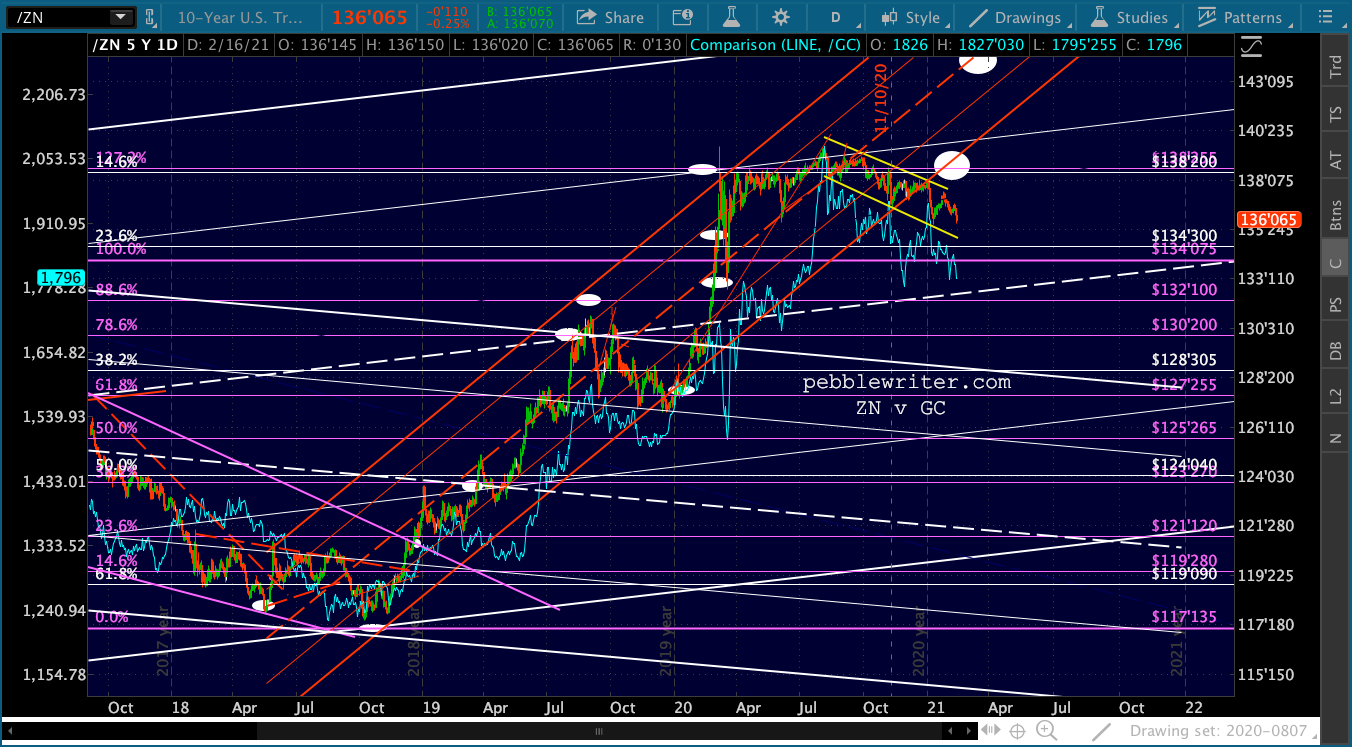
 The bond market is taking its inflation cues from energy, with the 10Y briefly topping its Mar 18, 2020 highs.
 This has, in turn nudged ZN toward its channel lows and an associated drop in GC.
 The GC chart itself…
 …and SI.
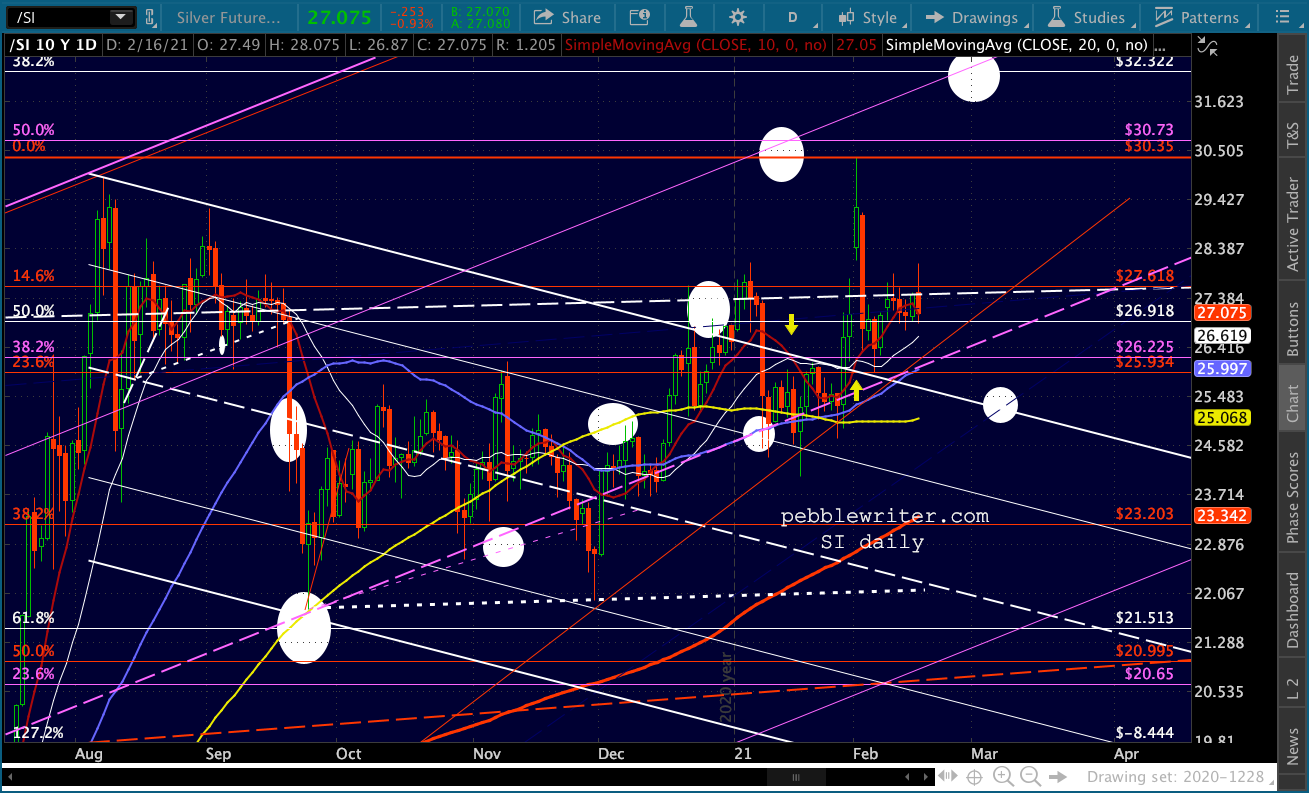 Thanks to the jump in rates and the yen carry trade, DXY is getting a little boost…
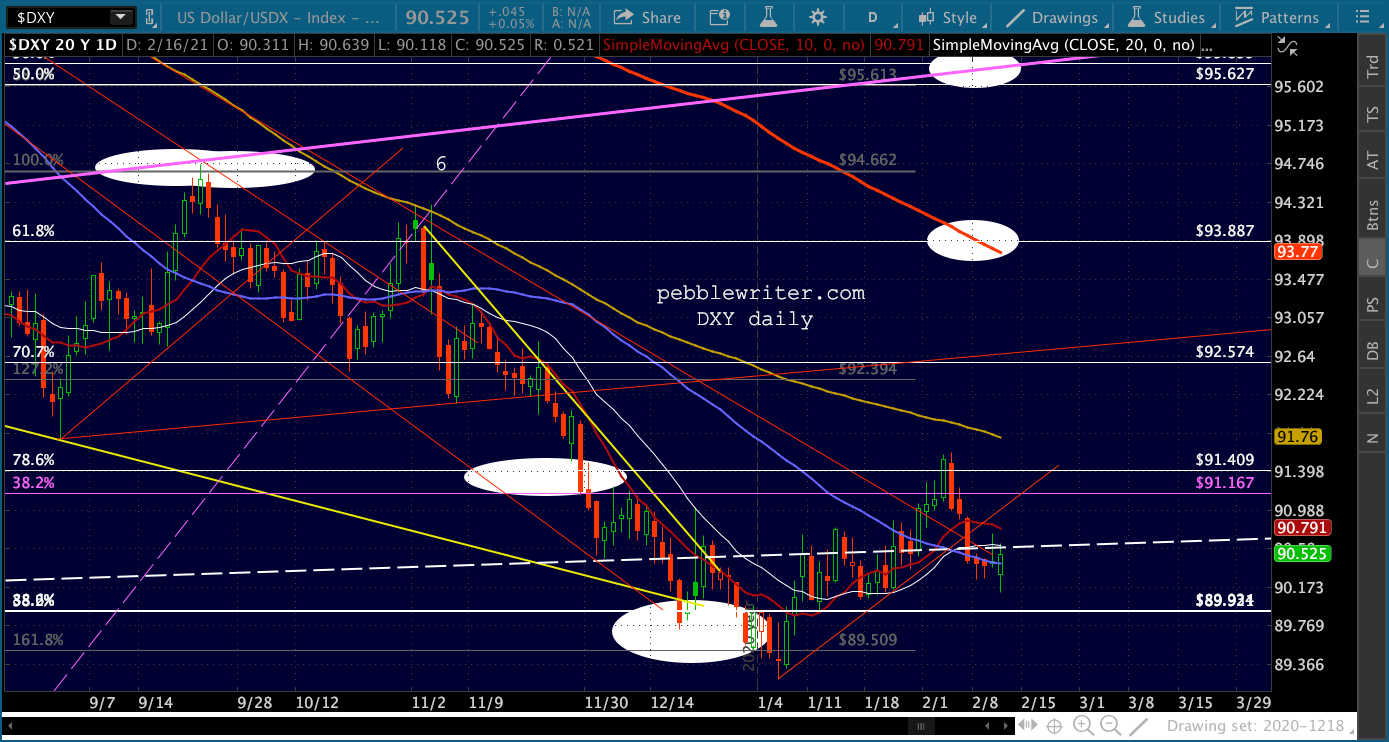 …with USDJPY pushing through its SMA200…
  …and EURUSD still treading water.
 BTC is still leaking higher, with its SMA10 finally catching up with it. It tested 50,000 earlier, a nice big round number that might induce some longer-term holders to liquidate though it has no Fib or chart pattern significance.
 Now, back to the energy markets discussion above…