

Under ordinary circumstances, a 2.3% MoM bump in Durable Goods orders would be very welcome – especially on the heels of last month’s -1.3% print. When inflation is a growing concern due to the Fed’s largesse, however, it complicates things. For instance, might it cause the Fed to take its foot off the gas?
Not to worry, VIX was hammered sharply lower for the fourth session in a row.  It’s now off 35% since Monday’s highs and has reached levels last seen on Feb 14, 2020, a few days before the market crashed. Note that this is the target we first charted back in early April [see: Irrational Exuberance and You]…
 …when we observed that VIX was repeating a pattern seen many times over the years.
It should come as no surprise that VIX did break down and SPX did, indeed, rise above 3956. Like all the other breakdowns, this one has the potential to keep the party going long past curfew.
This time, it went a step further – breaking below a falling trend line – especially bearish for VIX and bullish for stocks. It now has the opportunity to break below the trend line from 2017 — all the reassurance algos would need in order to bid stocks even higher.
 Along the same lines, RBOB futures just topped their May 2018 highs (CPI was 2.8%) and are now 27% higher than their Feb 2020 (2.33% CPI) peak – even though total miles driven in April 2021 were 10% lower than April 2020 and 11% lower than in May 2018. RBOB hasn’t been higher than this since Oct 2014 when CPI, now 5%, was retreating from its recent 2.13% highs.
If this all seems a little overdone, you’re right. The economy has rebounded. But, few responsible economists would argue that things are better than in Feb 2020 when markets crashed as the pandemic roiled the global economy.
The obvious X-factor, of course, is the massive amount of money the Fed has thrown at markets. The less obvious factor is the ease with which the Fed can manipulate algos. The warning signs which used to cause correction-causing reversions to the mean — rapidly rising inflation and interest rates, rising volatility, etc. — are no longer legitimate concerns.
Why? Because the Fed has proven that stocks can keep rising even in the face of data that would otherwise be problematic. So what if inflation is out of control? Interest rates sure don’t reflect it. Below trend GDP? All the more reason for massive QE.  They haven’t learned how to cure the patient, let alone prevent him from getting sick. But, they’ve rigged the thermometer, the blood pressure cuff, and the stethoscope to indicate that everything is just fine.
continued for members…
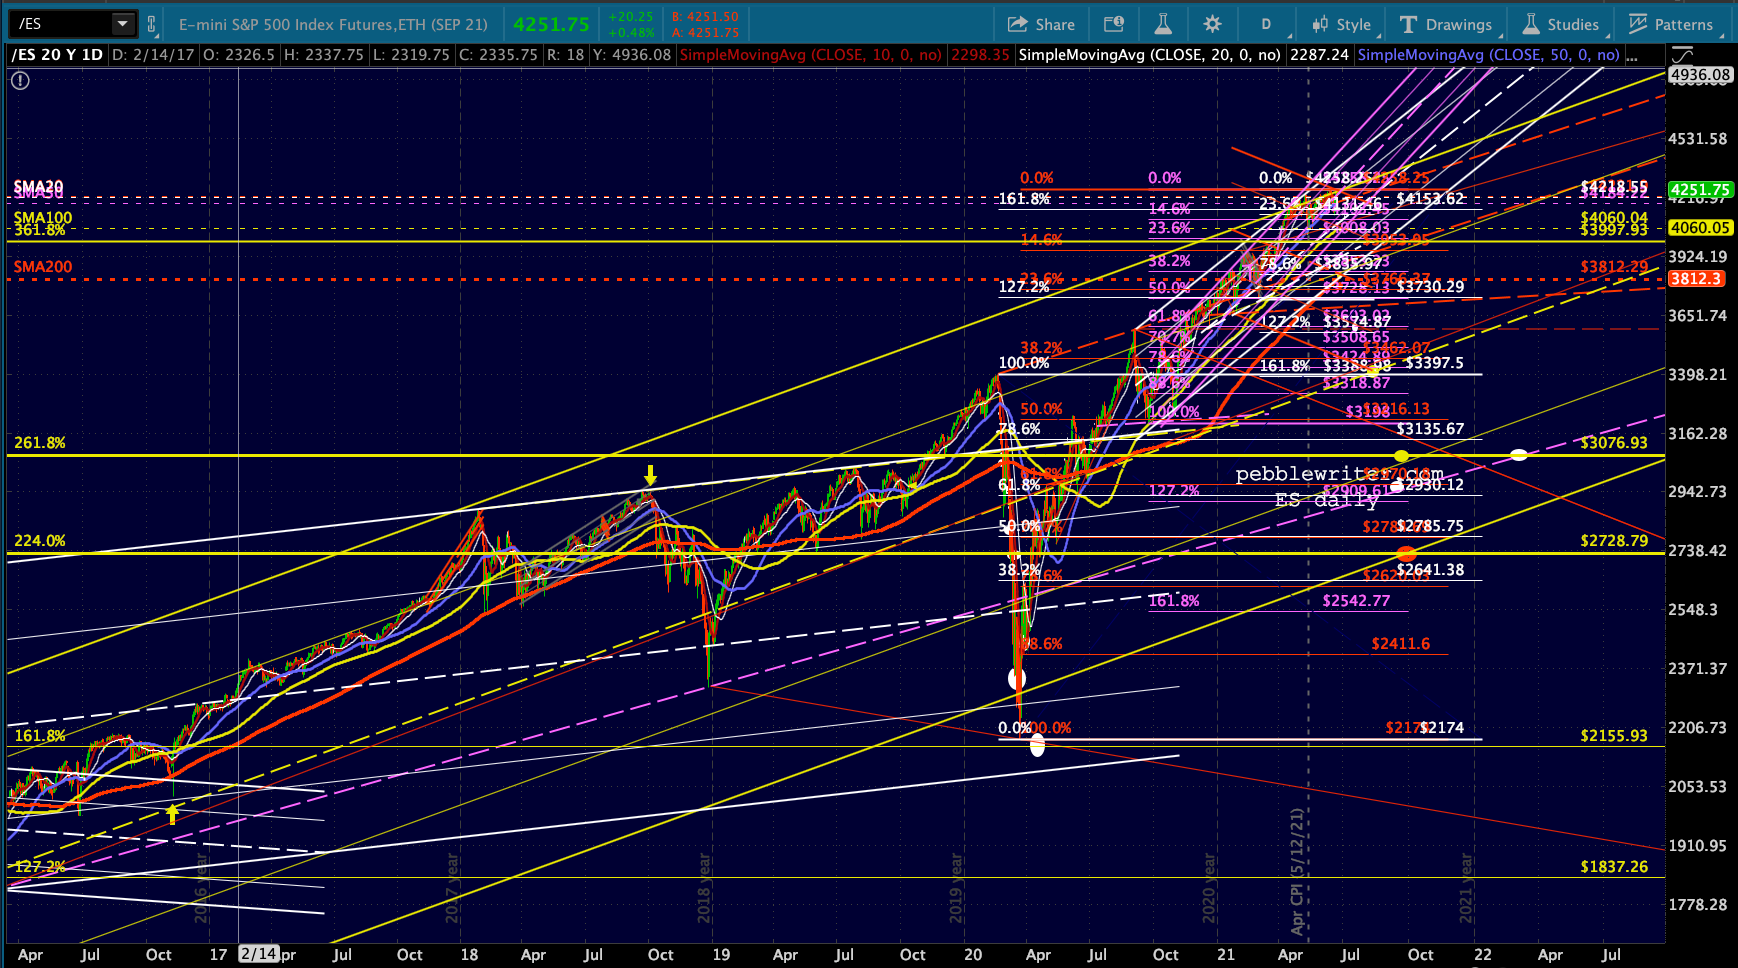
Today’s big picture: ES continues bumping along the top of the yellow channel established in 2009. It hasn’t broken out yet, but it’s been on the verge of breaking out since mid-April.


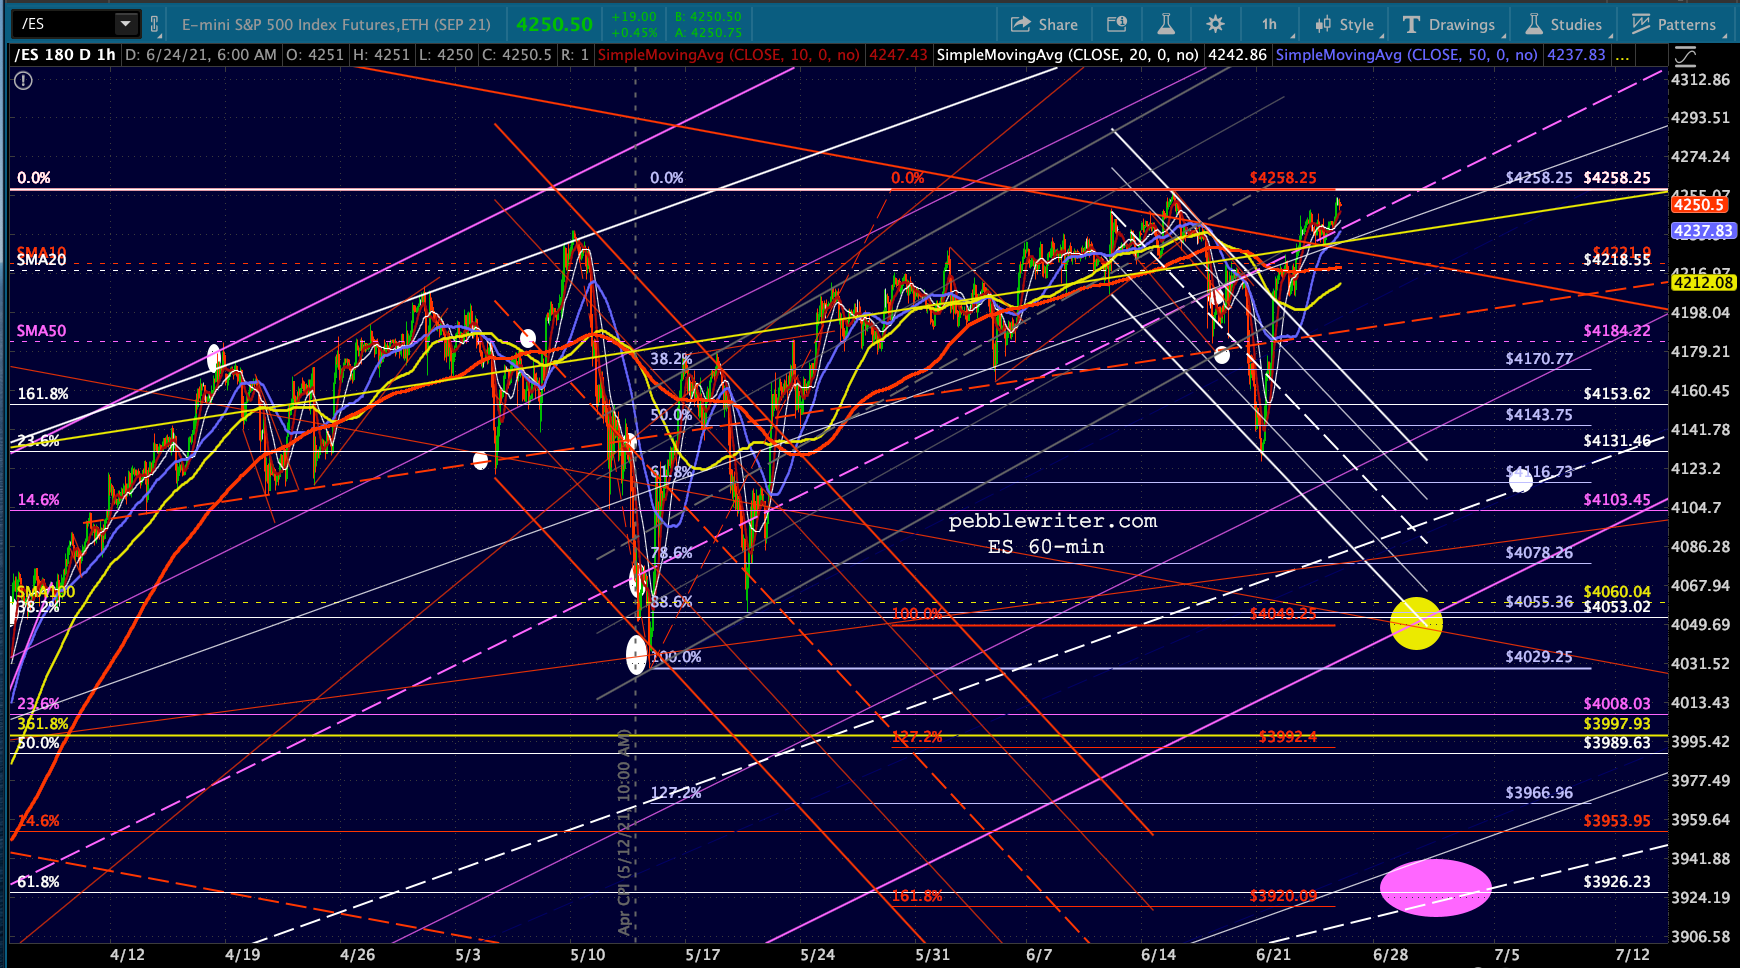 SPX has made a new high after a soft close yesterday.
 All because the Fed has perfected the ability to manipulate stock prices higher. By reaching the purple TL from Nov 2017, VIX has another opportunity to break down.
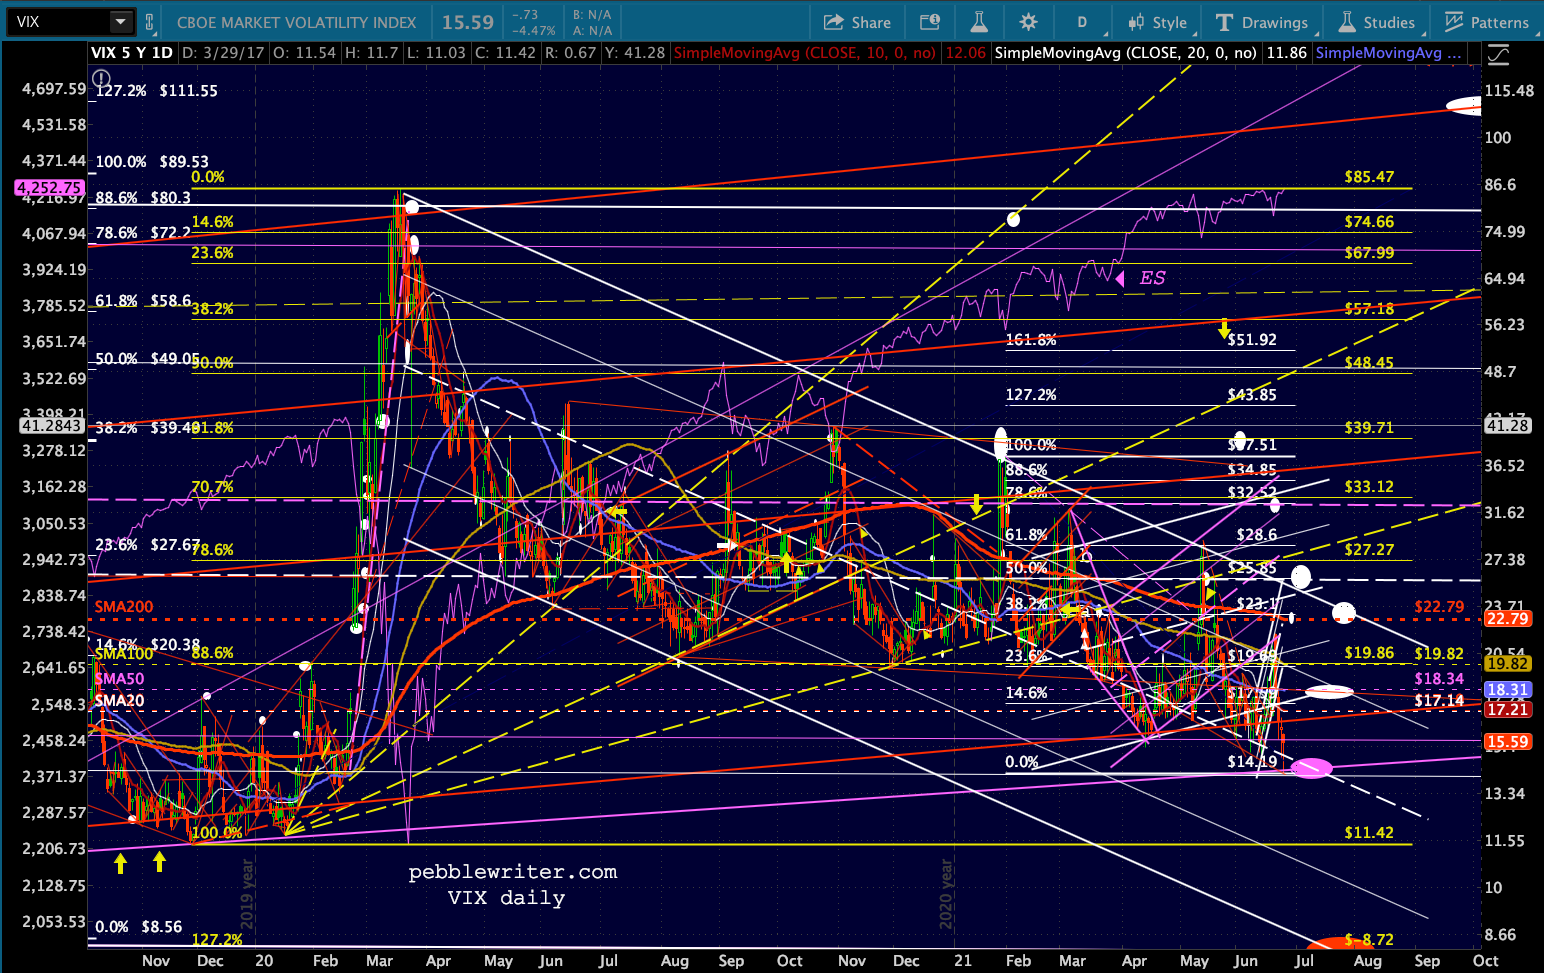 The bigger picture shows the potential to reach the 2017 lows by July 21ish, taking out the 2019 lows and staying within the falling white channel. I’ll post more in a VIX update shortly.
As we mentioned above, RB has pushed above its Feb 2020 highs. At current levels (as reported by EIA) June gas prices are up 2.2% since May and 48% from June 2020.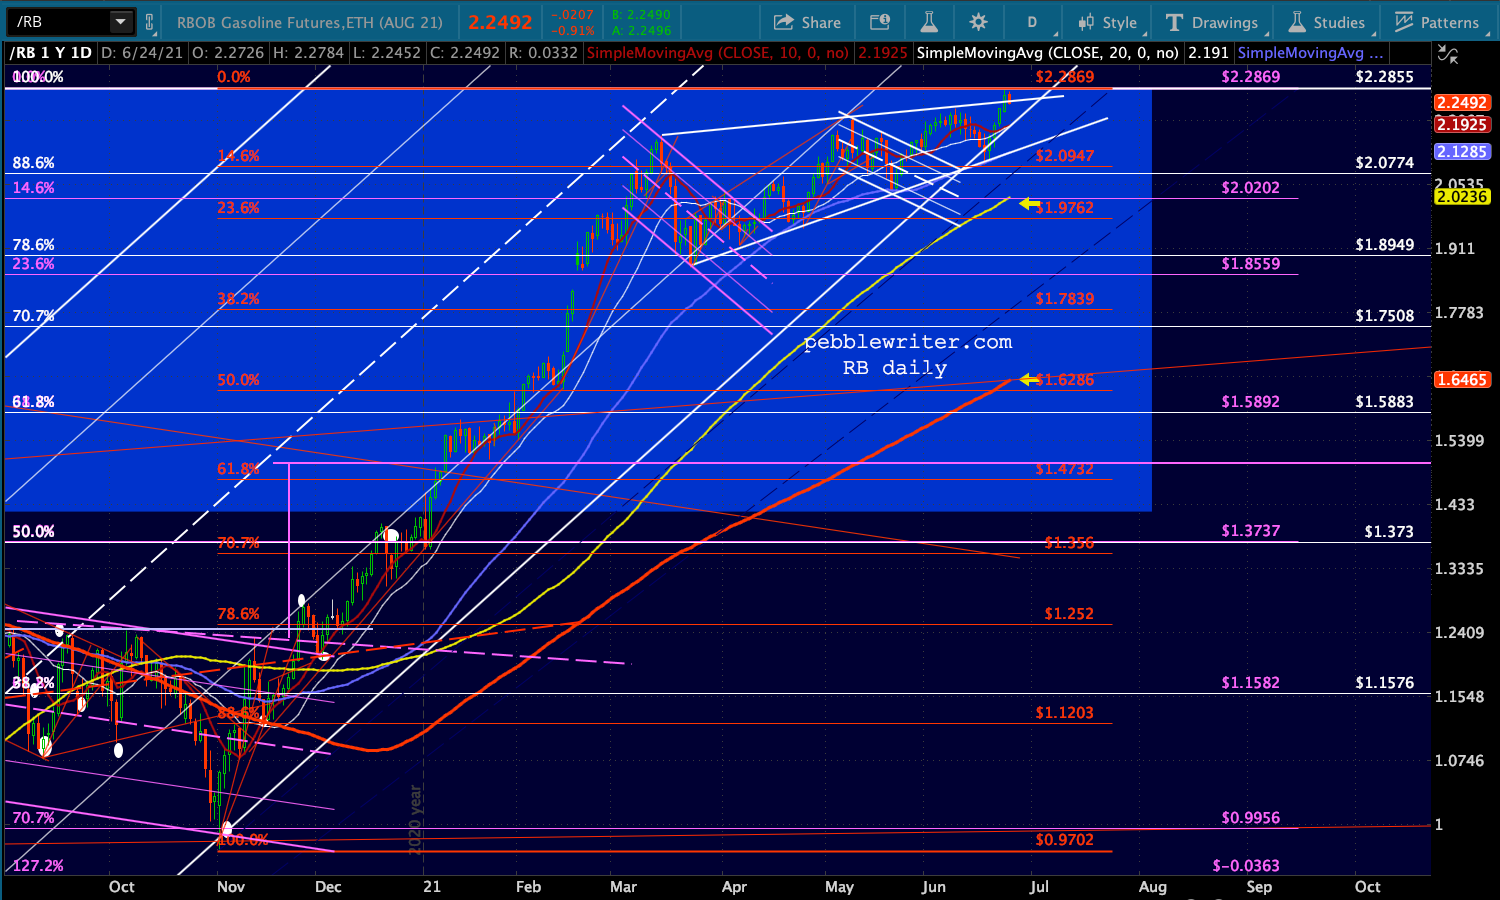 This will mean a slight decrease from May’s 63% YoY increase.
  But, of course, CPI has already deviated sharply from gas’s curve.
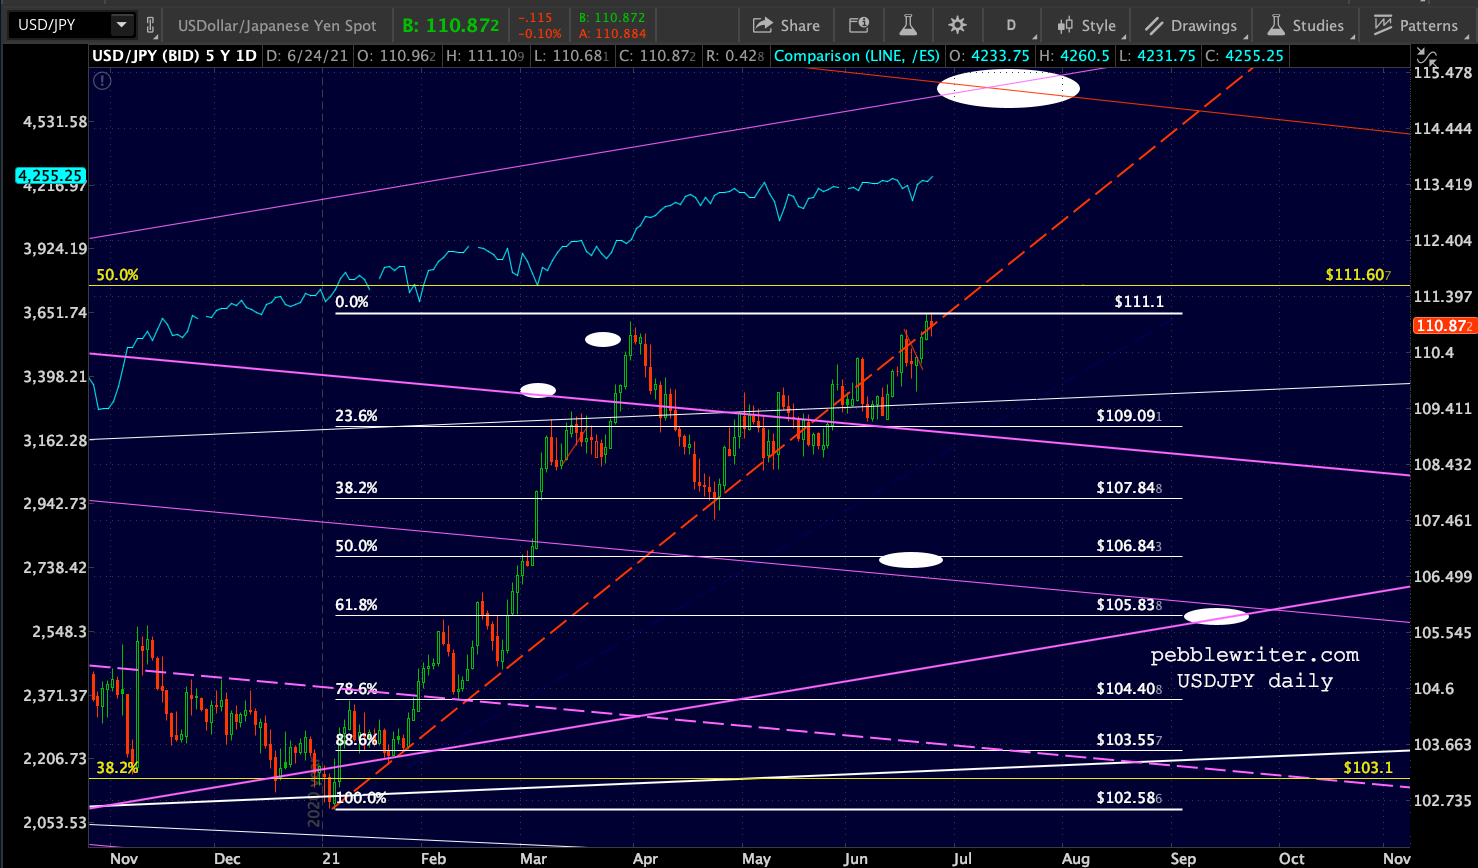
 USDJPY remains well positioned for a correction-preventing breakout – still sitting slightly above its Mar 31 highs.
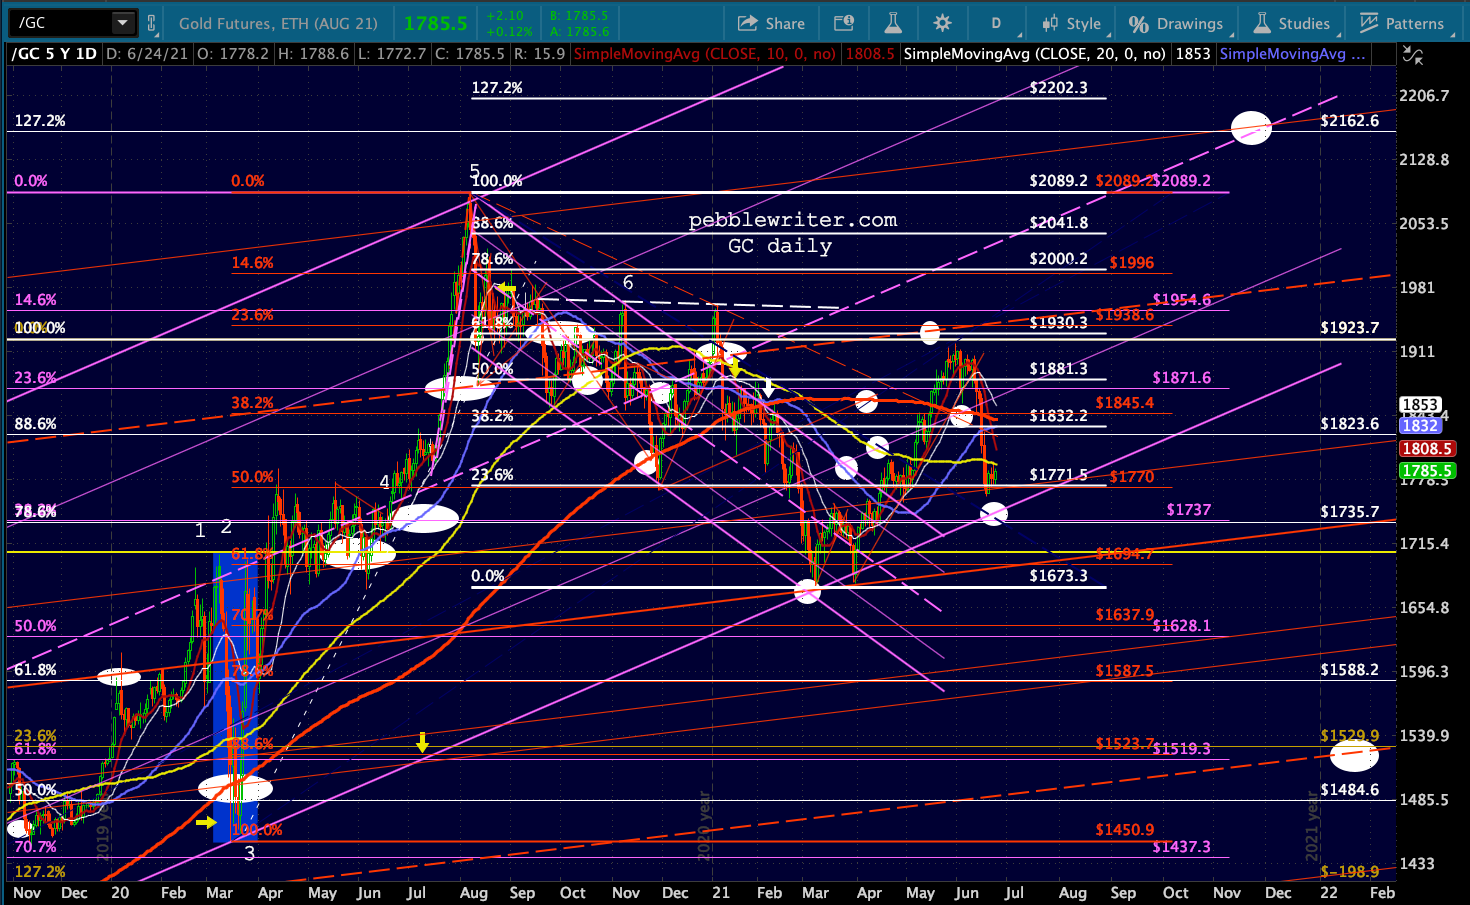
 And, GC and SI remain in a somewhat precarious position – particularly SI.
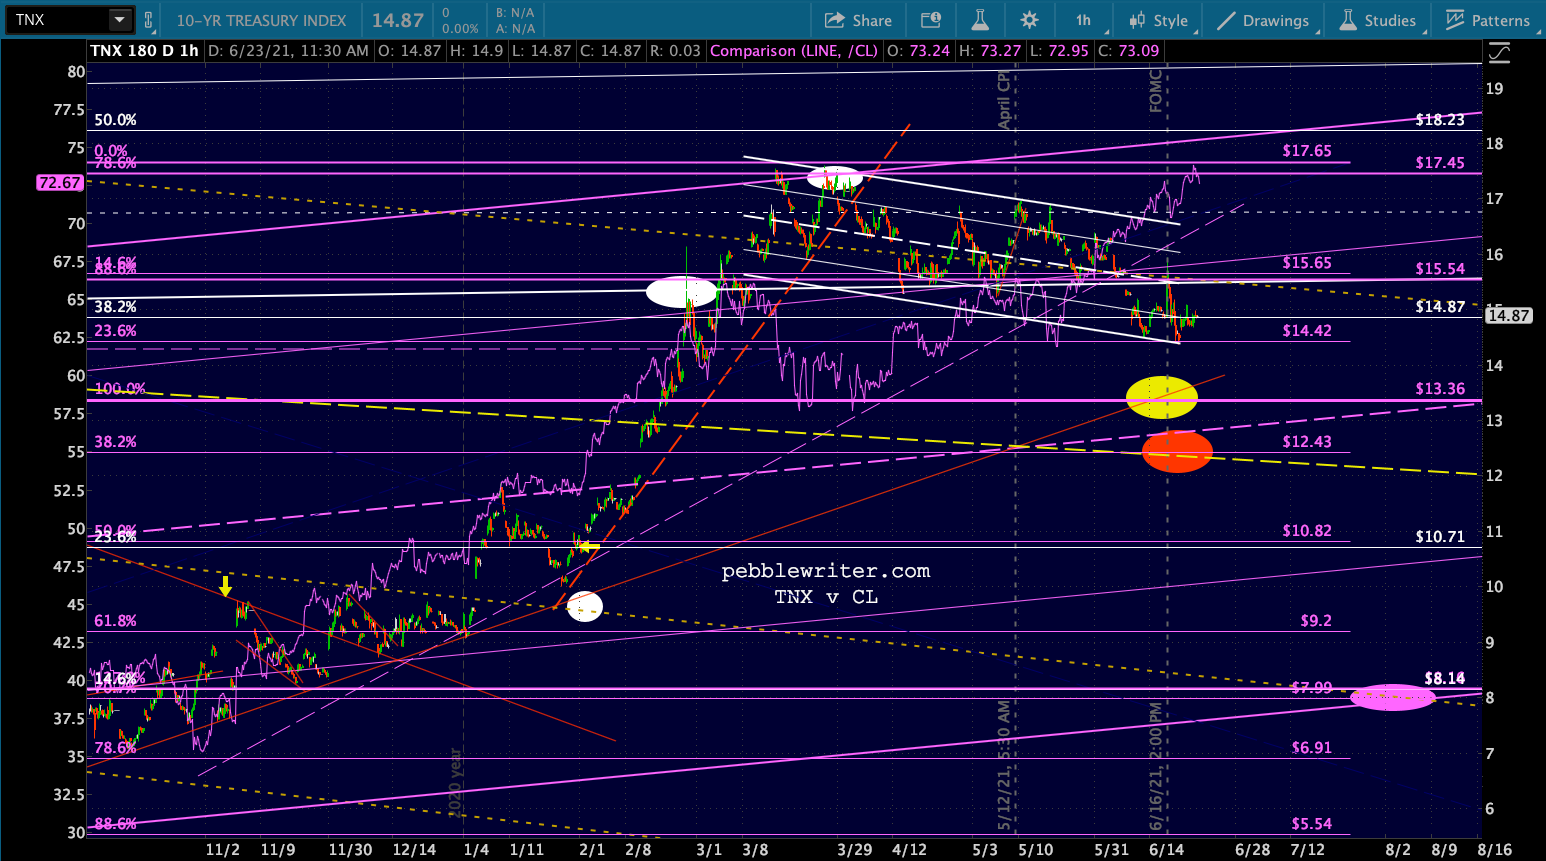
 TNX is flatlining. Perhaps, with CL not breaking down yet, it is content to wait for the red TL to come to it.
 More later…