Tag: forecast

  • Are We There Yet?

    SPX came within 7 points of our downside target yesterday, getting a midday bounce that couldn’t quite reach the 200-DMA.  Futures popped as high as 73 points off the intraday lows, but have since given back about 12 of those points and are perched barely above ES SMA200 at a 28-pt gain in the after-hours.If those gains hold, it still won’t be enough to ramp SPX back above its 200-DMA.  What’s more, USDJPY, RB and CL have further to fall, VIX has additional upside potential and DJIA and COMP remain below their 200-DMAs.  Despite the after-hours euphoria, stocks aren’t out of the woods just yet.

    One economic item which doesn’t usually attract that much attention, but might today: Treasury Budget.  The trend hasn’t been very positive lately as witnessed by the widening gap between outlays and receipts.

    For excellent commentary on the problems this poses, see Jeffrey Gundlach’s interview on CNBC yesterday.  The latest is due out at 2pm.  From Briefing.com:

    Export and import prices are also due out (8:30am.)  These will get extra scrutiny to see what impact tariffs have had on prices so far.  And, Michigan Consumer Sentiment (10am) frequently impacts markets.

    continued for members(more…)

  • Investing for Dummies

    I use scores of chart patterns, Fibonacci grids, technical indicators and proprietary models in my daily attempts to forecast various markets.  Some are fairly complex, multivariate models that involve a half-dozen inputs.  Others are quite simple.

    One of my favorite simple indicators is the well-known 10-day/20-day moving average cross. It maintains that when the SMA10 crosses below the SMA20, it’s generally bearish. When it crosses back above, it’s bullish.

    Of course, in a heavily “managed” market such as the one I’ve been posting about for the past 7 1/2 years, the crosses are occasionally head fakes.  The cross is well-known and a component of many algorithms.  So, it’s not unusual for markets to reverse rather soon after such a cross.  Sometimes, markets even reverse just before a likely cross in order to avoid one.

    The yellow arrows below mark the various bearish crosses so far in 2018.  The thin red line is the SMA10 and the white line is the SMA20.  Other moving averages are the 50 (purple), 100 (yellow) and 200 (thick red.)

    Only a couple 10/20 crosses were followed by significant sell-offs: Feb 6 and Mar 22.  The others produced either moderate or modest declines (i.e. head fakes — the purple arrows) or near misses (the white arrows.)  I mention it this morning because we’re experiencing another 10/20 cross in the pre-market.

    There is much bearish commentary out there.  VIX just broke out of a 8-month trend, tagging our next upside target yesterday.  SPX and ES have both tested the critical support we identified last week [see: The 10Y Breaks Out.]  And, the usual suspects involved in a rescue operation are, so far at least, MIA.

    Will this be another head fake/near miss — or the real thing?

    continued for members

    My best guess continues to be that if 2878.50 (SPX 2872.87) doesn’t hold, we’ll see the white channel get fleshed out.  If the white channel doesn’t hold, it opens up the SMA200 and, ultimately, the 2.24 at ES 2728.79 (SPX 2702.78.)

    SPX wouldn’t flesh out its white channel until reaching 2800 – the white .786 Fib.  Again, if the white channel fails, we’re looking at the SMA200 at 2765 and the 2.24 at 2703.62.

    CL and RB are getting a little bump from Hurricane Michael and the usual MENA-based speculation.

    Note that RB, in particular, has clung to a smaller rising channel.  It won’t last.

    USDJPY still looks likely to backtest its SMA100 at 111.19 or .500 at 111.78 — which lends credence to the downside case – at least on an intra-day basis.VIX continues to be the big question mark.  It has clearly broken out of the falling white channel.  If given free rein, it still has plenty of upside potential with 24.20 looking very reachable. I’ll be out all day today.  More later this evening or in the morning.

    GLTA.

    (more…)

  • FOMC: What Elephant?

    Over the last 20 years, we’ve seen two yield curve (2s10s) inversions: essentially all of 2000 and Dec 2005-May 2007.  The inversions themselves posed no issues for equity markets.  It was the dramatic unwinding of those inversions that produced crashes.Eight months ago, we almost had another.  2s10s had fallen to a trend line connecting those two previous curve lows. Instead of bouncing, however, 2s10s continued falling — reaching a low of .18 on Aug 27.

    Unfortunately, the optics of this approach to an inversion are troublesome.  It is commonly believed that inversions presage recessions.  So, the brain trust in the Eccles Building has a little tightrope walking to do.

    They need to increase the short end of the curve to stave off (understated) inflation and build some cushion for the next financial calamity.  But, to avoid an inversion, they must scale back their intervention in the 10Y — at least enough so it can keep pace with the rapidly rising 2Y.

    Eagle-eyed observers might note that both recently out above the trend line connecting previous highs. Not so coincidentally, this occurred as the above-referenced trend line connecting the 2s10s lows was breached and equities began their Jan-Feb swoon.Can the Fed keep the plates spinning a little longer?  Without question.  Especially if Powell is successful in convincing investors algos that the economy is strong but there is no wage pressure and inflation poses no real threat.

    Should that narrative fail, however, the spectre of higher rates alongside soaring debt levels might finally awaken equity and bond investors to the elephant in the room.

     *  *  *

    So far, the damage resulting from Friday’s channel breakdown has been contained to the August highs.  But, still ahead, EIA inventory reports and the FOMC statement and press conference.

    continued for members(more…)

  • The Devil’s Playground

    Catch this news flash yesterday?  Trump, ironically at a White House meeting with the National Council for the American Worker:

    You’re gonna see on China, today, right after close of business…we’ll be announcing something, uh, and it will be a lot of money coming into the coffers of the United States of America, a lot of money coming in, but you’ll be seeing what we’re doing uh right after close of business today, the markets closing.  Thank you.

    Note the repeated emphasis on the market’s closing. Was there something about the announcement that required a delay?  To paraphrase…the after-hours markets are the devil’s playground.

    The S&P 500 plunged 22 points from Friday’s highs, then recovered just in time for a well-engineered close: down only 16 points on the day.  More importantly, it closed at 2888.80 – just above yesterday’s 10-DMA at 2888.70 (2888.80 today.)

    After the close, of course, the futures tanked – shedding 14 points before being saved by the usual suspects: VIX, WTI and USDJPY.  Trump’s announcement didn’t come right after the close.  In fact, it didn’t come until after 3 1/2 hours had passed.  Why?That’s how long it took to get the safety net properly positioned.  USDJPY, which had just backtested its IH&S neckline, spiked sharply moments after the announcement.

    VIX, which had just backtested the broken white channel, suddenly reversed and headed lower.

    The overnight action was impressive, with the usual timely plunges when ES faced important tests. How much more of a smackdown will resurrect stocks’ rally?Whether the rebound will hold or not is anyone’s guess.  China has already announced retaliation – which Trump insisted will lead to a $267 billion expansion of US tariffs.

    Futures are under pressure again, and interest rates are threatening to break out on the obvious (to everyone except Trump, apparently) inflation threat that tariffs pose.  Might investors care that the trade wars could, as Jack Ma theorized, last for 20 years?


    continued for members(more…)

  • It’s a Wonderful Market

    SPX and ES had no trouble reaching our initial downside targets — a backtest of their January highs.  We wondered, however, whether the SMA20s, loitering just below, might come into play.

    Sure enough, ES tagged its SMA20 with ease.  But, emini traders strongly resisted a drop through the SMA20 – bad mojo, don’t you know.

    So, SPX only reached 2867.29, just shy of the SMA20 at 2866.27. And, faster than you can shout “help me Clarence!” SPX bounced the 16 points we anticipated, just like it did on Wednesday.

    It was a near miss..or, was it?  As we discussed on Tuesday…

    One little trick we often see on days when it’s difficult to convince the machines to sell/short down to an obvious bounce point such as the SMA10 is to drive the price merely to where the SMA10 will be tomorrow.  The SMA10 will likely increase by another 5 points tomorrow, so getting within 2-3 points is potentially “good enough.”

    As luck the algos would have it, today’s SMA20 came in at…wait for it…2866.27.  January highs and SMA20 were both tagged.  So, all is well, right?  Not so fast.  Futures are currently off 10 points, banks are tanking, oil and gas are slipping, FB is scurrying toward the basement and TSLA has tumbled 15% since Tuesday’s short call.

    In the distance, sirens.  A mob of nervous investors crowds the door.  Might the Building & Loan actually be in trouble?

    Thanks to overeager algos, the S&P 500 has thus far ignored the threats of tariffs, political turmoil, emerging market meltdowns, rising interest rates and historically high multiples. None of that matters as long as corporations can borrow cheap and repurchase their own shares, VIX can be hammered when necessary, the dollar continues rising and oil/gas prices don’t crash.

    If any of those support mechanisms falters, however…  Well, we’ve seen what can happen.  Keep an eye on 2867.29.

    continued for members(more…)

  • How Not to Manipulate Stock Prices

    Sometimes you just can’t catch a break.  TSLA shares rose from 22 in 2012 to 387 in 2017 — helping drive Musk’s net worth to well over $20 billion.  But, the shares have since formed a triple top, failing to top 390 and coming perilously close to breaking down.

    This isn’t the first time Musk has faced such a challenge.  The stock spent three years trying to crack 290 – the red trend line below.

    We’ve documented past interventions — which have, by and large, been successful.  Musk’s well-publicized $25 million open market purchase (the white arrow) on June 12-13, for instance, saw the stock gap past the .618 Fib level and a trend line connecting recent highs.

    It was a nice gesture and helped divert attention from the mass layoffs announced the day before.  But, it didn’t take long for investors to realize that while $25 million is a lot of money to most people, it represented only 1% of Musk’s net worth.  And, it increased his holdings of the common stock by a pittance (0.2%.)

    It’s pretty obvious why Musk did it.  After breaking above 290 in April 2017, the stock had fallen back below it in March 2018.  The 200-DMA, rising white channel, and purple trend line all broke down in the process.

    After a miraculous, tweet-aided recovery, Musk got the stock back above the red trend line.  But, he needed it above 390.  It was not meant to be.  Too many missteps, too many worrisome headlines.  The best it could manage was a backtest of the broken white channel and the .886 retracement of its drop from 389 to 244.

    The stock slipped back below the red TL and 200-DMA, eventually bouncing off 290 yet again in late-July on news of a major new factory to be built in Europe.  The company’s earnings call a few days later featured a well-behaved Musk, a revenue (obviously not income) beat, and a promise not to float additional additional shares.

    Musk: We do not — we will not be raising any equity at any point, at least that’s — I have no expectation of doing so, do not plan to do so … And we certainly could raise money, but I think we don’t need to and we — yeah, I think, it’s better to — it is better discipline not to.

    Again, the stock gapped higher — back above the 200-DMA and the yellow trend line.  But, the naysayers weren’t having any of it.

    Despite having produced the promised number of Model 3’s, the company was dogged by reports of quality issues and was losing money on every sale — even though these were the higher end models with potentially larger profit margins.

    This was apparently the point when desperation set in.  As we discussed at the time [see: Is the Pressure Getting to Elon Musk?] it was fairly obvious to any competent chartist that Musk’s going-private tweet — like all the others — was designed to get the stock over the latest hump.

    It didn’t take long for Tesla watchers to question the deal.  The financing was supposedly secured, but no one stepped forward.  The board seemed genuinely alarmed.  Shorts launched lawsuits.  And, the SEC announced an inquiry.

    The latest rally ran out of steam at 387 – just shy of the September 2017 highs.  The stock tumbled back to the red trend line yet again.  It bounced, but that was before Friday night’s (11pm Friday night, following Thursday’s decision) admission that the going-private transaction was dead in the water.  As of this morning, the stock is heading back toward 290.

    Despite my cynicism, I’m rooting for Elon and Tesla.  We obviously need alternatives to carbon-based transportation for many reasons.  But, the stock is at these lofty levels based on the (aging) premise that it’ll soon be self-funding and turn a profit.

    The shorts are right to question this premise.  But, anyone who shorts at these levels, before the stock breaks down below the tangle of support at 290ish is ignoring the obvious — this is a CEO who will do whatever it takes to prop up his stock.

    TSLA might ultimately come crashing down.  But, I would absolutely wait until the purple trend line and horizontal support break down before jumping on board.

    Now, on to the rest of the market.

    continued for members… (more…)

  • Currency Complications

    USDJPY reached our target at the SMA100/SMA200 overnight, at least temporarily bringing the pair back below the top of the falling white channel from which it broke out on July 10.  Readers will recall that breakout was instrumental in helping SPX break above its faux IH&S neckline 66 points ago.

    A USDJPY rebound here is all stocks might need to make new highs.  EURUSD, which is backtesting after a major channel breakdown, would certainly support a strengthening of the USD……as would DXY — which is the latest victim of “unpresidented” tweets.

    As central bankers have recently discovered, however, there are complications from continued dollar strength which would suggest that it will take a break here.  Will they heed those warnings, or are new all-time highs in equity markets more important?

    continued for members(more…)

  • Engineering AAPL’s Breakout

    The big news yesterday was AAPL’s market cap reaching $1 trillion.  For chartists, however, the big story was the breakout shown below.

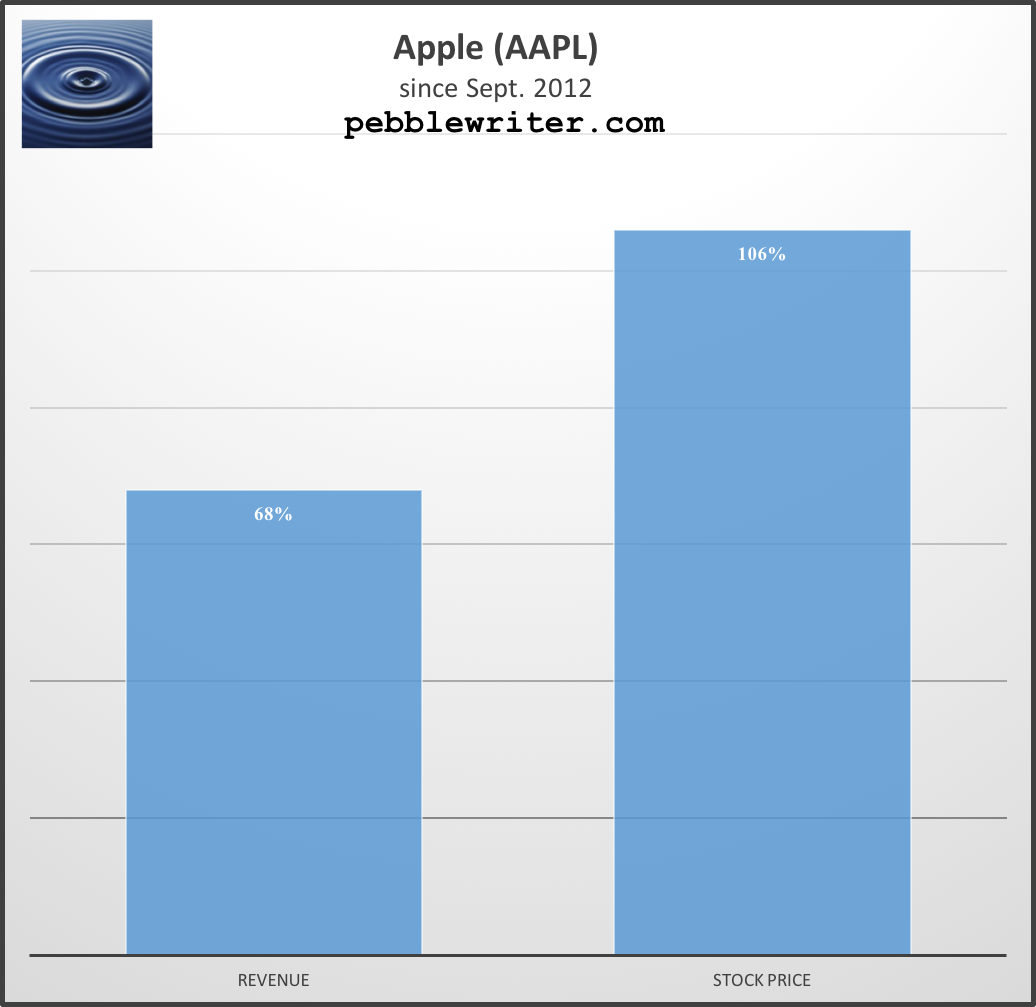
    It’s hard to overstate the importance of this move.  Just a few days ago, the stock had broken below a trend line dating back to April 27 and was retreating from its 2.24 Fibonacci extension.  From a charting standpoint, it was in trouble.Revenues have grown 68% since that first market peak in 2012 — about 9.04% on an annually compounded basis (based on estimates of $263 billion for FY2018.)  The stock price, however, has grown 106%, a compounded annual rate of 12.9%.

    Those who follow AAPL know it has been the poster child for stock buybacks.  The board has approved a total of $310 billion since Apr 2012.  Might this activity account for some of the stock’s success?  Let’s take a closer look.

    $310 billion is a lot of money.  But, consider that the average daily trading volume in AAPL in the 1,600 trading days since the program started was $5.7 billion.  In other words, the entire program comprises about 54 days worth of volume.  Fifty-four out of 1,600 — could it make much difference?When we compare the announcements to stock prices, we can see that most were beneficial.  When we compare them to chart patterns, though, the extent of the benefit is startling.  As they say, timing is everything.

    $10B Announcement (2012):  I don’t know what prompted this first announcement, but it came shortly after the stock had broken above a trend line (red, dotted line below) going back to April 2010.  The company also announced outstanding earnings and the resumption of dividend payments, the first time since 1995.$50B Announcement (2013):  This one is a little more obvious.  Not only had the red trend line given way, but the white channel which had guided prices higher for the past decade had broken down.
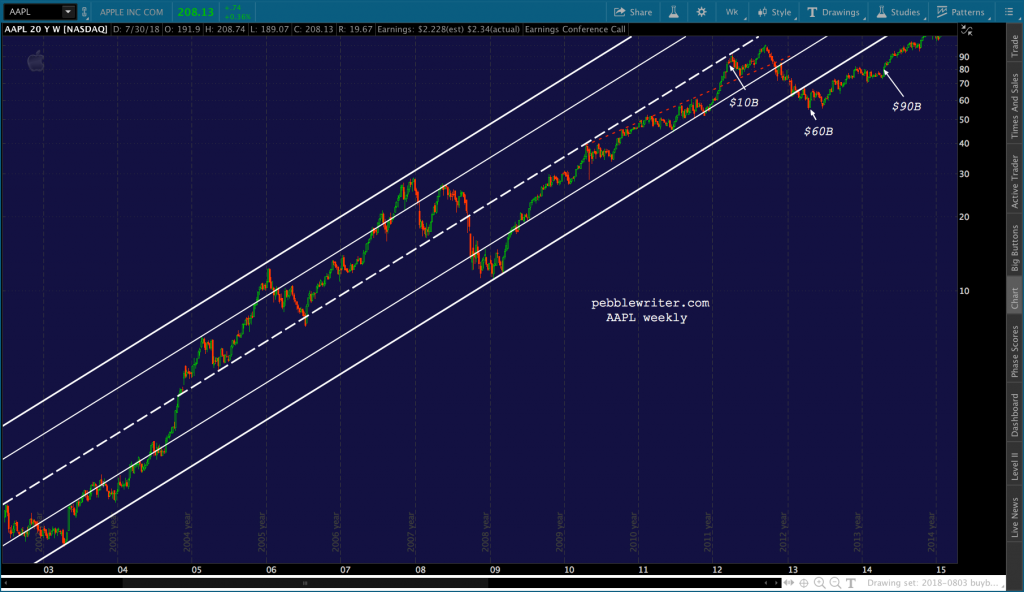
    As I warned in November 2012 [Update on AAPL] and again in January 2013 [AAPL: Flirting with Disaster], AAPL had completed a Head & Shoulders pattern that targeted the June 2011 lows. The losses from the Sep 2012 highs would have exceeded 50%.

    The massive $50B addition to the share repurchase plan held AAPL’s losses to a “mere” 45%.  Unbeknownst to us at the time, it also established the gently rising purple channel AAPL just broke out of.$30B Announcement (2014): In November 2013, Carl Icahn — who had accumulated $2.6B since August — filed a shareholder proposal to encourage Apple to distribute $150B to shareholders.

    In addition to Icahn breathing down its neck, Apple’s stock was having a tough time.  Keep in mind the rising white channel was still broken down.  In addition, a rising wedge (in yellow below) had formed and broken down.

    Last, the stock had reversed just shy of its .618 Fib and been unable to rise above a Fibonacci fan line (yellow, dashed) from its 2012 highs.  Increasing the share repurchase plan by another $30B seemed to help.$50B Announcement (2015):  Fortunately for Apple, someone had convinced them to pay attention to Fibonacci patterns along the way.  Unfortunately for Apple, the action they took in April 2015, when AAPL reached its 1.618 extension and the top of the small, white channel from early 2013 wasn’t enough to stave off the effects of the S&P 500 having reached critical resistance [more on this later.]

    Despite the announcement on April 27, AAPL topped out the next day.  It struggled to stay aloft until late July, but finally succumbed, tumbling 31.6% (compared to SPX’s 12.5%) by the time the broader market bottomed out on August 24.

    $35B Announcement (2016): The 2016 expansion was purely defensive.  Having held horizontal support when the market bottomed out in February, AAPL had failed in its attempt to hold the purple channel midline or break out of the trend line (red) connecting its recent highs.  It was also dipping perilously close to its September 2012 highs (100.72.)

    The $35B addition wasn’t enough.  The company reported its first quarter-over-quarter revenue drop since 2003 and its first year-over-year drop in iPhone sales ever.  The stock gapped down 8%, wiping out nearly $50 billion in market cap in a day.  It would take three months to recover.

    $35B announcement (2017): A rising tide lifts all boats.  So it was in April 2017 when SPX has broken out past important resistance and AAPL needed just enough to hold its 1.272 Fib and purple channel .786 lines.  This was a tweak, and an earnings beat and upbeat guidance — along with the iPhone X launch — helped the stock hold its own when it revisited this level two months later.$100B announcement (2018):  Apple has apprently spent every dime of the $210B previously announced.  That’s six years of timely support, lucky bounces, fortunate developments, $100 million paydays.  Could you walk away from it?  Neither could Tim Cook.

    The $100B just announced couldn’t have come at a better time.  The stock has been struggling with the purple 1.618 extension at 162.39.  It failed to punch through in August 2017, made it through in October 2017, plunged back below it in February 2018, screamed above it a week later, and tumbled back to it on Apr 24.

    Had the biggest share repurchase plan expansion plan ever not been announced 5 days later, the stock likely would have dropped through the 1.618 and the bottom of the rising red channel.  But, we’ll never know.Clearly, it was enough to create a bounce off of those, push through the purple 2.24 extension, and break out of the rising purple channel on yesterday’s Q3 earnings report.  As “luck” would have it, AAPL managed to close 0.53 above the purple 2.618 extension today.

    Effects on the Overall Market

    The AAPL chart below shows SPX’s key Fibonacci levels as they have played out since 2012.   AAPL’s announcements line up quite well with key breakouts and backtests.

    • SPX’s break out past its .786 Fib which marked the 2011 highs (Mar 13 vs Mar 19, 2012)
    • SPX’s break out past its 2007 highs at 1576 (April 23, 2013)
    • SPX’s backtest of its 1.272 extension at 1823 (Apr 24 vs Apr 13, 2014)
    • SPX’s attempt at its 1.618 extension (topped May 20 vs AAPL’s Apr 27, 2015)
    • SPX’s break above the trend line from 2015 highs (Apr 26, 2016)
    • SPX’s break out past a smaller pattern 1.618 (Apr 24 vs May 1, 2017)
    • SPX’s recovery after dipping below its SMA200 (7th time was a charm – May 3 vs May 1)

    The same info from SPX’s point of view:

    Since investors (algos) have come to rely on Apple’s buyback announcements every April, we may as well put these on our calendar.

    In Conclusion

    It seems clear to me that the timing of Apple’s buyback announcements played an important role in the stock reaching its recent highs.  If the company published the actual transactions, I suspect we would find that they were instrumental in overcoming resistance and holding support.

    From an earnings standpoint, this sort of financial engineering is clearly beneficial.  Borrowing money to buy back shares increases EPS and shifts dividend expense (non-deductible) to interest expense (deductible.)

    Is it a good thing that AAPL has managed to break out and achieve a $1 trillion valuation?  I doubt there are many shareholders who would complain.  Employees who own stock or whose employment prospects are enhanced by Apple’s success are probably happy, too.  So, what’s the problem?

    In a Harvard Business Review article Profits Without Prosperity, William Lazonick makes a pretty good argument that buybacks represent stock manipulation.  By driving prices artificially higher, corporate executives increase the value of their stock awards and options — about 83% of their compensation.

    He further argues that funds going toward repurchases could be better spent on innovation, employee (the other 99%) compensation, and productivity improvements.  Although I can find no fault with Mr. Lazonick’s conclusions, I’m a chartist – not an ethicist.

    My goal is to accurately forecast price movements.  So, when I consider the effects of Apple’s repurchase program, I think about price manipulation and market integrity.  Equities are subject to substantial price manipulation from many sources, exacerbated by the fact that only 10% of trading volume is conducted by fundamental, discretionary traders.

    As the largest component of the stock market (4.25% of the S&P 500) and the largest component of the FAANG stocks — which contributed over 100% of the S&P 500’s gains during the first half of 2018 — AAPL will continue to exert a great deal of influence.

    Of course, influence works in both directions.  Some feel that Apple has reached a plateau in terms of innovation.  At some point, a slightly different screen size and slightly faster processing speed might not produce an increase in sales.

    And, competitors certainly haven’t conceded the race for market share.  Since buybacks were first announced in 2012, Apple’s share of smartphone sales have actually dropped from 23% to 12.1%. I have owned Apple products ever since my first Titanium Powerbook in 2001.  I enjoyed the “oohs and aahs” it drew from passersby.  My family uses Mac computers and iPhones exclusively.  And, I can’t imagine ever leaving the Apple environment.

    But, I only recently upgraded from my iPhone 6 (not waterproof, as it turns out!) out of necessity.  I could have lived with it for another year or two, no problem.  I’ve owned the laptop and Mac Pro sitting on my desk since 2013 and see no need to upgrade.  Of course, I could be an outlier.

    But, Apple reported Wednesday that iPhone sales increased just 1% year-over-year.  The average price of an iPhone increased substantially, from $606 to $724. But, with real retail sales and wage growth stagnating lately, I question whether a 20% increase is sustainable.

    Bottom line, Apple’s share repurchase plan is a force to be reckoned with.  It has helped propel the stock to historic levels — and, beyond.  Now, all Apple has to do is deliver.


    Related posts:

    Update on AAPL: Nov 27, 2012
    AAPL: Flirting with Disaster
    AAPL: Is it Safe?
    Update on AAPL: Jul 31, 2013
    Update on AAPL: Aug 19, 2013
    Update on AAPL: Dec 23, 2013
    How Exposed is AAPL?
    AAPL: Still Tasty?



  • Facebook’s Faceplant

    $20 billion here, $20 billion there.  Pretty soon you’re talking real money.

    Maybe Zuck should have accelerated his sales a bit more.

    Facebook’s disastrous conference call and outlook has seen the stock plummet 25% from its earlier highs.Note that this brings FB back below:

    (1) the trend line which has buoyed it since April 4;
    (2) the neckline of the H&S Pattern it completed in March; and,
    (3) its 200-day moving average

    If this all sounds familiar, it should.  In March [see: Facebook Flops] FB fell below its SMA200, completed a H&S Pattern targeting 140, and experienced a death cross — all within the span of 3 weeks.We noted at the time that the outcome was important, as previous stumbles of this sort were strongly correlated with market corrections (shaded areas below.)  Three months ago, on April 25 [see: More Than One Way to Skin a Cat], Facebook’s Q1 earnings came out, but barely moved the stock.  A few minutes later, however, after a $9 billion stock buyback plan was announced, the stock bottomed, recovered back above all that overhead resistance, and went on to new all-time highs.

    This was a repeat, of course, of the Nov 2016 episode where FB plunged below its SMA200, completed a H&S Pattern, and experienced a death cross.

    Of course, the H&S Pattern never played out, and the Trump Dump was snatched from the cradle and rebranded the Trump Rally [see: Why the Trump Rally is a Fraud.] But, that’s another story.

    That particular near-disaster was averted with a $6 billion stock buyback plan [are we seeing a pattern here?] $4 billion of which was still unused at the time the $9 billion plan was announced 17 months later.The neckline is currently around 175 — right on top of the .618 retracement at 175.61.  The SMA200 is at 181.53.  With the stock lingering below each of those in the after-hours, one can only wonder how many “undervalued” shares will be reacquired by tomorrow’s open.  Odds are it’ll be however many it takes to get the stock back to 182.

    Or…maybe it’s time to announce a whole new buyback.

  • Netflix: Watch It

    A quick glance at NFLX’s daily chart shows it has significant additional downside potential.

    The most obvious downside target is the 100-DMA at 338.73.  But, the 200-DMA is approaching the white channel midline and should cross it at around 298-300 on or about August 6.  It makes for a nice downside target if the SMA100 doesn’t hold.

    Should the SMA200 and channel midline fail, the bottom of the white channel is currently around 200 and (obviously) rising.

    As an aside… I’ve been mystified as to the value ascribed to the company based on its ability to produce original content.  What about the risk?  Anyone who has worked in film or television can tell you that most productions don’t turn a profit.
    I don’t want to get into production. There are passionate, talented filmmakers out there and I would pollute the craft.

    Reed Hastings, Inc Magazine: Dec 1, 2005

    Netflix has clearly hit some home runs with House of Cards, Stranger Things, etc.  And, theoretically, producing content in-house can lower acquisition cost and diversify revenues.

    But, extrapolating an unending string of popular and profitable productions is just plain silly.  Some would say borrowing $1.8 billion to fund said productions is downright reckless.

    Think New Line, which followed up the hugely successful Lord of the Rings trilogy with the expensive flop The Golden Compass.  Investors would do well to remember that beta works in both directions.

    UPDATE:  July 17

    We’re off to a good start.
