The Inverted Head & Shoulders Pattern (IH&S), as the name implies, is an upside-down traditional Head & Shoulders Pattern. Otherwise, its characteristics are virtually identical. Symmetrical patterns featuring downward-sloping necklines perform best — especially when found at the bottom of a significant decline.
To calculate the nominal target, measure the distance between the head’s low and the neckline directly above it, then add this amount to the point along the neckline at which the right shoulder completes.
The most recent example of a major IH&S pattern occurred between October and December 2011. The market had recently plunged significantly (July – October) and was threatening another leg down.
By late November, SPX had retraced almost exactly 61.8% of its Oct 4 to Oct 22 rise — suggesting a Gartley, Bat or even Crab Pattern was in the works. On December 22, it stood on the brink of a reversal that could send it tumbling at least 130 points.
Instead, prices rose enough to complete the IH&S pattern (busting the harmonic pattern), sending SPX soaring 112 points. It reached its target of 1372 and completed a correlating Butterfly Pattern at 1375 in about two months time.
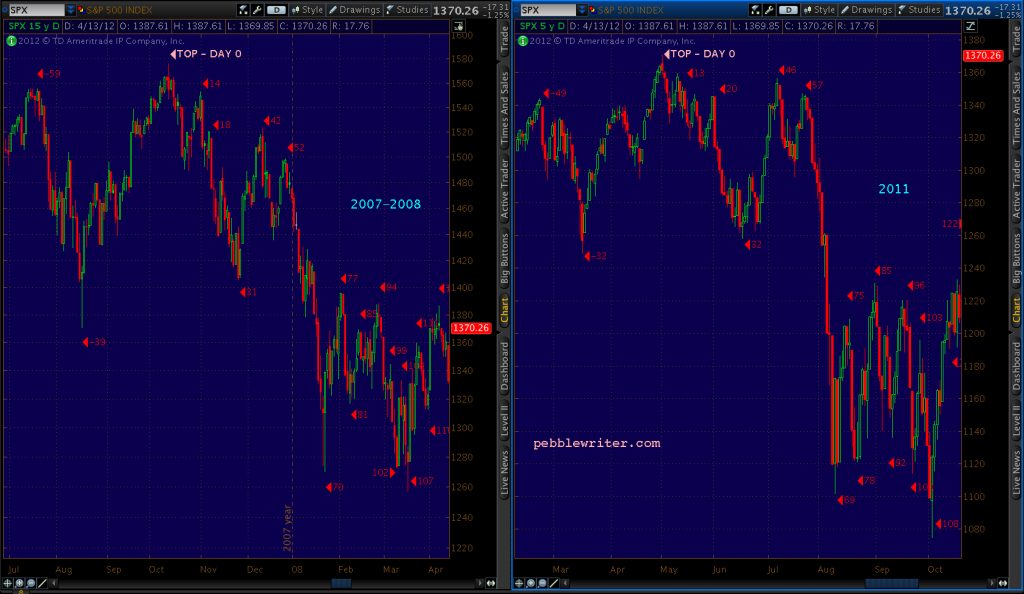
A great example of a busted IH&S pattern occurred just five months earlier. On July 21, 2011, SPX reached 1347 — just 10 points from completing a pattern that would target about 1450 (and fulfill a Crab Pattern at 1440.)
I fully expected the pattern to fail in a repeat of December 2007 — thus confirming the 2011 as 2007 analog that was in the works [see: Ten Lousy Points.]
A US downgrade was in the works (precipitated, in part, by the debt ceiling crisis) and the market was in no condition to soar. Instead, it tumbled 246 points over the next 13 sessions.
IH&S Patterns don’t pay off every time, but the results from successful patterns can be so dramatic that many chartists pay very close attention when they see one forming.


