Not since the summer of 1666, as young Zack Newton sat pondering gravity, has so much attention been paid to a falling apple.
Should we care about AAPL’s deteriorating powers of levitation? The $200/share drop since its September highs, especially on the heels of a new dividend and share buyback program, has been unnerving. But, if you invest based on fundamentals, it’s a solid company selling at 11 times earnings and a 62% 5-year CAGR — which happens to be on sale.
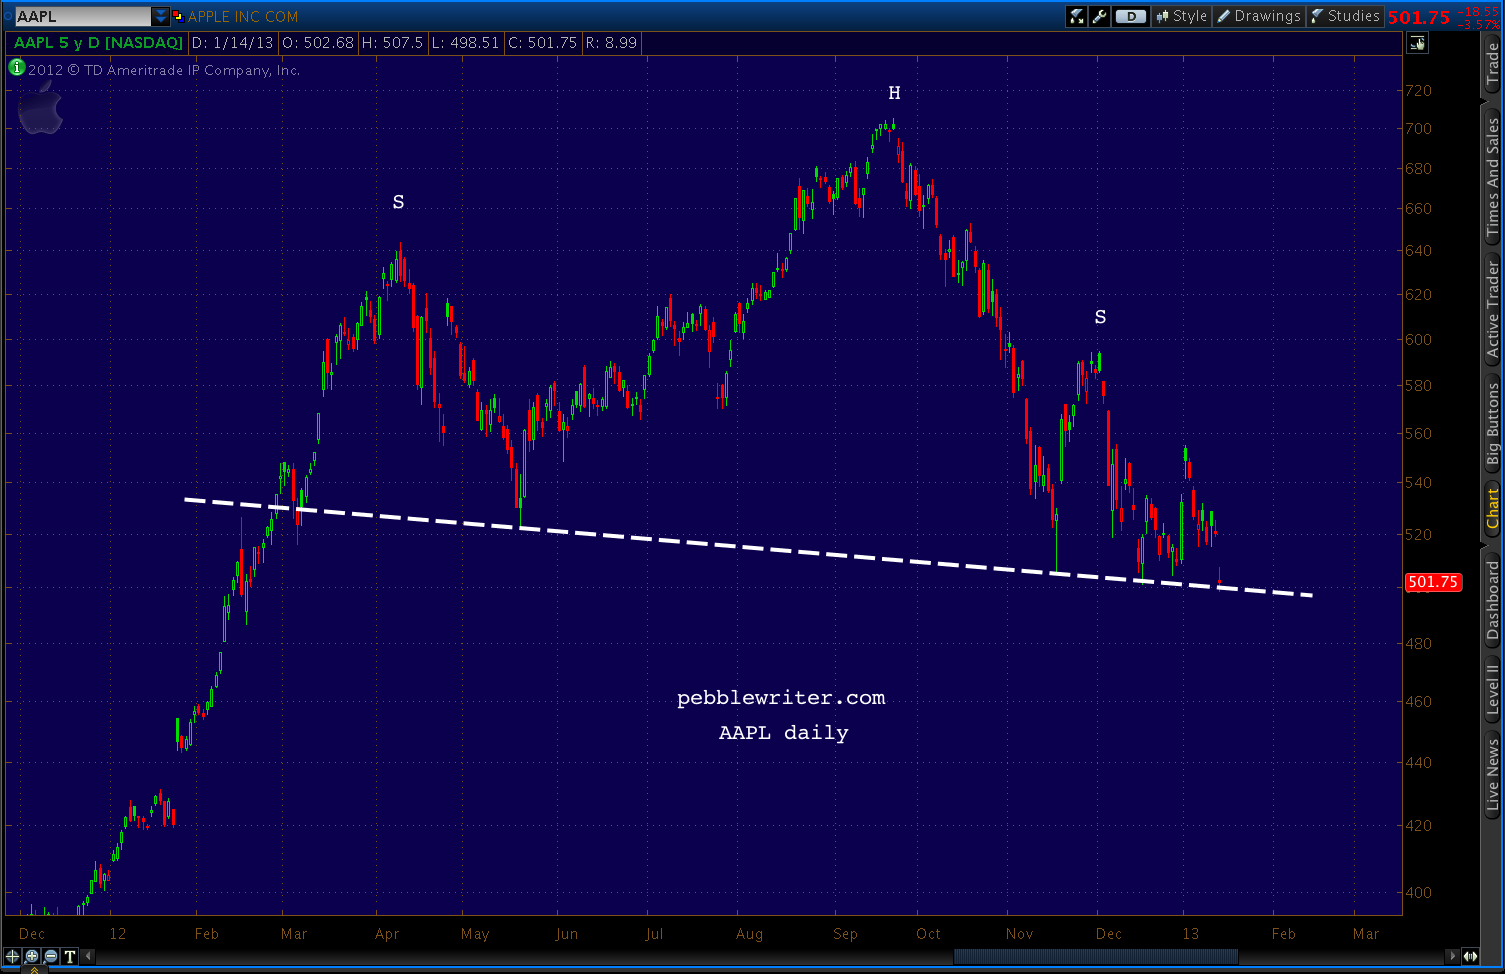
If you pay attention to chart patterns, however, AAPL is flirting with disaster. It’s a mere point or two from completing a Head & Shoulders pattern that targets the low 300’s. [To read about how H&S patterns work, click HERE.]
Even if you don’t give a darn about chart patterns, know that many other investors do. The four tags of the white trend line (the neckline) in the past month are ample proof. So are the many previously completed patterns that weighed on AAPL.
In January 2008, AAPL completed a H&S pattern that saw share prices drop from 200 to 115 in a few short weeks.
 Buyers at 115 were rewarded with a rebound to 190, then punished by a plunge to 78 as the rebound completed a right shoulder in a much larger H&S pattern.
 Not every pattern plays out, of course. Consider the pattern below — a well-formed pattern that targeted much lower prices.
 Instead of a big drop off, AAPL found channel support before much damage was done. Prices rebounded to new highs where they formed a new pattern (in white) which did play out.
 Like any other chart pattern, H&S patterns don’t occur in a vacuum. Channels and harmonics often influence the ultimate outcome.
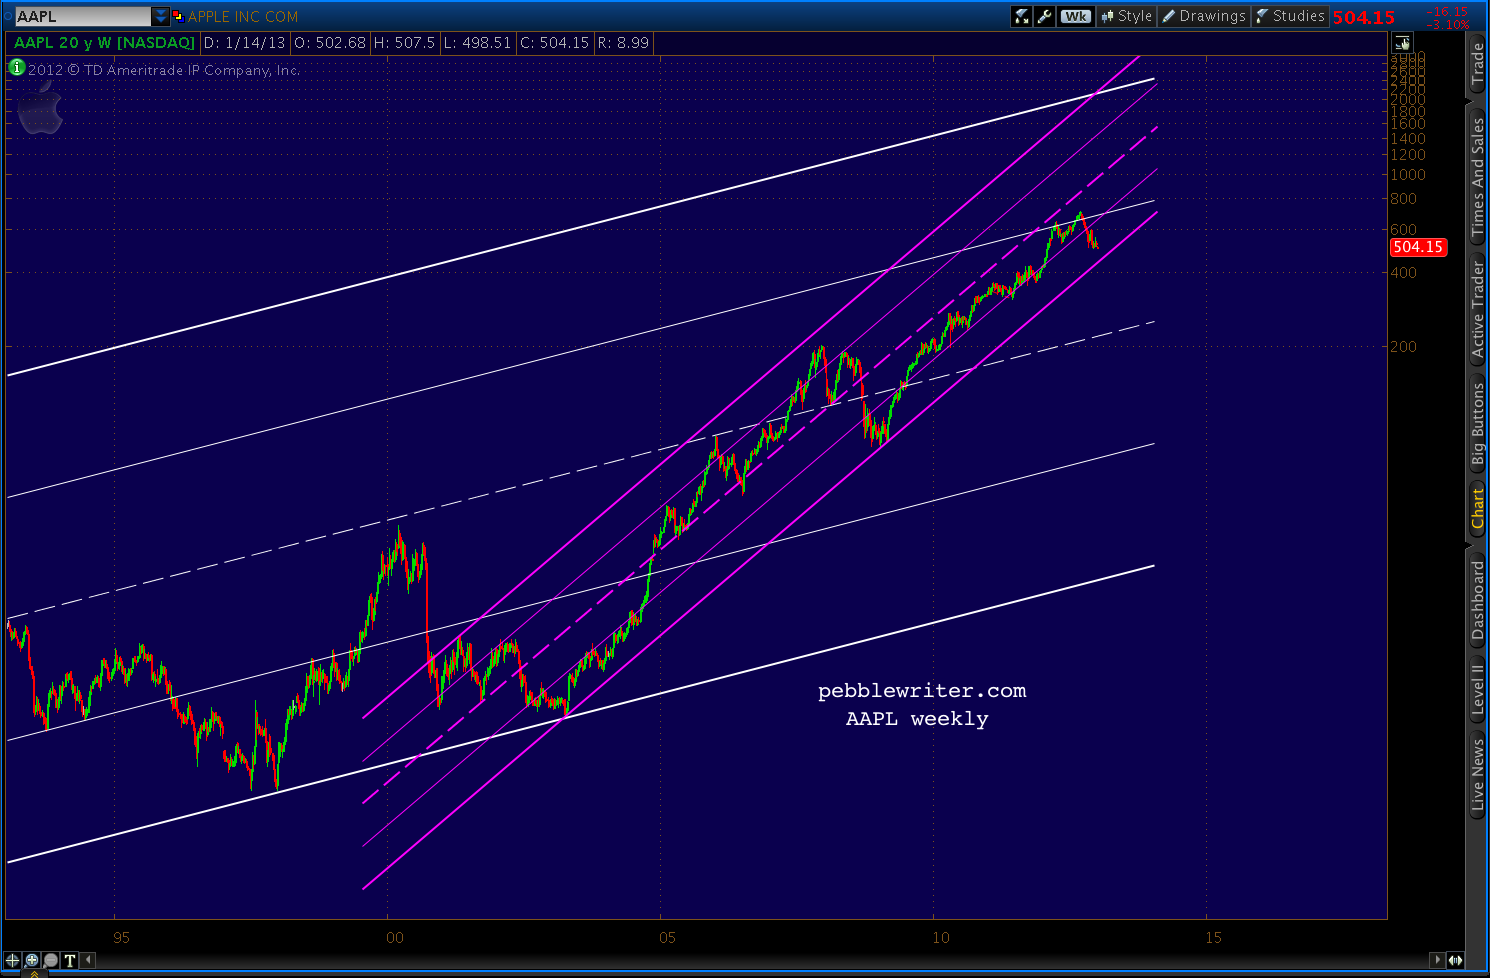
The channel that saved the day in 1995 is still with us, though it most recently offered resistance to higher prices instead of a floor. It’s the white channel in the chart below.
The much smaller, steeply rising purple channel, on the other hand, has kept prices rising — putting AAPL back on track after two significant sell-offs. It’s currently around 445 — within a few points of the Crab Pattern 1.618 extension of the failed mid-November rally.
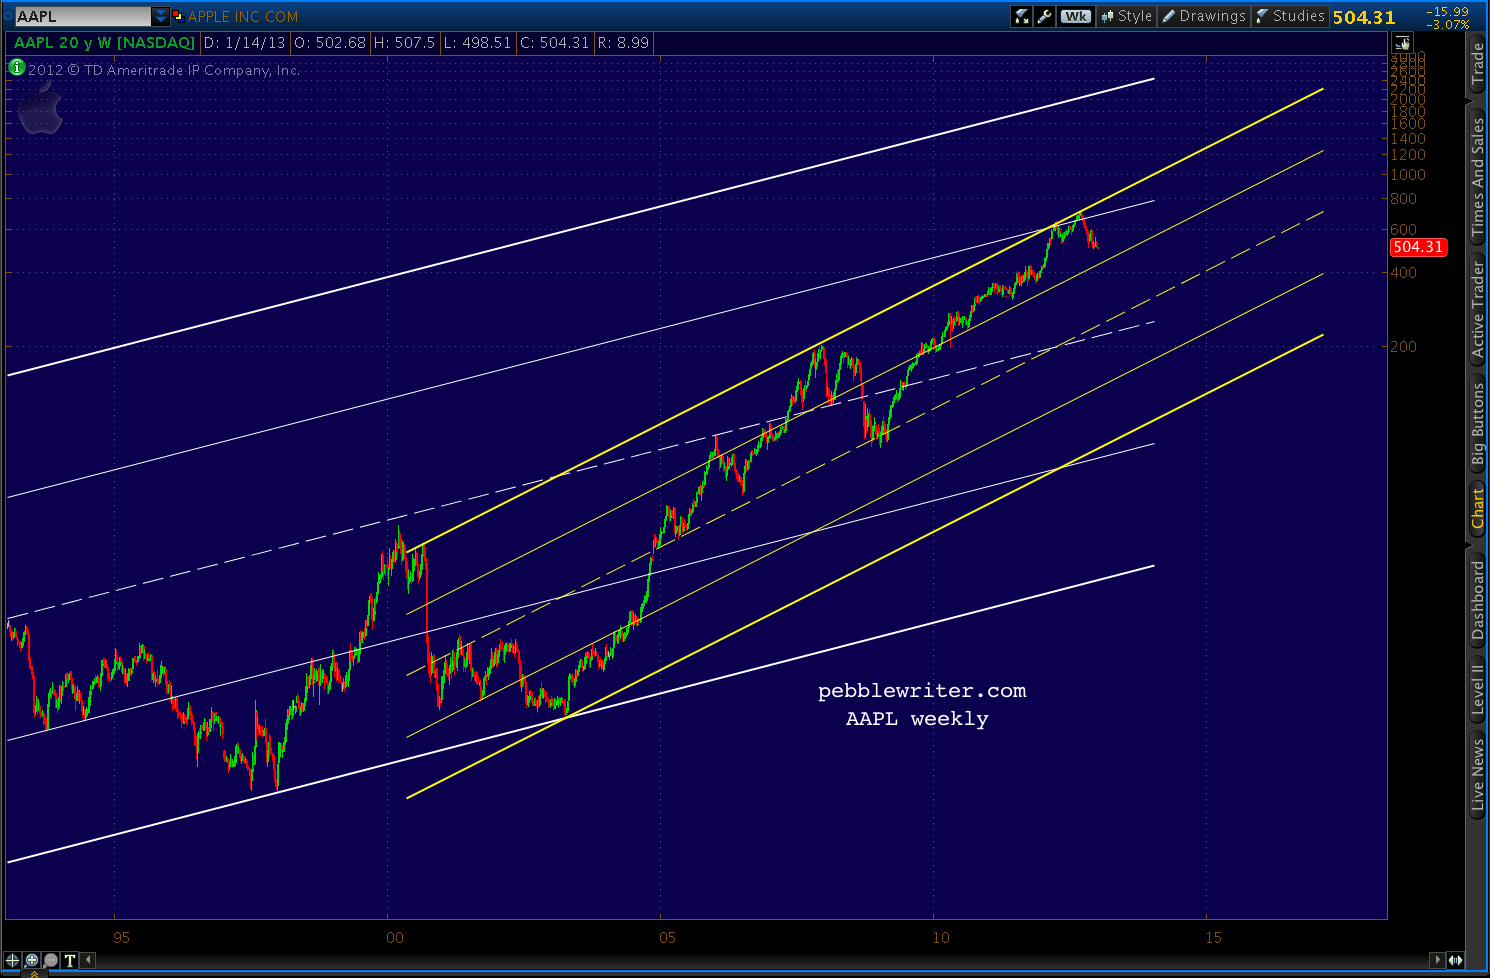
 If the current H&S pattern plays out and AAPL drops below the purple channel support, there’s another, less bullish channel that could come into play — seen in yellow below.
 The next lower channel line is in the vicinity of the purple line referenced above: 430 or so. But, if gravity takes hold, mid-line support doesn’t show up until around 300. Ouch.
There are a dozen or more other patterns that could easily influence AAPL’s future (consider, for instance, the grey channel I’ve sketched in — the mid-line of which marked this morning’s lows.) There are also many fundamental events that could strengthen the price.
The company’s current share buyback scheme, for instance, is only $10 billion — about the average daily volume at $500/share. But, with $120 billion in cash on the books and virtually no debt, the company could easily expand it to a more meaningful level.
If this most widely held stock were to crash, could the rest of the market be far behind? I think there’s little question it would. Such an outcome would spell disaster for the bullish story line that TPTB have been working so diligently to construct.
Might they join company insiders in supporting the stock here at 500? It would be a lot cheaper than another round of QE and, in the end, probably more effective.
Stay tuned.
UPDATE: 1:00 PM
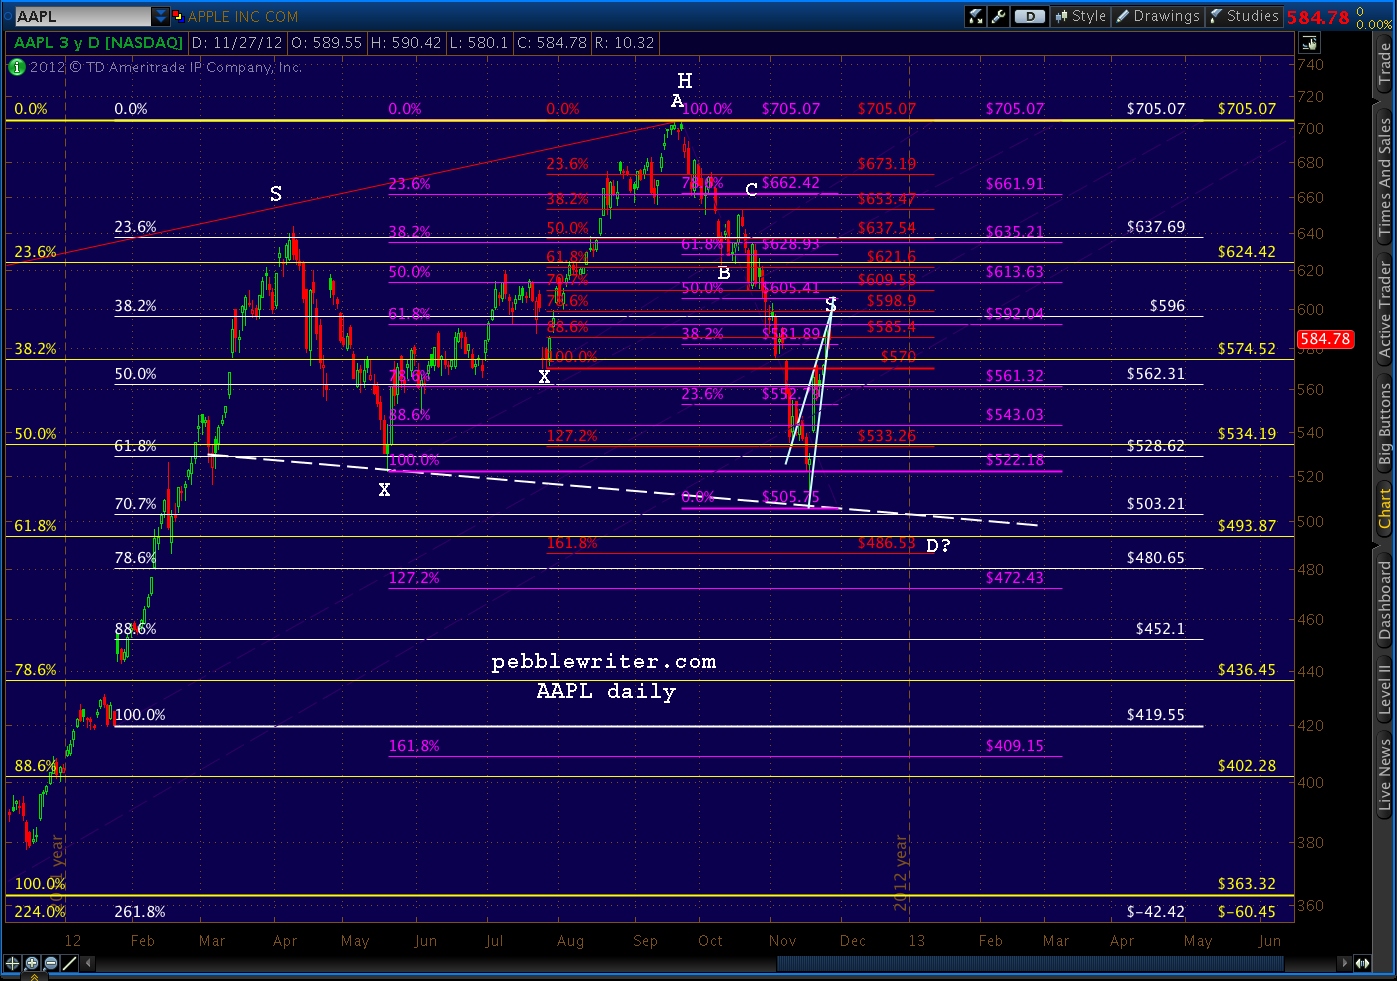
This morning, AAPL reached the downside targets we identified back on November 27 [see: Update on AAPL: Nov 27, 2012.] My thoughts at the time were that AAPL (then at 590) was about to reverse and retreat to the 500 area where we were likely to get a bounce before breaking down to 472-493, with 486 being the sweet spot.
Here’s the chart I posted back then, showing 486 as the (Crab Pattern) 1.618 extension of the 570 – 705 rally between July and September.
AAPL did, in fact, reverse at 594 a few sessions later — forming a now-obvious right shoulder. It bounced not once but twice at 500ish before completing the Crab Pattern this morning.
The chart below shows the actual price moves overlaid on that Nov 27 forecast.
 With this morning’s plunge, AAPL also tagged the .618 of the 354 – 705 rally (from the Oct 4, 2011 low) and the 1.272 of the small Butterfly pattern discussed above. The fact that it did so without a comparable sell-off in the general markets is potentially significant.
I certainly won’t discount the possibility of a bounce off the 1.272. But, a close below 500 does significant damage to the upside case.
continued for members…

Sorry, this content is for members only.Click here to get access.
Already a member? Login below… |


