Tag: forecast

  • Down the Rabbit Hole: Part 2

    Alice laughed: “There’s no use trying,” she said; “one can’t believe impossible things.”   “I daresay you haven’t had much practice,” said the Queen. “When I was younger, I always did it for half an hour a day. Why, sometimes I’ve believed as many as six impossible things before breakfast.”
                                        ― Lewis Carroll, Alice’s Adventures in Wonderland


    The market never ceases to amaze me.  Despite all the ingredients being in place for a sizable correction, it’s sailing along as though everything were copacetic.

    Negative divergence abounds.  The correlated currencies are all selling off.  Gold is down.  Silver is down.  Even AAPL is down. Numerous indices have completed bearish Harmonic or Chart Patterns.

    The Fed let slip yesterday that the adrenaline drip will soon be removed — leaving banks without a buyer for their underwater mortgages and the stock market without any downside protection.  They’ve finally admitted what we’ve all known for some time: QE’s effect is diminishing, and the risk is growing.

    The budget showdown is still ahead (the part of the fiscal cliff that really matters.)   The most fractured Congress in modern history, which utterly failed to resolve the important issues, will now turn the task over to an arguably more partisan Congress.

    The country’s AAA credit rating is hanging by a thread at both Moody’s and Fitch.  A downgrade by either would require massive selling by institutions which require at least two AAA ratings in order to comply with their investment policies (especially insurance companies.)

    Unemployment has reportedly declined, but only because we no longer count the dejected job seekers who are leaving the work force in droves.  Include them, and the actual picture is startlingly bleak. (source: Shadowstats.com)

    The EU is officially back in a recession (though it never really left.)  Its banks are being kept afloat by the ECB/ESM, which is exchanging (somehow AAA) paper backed by shaky sovereigns for junk sovereign debt as fast as it can.  Meanwhile, unemployment continues to soar.


    The big 2013 headline that isn’t (yet) is the global derivatives debacle:  $700 trillion — over 10 times the global economy — of unregulated, unpriced, unreported private contracts which have been sliced and diced so many times that no one has the slightest notion what the risk really is — except that it dwarfs the capital of the banks that hold it.

    In my opinion, the only things keeping the economy and the market afloat are the unrelenting screech of MSM fairy-tale “good news” and the Bernanke Put (the Fed’s money printing and plunge protection operations.)

    As long as these two factors can outweigh the negative fundamental picture, the market stands a good chance of rising.  Take one of them away, and the resulting crash will be swift and severe.

    That said, I’ve spent the past two days assessing the current state of our analog and forecast.  I’ve quantified it as best I can in an attempt to eliminate my admittedly negative bias.  I’ll lay it out over the next several hours, a few charts at a time.

    If you’d rather skip to the punchline, I’m still bearish.  In the absence of a push through 1474, I think we’re in for a sizable correction and remain short from 1462.  If 1474 is broken, everything changes.

    For members who enjoy getting their fingers dirty, stay tuned.

    *  *  *  *  *  *  *  *

    About an hour ago, we completed a Bat Pattern which is nestled inside of a Bat Pattern which is nestled inside of a Bat Pattern.


    UPDATE:  3:15 PM

    RSI channels show how much is riding on this moment.  A push through the top of the purple channel brings the red channel mid-line into play.  Could it correlate with 1474, or maybe just the next channel line on the intra-day?

    I’m not sure.  The intra-day 1.272 is 1468.17 and the 1.618 is 1471.61.  A double-top would be a real nut-buster.

    All I know is there’s still negative divergence across the board, so I don’t expect the red mid-line to be broken.

    My apologies for the delay in getting the forecast charts up.  They’ll have to wait until after the close.  I’ve been distracted by the melt-up, checking and re-checking my charts to see what I might be missing.

    continued for members(more…)

  • Winding Down

    Beware the Fee-scal Cliff

    Today’s post concludes a week of publicly available intra-day posts, my little gift to those considering a pebblewriter membership.  Sorry, but the forecast is for members only.

    As announced on Monday, subscription prices will increase on January 1.  In keeping with the concept of paying for performance, the annual rate will be about $10 for each percentage point of return since the new site’s inception on Mar 22, 2012.

    We’re up about 95% over those first nine months [SEE DETAILS HERE] so the new rates will be as follows:

    • Annual:  $950
    • Semi-Annual: $550
    • Quarterly:  $375

    The first fifteen to sign up for an annual membership at the current rate of $800, however, will be granted Charter Member status.  Charter Member rates are locked in for the life of the site, so you’ll never pay more — no matter where annual rates end up.

    If we are fortunate enough to continue averaging a little over 10% per month, annual memberships would be $1,200+ in March.  So, locking in current prices is a no-brainer.

    Sign up HERE.

    *  *  *  *  *  *  *  *

    ORIGINAL POST: 9:30 AM EST

    I remain short from 1447 on Dec 18.  Time is running out for our heroes on The Hill.  Market corrections don’t require that everyone turn bearish — just the handful in the middle whose selling turns the tide.   Those investors who have been wondering, waiting hopefully for a fiscal cliff deal to emerge from Washington… might at least a few of them decide to rein in their equity exposure today?

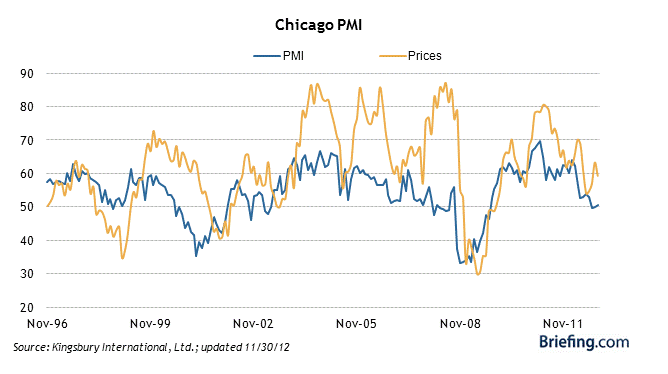
    Watch this morning for the Chicago PMI — due out at 9:45 EST.  Last month, it turned up slightly, but was considered bearish due to the decline in new orders.  From Briefing.com:

    Briefing.com puts out great graphs, such as this one on the relationship between pricing and the PMI itself.  Not a terribly bullish looking chart.
    UPDATE:  9:44 AM

    RSI has a long ways to go before finding any channel support…

    Why am I always talking about RSI? It might be the fact that it’s helped me call almost every major turn the past couple of years.  As regular readers know, I employ a deceptively simple-looking practice of channeling RSI values in different time frames.

    Combined with Harmonics and other chart patterns, it has been very effective in forecasting.  Consider the past six months alone…
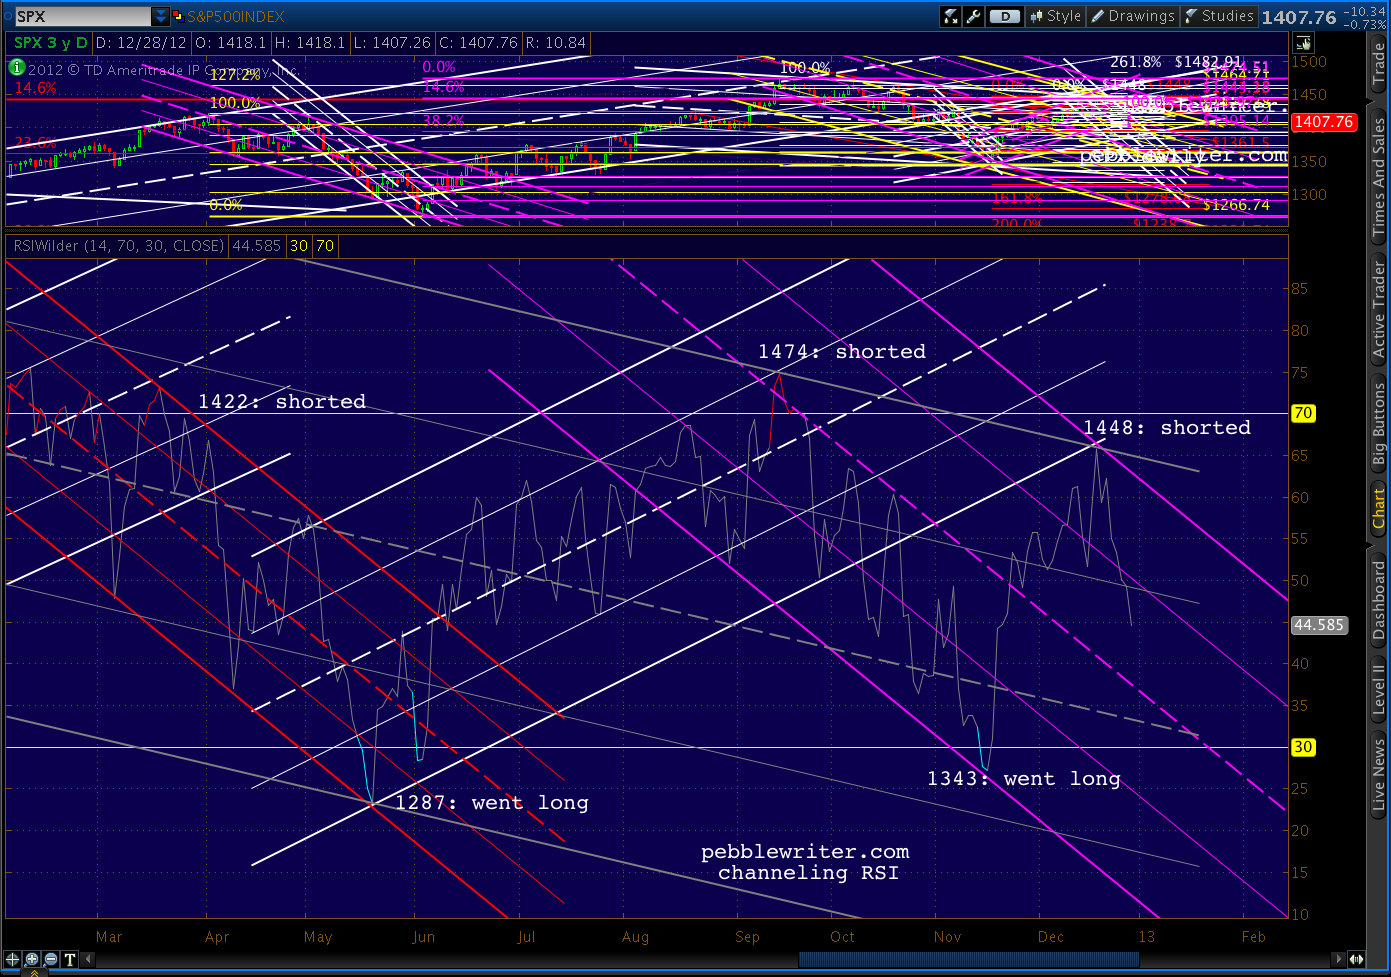
    April 2 — Shorted:  SPX completed a Butterfly Pattern at a channel top at 1421.05.  It was also the third lower RSI value in a row on higher prices (negative divergence) after RSI tagged a channel midline.  See: All the Pretty Butterflies.

    June 1 — Went Long:  SPX reached the bottom of an RSI channel, back-tested a falling wedge and found harmonic support — all at the price levels forecast by an analog that had been going gangbusters since April 9.  See: Why I’m Buying.

    September 14 — Shorted:  SPX had completed a Bat Pattern that dated back to October 2007, tagged RSI and price channel lines.  VIX and DX RSI channels also indicated impending reversals. See: The World According to Ben.

    November 16 — Went Long:  SPX had reached three important harmonic targets, reached a H&S Pattern target, tagged RSI and price channel bottoms — all at a price level forecast on October 31.  See: CIW Nov 16.

    December 18 — Shorted:  Prices overshot our forecast target by 6 days and 10 points, completing a Gartley Pattern set up by the 1474 – 1343 drop. But, in the process, daily RSI completed a perfect back-test of the recently broken channel that had governed the rally since June.  See: CIW Dec 18.

    Together, these major moves accounted for returns of about 40% since the new site’s inception on March 22.  The other 55% came from interim swings ranging from an hour to a few weeks.  But, all of them were influenced by RSI channels, which frequently provided a signal quite contrary to popular thinking.

    I don’t know of any analysts who use RSI channels.  In fact, a Google search for the term “RSI channel” shows a whopping 3 hits in the past month — two of them from this site.  Have folks tried them and failed, or are they just too complicated?

    Though they’re almost always obvious in the rear-view mirror, RSI channels can be very difficult to use in forecasting.  Charts drawn in different time frames can suggest very different results.  They’re tough to use in choppy, directionless markets.  And, divergence is always a challenge.

    In short, RSI channels aren’t for everybody.  It helps if you enjoy staring at charts for hours at a time, and can pick out patterns in a jumble of seemingly random lines.  It also helps to understand higher math, as RSI is essentially a derivative of price movements (magnitude and velocity of price changes.)

    If you’re thinking about using RSI channels, you might want to start with an aptitude test — available here.  Or, just tune in each day and I’ll let you know what I think.  After a year of practice and a few thousand charts, I view them as an indispensable secret weapon.

    UPDATE:  12:20 PM

    Chicago PMI [download here] actually increased from 50.4 to 51.6 this month — though it would still have been below 50 if not for the always handy “seasonal adjustment.”

    The increase again conceals a troubling development: employment and capital spending are both sliding.  New orders rebounded almost to October levels, but CapEx hit a new 28-month low, while employment plunged from 55.2 to 45.9 — the lowest level in three years.
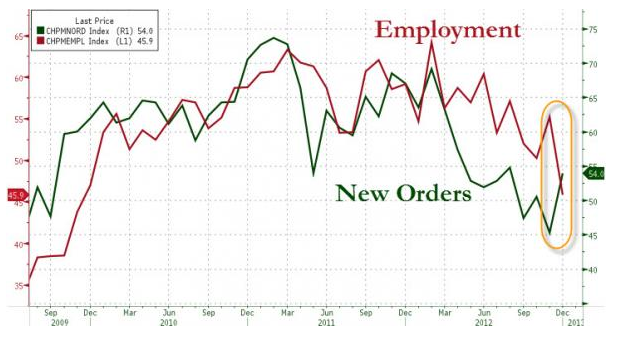
    Lest my bearish leanings sway you, here’s how ISM itself assessed the report:

    The Business Barometer was guided higher almost exclusively by a sizable advance in New Orders.  In spite of the rise in the Chicago Business Barometer, five of the seven business activity indexes declined in December, most significantly the Employment Index.

    In other words, any decline in New Orders — the big “winner” this month — and the whole index will head south for the winter.

    UPDATE:  2:50 PM

    The market continues the kind of slow-motion shuffle to the exits you might see in a crowded movie theater when that first whiff of smoke is noticed.

    Note the impending H&S Pattern (in yellow) completion at 1402 — a scant 4 points below today’s low.  It targets 1354 — right at the Fib .886 of the 1343 – 1488 rally.  We’ve laid the proper groundwork for Bat, Butterfly and Crab patterns in the 1355-1368 range.

    But, of course, this refers to the next leg down — not the entire move.

    I don’t know whether the fiscal cliff will be deemed “solved” in the next hour or not.  I think we can all agree that whatever deal the combatants strike (if any!) the MSM will herald it as the greatest thing since tranched bread.

    If so, and if it gets the right spin, the market is bound to jump.  That’s why we always, always use stops.  Always.  Stuff happens.

    As regular readers know, however, I don’t think it’s going to happen.  IMO, nothing has changed in the past two weeks since I posted:

    …clearly we are slipping closer to the point where a budget deal can’t/won’t be done — assuming the dem’s were ever willing in the first place.

    Given the current political climate, going over the cliff might be the only way possible to reduce spending and raise taxes.  There are many in both parties who openly support the idea, and probably many more who secretly support it.

    It makes sense.  Politicians know we need to balance the budget.  But, they also know their careers will be damaged if they vote for tax increases or spending cuts.  Could be that all the negotiating back and forth is for show, so neither party can be blamed for the hit to the economy that a balanced budget will necessitate (or both will be blamed, depending on your POV.)

    As I’ve posted ad nauseam, any deal means higher taxes, lower government spending, or (almost certainly) both.  We can debate whether this might be good for the country’s economy in the long run.  But, there’s no question that it will stymie growth in the here and now — at the very least.

    Bottom line, I don’t believe there is a “good” outcome to this mess — regardless of what the talking heads report.

    UPDATE:  3:55 PM

    How about a close right at the neckline?  Don’t be surprised.  VIX is getting so very close to tagging that important 22.23 level.  Five minutes left…  where’s the Plunge Protection Team?

    UPDATE:  EOD

    Sometimes — not often enough — Mr Market can be a little predictable…

    Another 3.1% for the week since our 1447 short on the 18th.  Not too shabby.  If anyone’s interested, there are still a few of those Charter Memberships left.  Click HERE.

    I’ll post more later tonight.  Have a great weekend everyone!

  • The Morning After

    What a disaster for Boehner & Co. last night.   Did we really need another warring faction?  What are we — Greece!? Wait, don’t answer that!  The markets will not take kindly to this additional complication.

    Today’s theme song: Maureen McGovern’s song from the 1972 Poseidon Adventure.   Don’t laugh, it won an Academy Award!

    What sold me were the movie clips that Brendan Thompson matched up to the song on YouTube.  Perfect metaphor for our current situation.

    It opens with Larry Kudlow studying the charts: “obviously a buying opportunity!” as the bulls party like it’s 1999 with Bernanke (Hackman) leading the cheering.

    0:18 – In a cameo, Yours Truly sounded the warning, but it was left on the cutting room floor.

    0:30 – Things are suddenly not on an even keel.  Quick, call the Plunge Protection Team!

    0:47 – Boehner’s motion is “tabled.”

    1:06 – Things have stabilized; experts encourage investors to “hold on.”

    1:12 – Bernanke leaps into action.  It’s a crappy job, but he’s just the man “in the end.”

    1:16 – A private conference between Merkel and Draghi:  “I thought we were in trouble!”

    1:18 – Harry Reid restrains a screaming Eric Cantor: “This is what they wanted all along!” as Pelosi dives over the cliff.

    1:30 Boehner makes another brief appearance.

    1:53 – Pelosi caucuses with one of the last remaining moderate Republicans. Together, they hatch a risky plan — find a political middle ground that will preserve the country’s future.

    2:16 – Obama is there to announce that disaster has been averted, since…

    2:18 – Everything’s fine, now that Helicopter Ben has arrived.

    In terms of the current markets, I’d put us somewhere around the 0:35 mark.  Enjoy!


    Note: has to be opened on YouTube due to copyright considerations.

    *  *  *  *  *  *  *  *  *  *  *  *

    All I can say is “thank God for Congress.”  They make life so much more…predictable.  While the PPT swings into action, trying to clean up the mess, Boehner reiterates just how far apart the two (how many?) parties remain.  Thanks to the failed House action last night, we now know just how divided are the Republican ranks.

    First test: the channel up from 1343, which coincides with a Crab Pattern completion — not to mention a nauseating diatribe from the MSM as to why this is a buying opportunity.   I remain short from 1447 on the 18th [see: CIW – 1:10PM Update.]

    SPX would have tagged the .618 at 1425.68, but that would have been a pretty obvious breakdown of the channel.

    DX completed the small Crab Pattern we’ve been tracking.  Expect a pause, but not much more.  The currency markets are harder to control than the equity.

    I think it’s safe to say our forecast continues to be on track.  Downside targets coming up.

    continued for members(more…)

  • Charts I’m Watching: Dec 11, 2012

    Today marks the 6th session since we shorted at 1423 [see: Without a Net] in anticipation of a strong downdraft.

    The first wave down since then was a respectable 25 points, hitting just below our initial 1400 target.  Wave 2 has since rebounded a little over a Fibonacci 88.6%, but is definitely taking its time.  With the bump up in the futures overnight, there’s even a possibility SPX will go up and tag the actual .618 at 1424.41 as discussed yesterday ( it hit 1423.73 on Dec 3.)

    The markets remain frozen in fiscal cliff headlights, and thus our forecast is becoming stretched.  I’m not overly concerned about this, as it has occurred in each of our previous analogs. I think it has to do with recognition of the pattern, and the efforts being made to avoid a similar outcome.

    The slope of the white channel could potentially be shifted, as illustrated by the above chart.  But, it would take a break out to reach the next higher Fib levels.

    A sustained move up through SPX 1325 would signal a Gartley Pattern to the .786 (1446) or Bat Pattern to the .886 (1459.)  In that event, I’m fully prepared to switch sides and take a stab at re-shorting at those higher levels.

    But, indications are that our primary forecast is about to be realized. The dollar, for instance, has tagged the bottom of the channel after completing a 61.8% retrace of the 1st of a wave 3 higher.  If it can hold the channel, the next move up should be explosive.

    continued for members(more…)

  • Charts I’m Watching: Dec 10, 2012

    The market continues to walk a tightrope between another leg up and a very significant tumble.  We’ve been here many times before in the past year, and it isn’t getting any more fun.  To recap…

    We remain short from 1423 on Dec 3 [see: Without a Net].  This was target A established in our Oct 26 forecast [see: A New Old Analog] and can be seen in the original chart below.

    Note that 1423 was very close to the .618 retracement (1424.41 on the white grid below) of the 1474 – 1343 decline.  Prices reversed there as we expected, shedding 25 points to 1398 in its first wave down (in line with our forecast of 1400.)

    That .618 retracement of the 1474-1343 wave down portends one of three outcomes:

    1. the bearish case:  a corrective wave 2 which sets up a more powerful wave 3 down
    2. the bullish case:  the first of a series of impulsive waves to new highs
    3. the middle case: the “A” subwave in an A-B-C corrective wave that points higher before wave 3 down.

    The first case is pretty clear cut, and has been detailed in prior posts.

    The third is also pretty clear, as the .618 retracement to 1423 could be merely a Point B in a Gartley Pattern to the .786 (1446) or Bat Pattern to the .886 (1459.)

    If SPX blows through 1425, I’m fully prepared to switch sides and take a stab at re-shorting at those higher levels.

    The big imponderable is case #2.  The top question I’ve received over the past week is whether a fiscal cliff deal would result in such a move.  It’s pretty easy to imagine that sort of a market reaction, even though — like last year’s debt ceiling compromise — it would hardly be justified.

    One thing is indisputable:  deal or no deal, we’ll get higher taxes and lower government spending.  Any combination of the two will negatively impact GDP.   By the same token, though, any deal would almost certainly mean a bump in prices.

    UPDATE:  11:50 AM

    Last Friday, SPX came within 48 cents of retracing .886 (1420.82) of its 1423.73-1398.23 decline.  This morning, it sealed the deal, reaching 1421.64 and completing the Bat Pattern.

    In the process, though, it tagged the neckline of the potential Inverted Head & Shoulder pattern we discussed Friday.   The pattern, if it plays out, targets 1507ish.  For the pattern to play out, we’d (at least) want to see a close above the shoulder line at 1420.80.

    But, it’s important to point out that not every IH&S pattern plays out.   Sometimes, it’s just market makers trying to shake things up a little bit.  Here’s one that didn’t play out last year, for example.

    Suppose we went up and tagged the actual .618 at 1424.41 for instance.  It’d be easy to see it as the bullish case playing out, what with a higher high and all.

    continued for members(more…)
