These annual reviews are always interesting. This past year of charting, like most, saw some enormous successes as well as some lessons in humility. More importantly, though, the markets’ behaviour in 2023 offers vital insight into the year ahead.
Equities
As we noted back on Jan 10, 2023 in A Look Ahead at 2023, the market had spent 2022 laying down some very precise cycles.
…we can see that the lows were exactly 80 sessions apart from one another. We show the cycle pattern in red below. We can also see that the significant highs were all very close to the midpoints of the cycle lows. We show them below in purple… Note that the Aug 16 and Dec 13 highs also backtested the SMA200.
If the 410.49 high on Dec 13 holds, then a drop to roughly 325.21 (presumably around Feb 7) would put the 70.7% retracement back at the channel top by the time of the next cycle high around Apr 7.
A drop a little further, to the white .618 at 318.24, would put the .707 Fib at 383.46, still within striking distance of the white channel top.

We didn’t put all our eggs in the bearish basket, however.
What if we’re wrong, and there isn’t a big selloff after all? Is there a case to be made for that?
Unfortunately, yes. And, it comes courtesy of the Dow. While SPX and COMP were constructing well-formed falling channels, DJIA broke out of its channel on Nov 10. It sort of backtested the channel top on Dec 16, but hasn’t yet dealt with the SMA200.
I would be surprised if it didn’t even backtest the SMA200 – which would mean a backtest of the channel top as well. If it does backtest both, that be a great place for TPTB to take a stand.
As of [this morning], that would mean a 5.22% drop…about 3775 for SPX and in COMP would mean 10,427.
As it turned out, SPX chose Plan B – briefly breaking out of the afore-mentioned cycle and channel before dropping to within 0.7% of our 3775 downside target. At this point, it had transitioned from faffing about to outright newtishness, re-entering the falling channel and plunging back below the 200-DMA.
We had discussed this on March 8 as Powell prepared to deliver hawkish testimony [see: Powell’s Testimony] noting that a drop would threaten a perfectly good IH&S Pattern that targeted SPX 4712.
SPX has obviously given up the neckline for the IH&S (in white) targeting 4712ish. If it were able to climb back above 4088, that scenario – no matter how unlikely such a rally is – would be officially back on the table.

A simmering banking crisis had boiled over with the failure of Silicon Valley Bank. The Fed did what it does best and, by making depositors whole, goosed the market back into breakout mode [see: FOMC Day.]
The initial rising white channel shown above broke down soon afterwards. And, the 200-DMA was tested twice more – even breaking down again in October when Powell delivered more hawkishness. It was enough to get ES down to our 4153 target – an important line in the sand we had detailed in July [see: Fitch Downgrades US.] It didn’t happen as quickly as we originally anticipated, but it happened all the same.
 There were plenty of downside targets available had that support not held. But, it did. As we noted on Oct 31:
Although SPX’s rising yellow channel has had plenty of wins and losses, the .236 line [tagged on Oct 27] has had a few key saves along the way – notably Dec 2018 and Mar 2023.
I haven’t put that much stock into it due to the many times SPX overshot or undershot one of the channel lines, but I point it out just in case the year-end run for the barn gets an early start. A drop by VIX through the SMA200 would help the bulls out immeasurably.
VIX plunged back below its 200-DMA the very next day and the “year-end run for the barn” was officially underway. We looked (to no avail) for backtests along the way. SPX found its way to 4712 and then some (4793 as of last week), coming up just short of its Jan 4, 2022 highs.
Currencies
We focus primarily on the EURUSD, USDJPY and DXY as they have the greatest influence on equity markets algorithms.
When we posted last year’s forecast [see: A Look Ahead at 2023] EURUSD had recently bounced off of important support and had broken out of a well-formed falling channel as well as its 50, 100 and 200-day moving averages. It targeted 1.1285, but it was running into resistance.
EURUSD was a very reliable short for the past 1 1/2 years, tumbling in a steeply falling channel through multiple levels of support. Upon completing a Crab Pattern at the white 1.618 in Sep 2022, it began to rebound sharply.
A common target for a completed Crab pattern is the .618, which in this case is at 1.1285. But, to get there, EURUSD would have to push through some important resistance.

We later adjusted the upside target to 1.1273, which the pair tagged on Jul 18. As we noted at the time [see: July 18, 2023 Update on Currencies] this would be a turning point.
EURUSD tagged our 1.1273 target overnight. It came a little earlier than expected, but it’s a significant development given the pair’s correlation with stocks…This is also a backtest of the broken white channel – suggesting that the next major move is lower.

We initially set our sights on the 200-DMA, which was reached about a month later. But, when it broke down two weeks later, we focused on 1.055ish. This target was reached in early October at which point SPX/ES needed a bounce in order to hold their 200-DMAs [see: Oh So Close.]
Naturally, EURUSD came to the rescue, helping SPX bounce even though it hadn’t quite reached its 200-DMA. We looked for EURUSD to bounce to its SMA200. It did so, but had a hard time pushing through until Nov 14.
By then, SPX’s bounce was well underway. All that was required of EURUSD was to not fall back below its 200-DMA. It did just that, bouncing there on Dec 7 and continuing to urge SPX higher through the end of the year.
 USDJPY began 2023 on the brink of a death cross – which was just as dramatic as it sounds. As we wrote in our Look Ahead at 2023:
It’s no secret (at least to our members) that currency manipulation has been a central tenet of Japan’s efforts to prop up the Nikkei…[and] the NKD is on the brink of [its own] death cross this morning.
We were therefore fairly confident that USDJPY would not succumb, but would instead rally sharply in the weeks ahead. The moon shot target was 167, suggested by a recently completed and backtested Inverted H&S pattern.
 For years, the BoJ has walked a tightrope between zero/negative interest rate policy and inflation in order to ensure higher stock prices [see: The Yen Carry Trade Explained.] As oil prices quadrupled between Nov 2020 and Mar 2022, the BoJ should have propped up the yen in order to temper inflation. This would have been the logical choice…
While we would never put it past the BOJ to ignore reality and artificially suppress rates, it seems more likely that they’ll at least let rates drift higher over the short run – particularly if oil prices don’t drop even lower.
Instead, they cried “damn the torpedoes” – holding interest rates below zero and devaluing the yen by nearly 50%. Not surprisingly, inflation shot up to over 4% and JGBs spiked higher as well (at least by Japanese standards.)
 The rally in the USDJPY kept the Nikkei on the rise even as inflation became increasingly problematic. [Note: A plunging yen (soaring USDJPY) helps boost stock prices, but it pushes inflation higher since Japan imports much of its food and all of its oil with those increasingly worthless yen.]
The Nikkei and the USDJPY both bottomed on the same day that the USDJPY’s death cross occurred and two days before the Nikkei’s death cross.
Once USDJPY reached its 200-DMA, we looked for a temporary pullback. From the Feb 28 Update on Currencies:
Therefore, I’m looking for a pullback at these levels but am fully prepared to go long again. The IH&S backtest is complete, and the BoJ is nothing if not determined to keep the NKD aloft.
After that pullback, USDJPY tested its 200-DMA again in early May before finally pushing through on May 17. It backtested the 200-DMA again in mid-July. We remained bullish on the pair [see: July 18 Update on Currencies.]
From there, it was off to the races. All together, it was a very easy to follow progression with the only question being whether we’d get another 200-DMA backtest at the end of the year or USDJPY would push higher.
With plenty of gains since October, stocks no longer needed the yen carry trade’s help. USDJPY backtested its 200-DMA, where – as of this morning – it has loitered for the past two weeks
The euro and yen represent about 70% of DXY – the dollar index. So, when we successfully chart the EURUSD and USDJPY, we have a very good sense of what to expect with the DXY. This past year was a successful one in both those pairs, so it’s no surprise that our DXY charting went well too.
DXY finished off 2022 by nearly reaching our 115.283 target (114.778.) Its steady decline from Sep 2022 to May 2023 held to a well-defined channel and clearly reflected efforts to right the equity ship.
 Of course, the Fed has the same problem as the BoJ and the ECB: devaluing the currency can boost stock prices, but it also fosters higher inflation (the US is a net importer.)
As the narrative began shifting to a decline in inflation and interest rates, it became necessary for DXY to level off and stop contributing to higher inflation. Thus, it’s been going sideways in a fairly narrow band of 100-107 for over a year. It rallies to the top of the band when stocks need a backtest or to consolidate, then dips back to the bottom of the band when stocks need a boost.
Our forecast was off the mark somewhat, originally calling for a rise to the 200-DMA after the channel breakout in May followed by a decline to the .618 Fib at 97.72 [Update on Currencies: July 18, 2023.] We redeemed ourselves, however, with the call for a reversal at 106.28 in October. Oil and gas were probably the most interesting charts to stay ahead of this past year. Following a very easily forecast 2022…
 …2023 was definitely more complicated, with a channel breakout and a channel breakdown with which to contend.
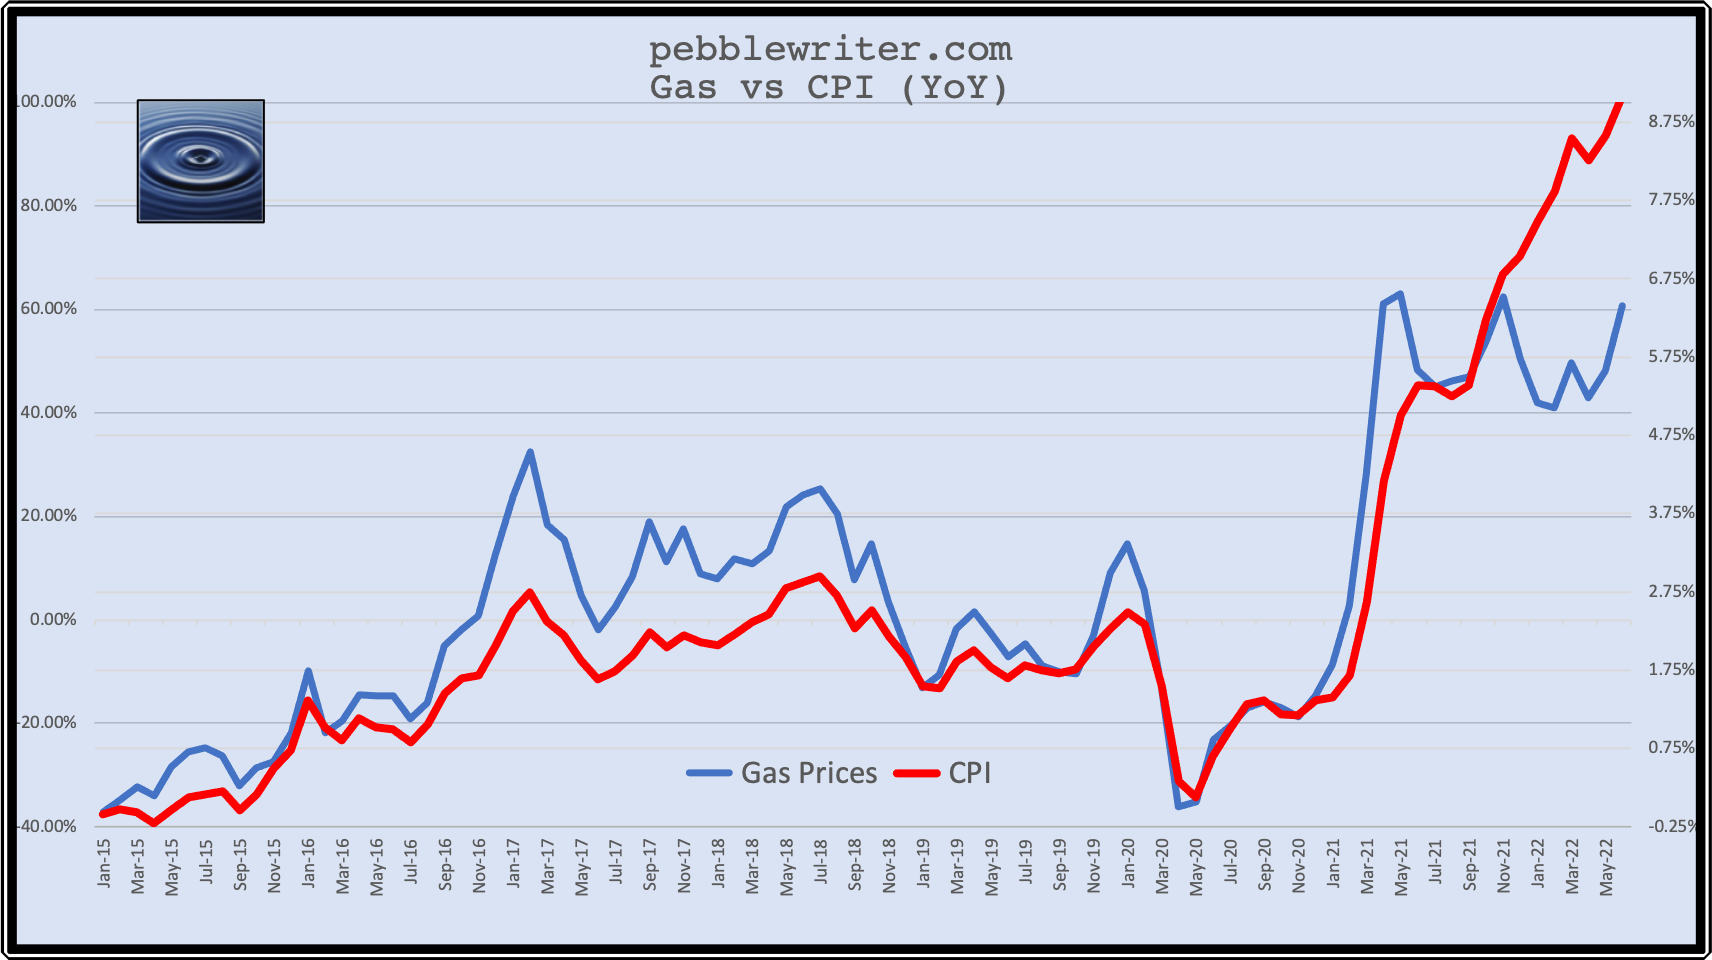
 Aside from the fundamental issues surrounding OPEC’s machinations, the Ukraine invasion and the Israel-Hamas war, there was math problem to consider. In order to get CPI back down from 9.1%, the Fed simply had to wait for the effects of falling oil/gas prices to bring the YoY delta back down. It worked very well.
 And, it made charting relatively straightforward: discern what the desired value for the next CPI print was and calculate where gas prices need to go in order to achieve that value. The fly in the ointment, of course, was knowing just what the FOMC had in mind at any given time.
So, RB came up a little short of our 4.5485 target in late 2022 and dipped a little lower than our 2.0774 target in Dec 2022. But, we didn’t buy the head fake when RB broke out of the falling purple channel in July 2023, reasoning that the decline would need to continue in order to prevent the 10Y from popping up through 5%. From FOMC Day: July 26, 2023:
Given the oil market’s recent breakout and the obvious base effect on inflation, we see a good chance of Powell presenting a more hawkish stance than the overbought market is prepared for…raising the prospect of spike in the 10Y to 4.76% by mid-August. One of the few developments that could prevent it: a collapse in oil/gas prices.
That’s exactly what happened. The 10Y rose to new highs on RB’s breakout, but plunged from over 5% to under 4% as oil/gas prices retreated. Since Oct 2022, RB has been flirting with reentering the channel from which it broke out.
 Bonds
Bonds
Much of our work in bonds has been driven by two very consequential charts: the 10Y and the 2s10s. We first started posting about the 10Y’s long-term channel back in Dec 2011 when it was around 1.9%.
I don’t often look at long bonds, but the ten year tsy’s pretty interesting. For those wondering if yields can go any lower, the bottom of the channel is down at 1.40% – a logical turning point.

Six months later, the 10Y reached 1.394 – where it bounced sharply. Needless to say, this was a strong endorsement of the predictive power of charts [why most analysts eschew chart patterns is beyond us…]
The chart has become a bit busier over the years, but it has more than proven its worth in forecasting. Most notably, it allowed us to call the 2012 bottom, the 2018 top, the 2020 crash, and the 2022 breakout, the 2022 top, the 2023 bottom, and the 2023 top. Since this review is concerned with 2023, we’ll focus on the past twelve months.
 One important axiom in forecasting interest rates is that they can move for many different reasons. While this seems obvious, many analysts focus almost exclusively on fundamental factors such as inflation, economic growth, credit quality, etc.
We’ve always taken a more cynical view: if central bankers care about equity prices (they do) and they can influence yields (they can) and yields can drive equity prices (they can), then it stands to reason that central bankers would, at times, shape their interest rate efforts around supporting equity prices (boy, do they.)
Another other issue many analysts ignore is that of flows. Without getting too mathy about it, scary goings on in equity markets can motivate investors to move money from stocks into bonds, driving prices up and yields down. This “fear trade” can easily outweigh the impact of fundamental factors. Conversely, low interest rates can drive money out of bonds into stocks.
We saw all of these factors at play in 2023, beginning with the bounce at the 200-DMA anticipated in our Look Ahead at 2023 post.
Our long-time downside target for TNX called for a backtest of the 200-day moving average. It seems highly likely we’ll get that backtest in the next few days.

Note that the chart also detailed our long-held 4.76% upside target, which would have required a breakout from the rising red channel.
The 10Y tagged the 200-DMA at 3.33% on Feb 2 and rebounded sharply, reaching 4.04% a month later. Although we postponed the target date for 4.76% by several months, 4% would remain a ceiling for another six months, at which point it finally made a move [see: The 10Y Breaks Out.]
What does it mean now that the 10Y has broken out? It’s a rhetorical question, of course. A breakout means the bond market is finally calling BS on the idea of a Fed pause/reversal – at least any time soon.

Had the 10Y stopped at the Fibonacci 4.76, it would have nailed our next upside target right on schedule in mid-August. But, it was destined to reach 5%, which meant either breaking out of the rising red channel or waiting until mid-October. The breakout above the 4.76% Fib and red channel top was a bridge too far for SPX, which had already shed 8.5% off its recent highs. The bottom of SPX’s little red falling channel shown below was violated, resulting in an 11% correction.
 The nice thing about that breakdown, however, is that it offered a clear sign of how yields can be manipulated to bolster stock prices. As soon as the 10Y reached 5%, and as soon as SPX had fallen more than the 10% mark traditionally considered the max for a garden variety correction, yields began plunging in a suspiciously orderly fashion.
 As the 10Y gapped lower, SPX gapped higher. In fact, SPX broke out of its falling red channel on the same day the 10Y gapped down a massive 20 bps in a single session. There were three other such plunges between Nov 1 and Dec 13.
No surprise, but the decline only ended when SPX maxed out at year end – which was a few days after the 10Y dropped below its 200-DMA for the first time in nearly 8 months.
Santa Claus rally indeed…
 Was 5% a prescribed top? The point at which the Fed would start whispering about rate cuts instead of rate hikes? It’s interesting to us that stocks bounced exactly where we had anticipated three months earlier [see: PCE in Line, Spending is Not.]
Powell said in his Nov 1 presser that the Fed would not rule out another rate hike at the Fed’s next meeting in December. Yet the FOMC held rates steady for the second meeting in a row despite economic activity which even the Fed admitted “expanded at a strong pace in the third quarter.”
Conclusion
Bottom line, the days of markets reacting solely to fundamentals – if they ever did – are long gone. A few years ago, JPMorgan estimated that less than 10% of equity volume is driven by fundamental stock picking. The rest? Algorithms and all the things driven by them – which includes all index funds, most ETFs, many mutual funds and plenty of hedge funds.
Some might shake their fists at the sky and cry “why!?” The more logical reaction is to recognize the patterns and capitalize on them. Chart patterns and technical analysis are great tools. So are quantitative tools which recognize cycles, patterns and algorithmic inputs for what they are: clues to future price movements.
On that note, we’ll wrap the 2023 review and spend the weekend on the look ahead at 2024. It promises to be interesting.