

Futures are holding a slim gain this morning with the assistance of both the EURUSD and USDJPY, which is just shy of our next upside target.
 As discussed yesterday, central bank currency games have been instrumental in equities ability to break out of the year-long downtrend. Can they keep it up?
continued for members…
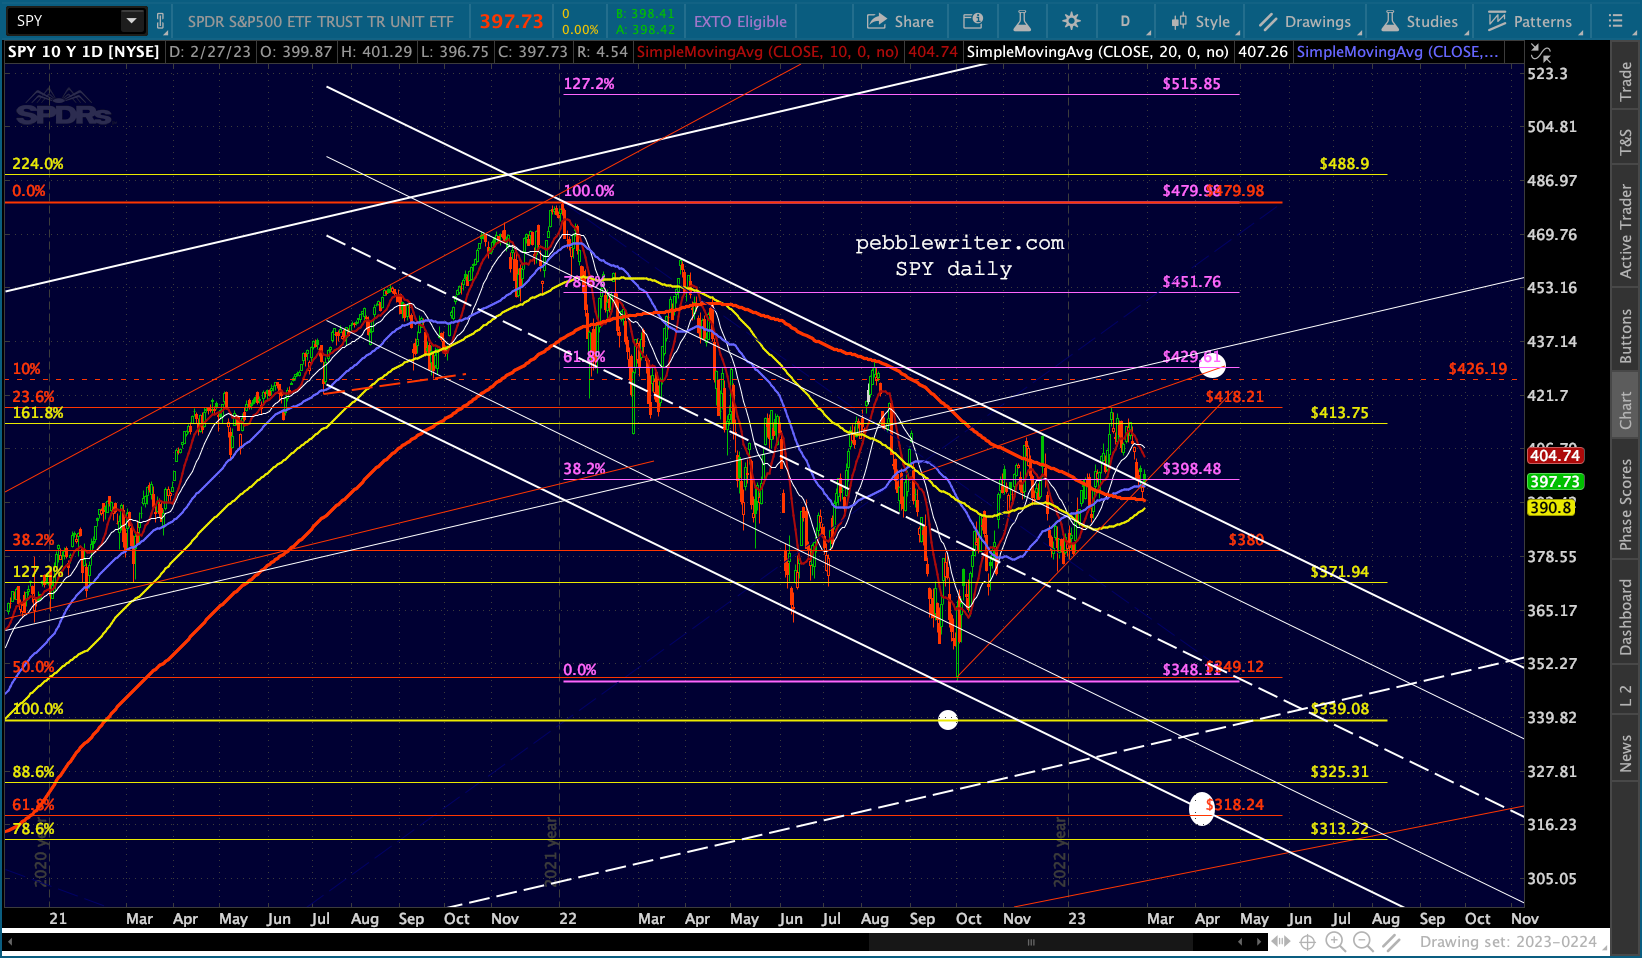
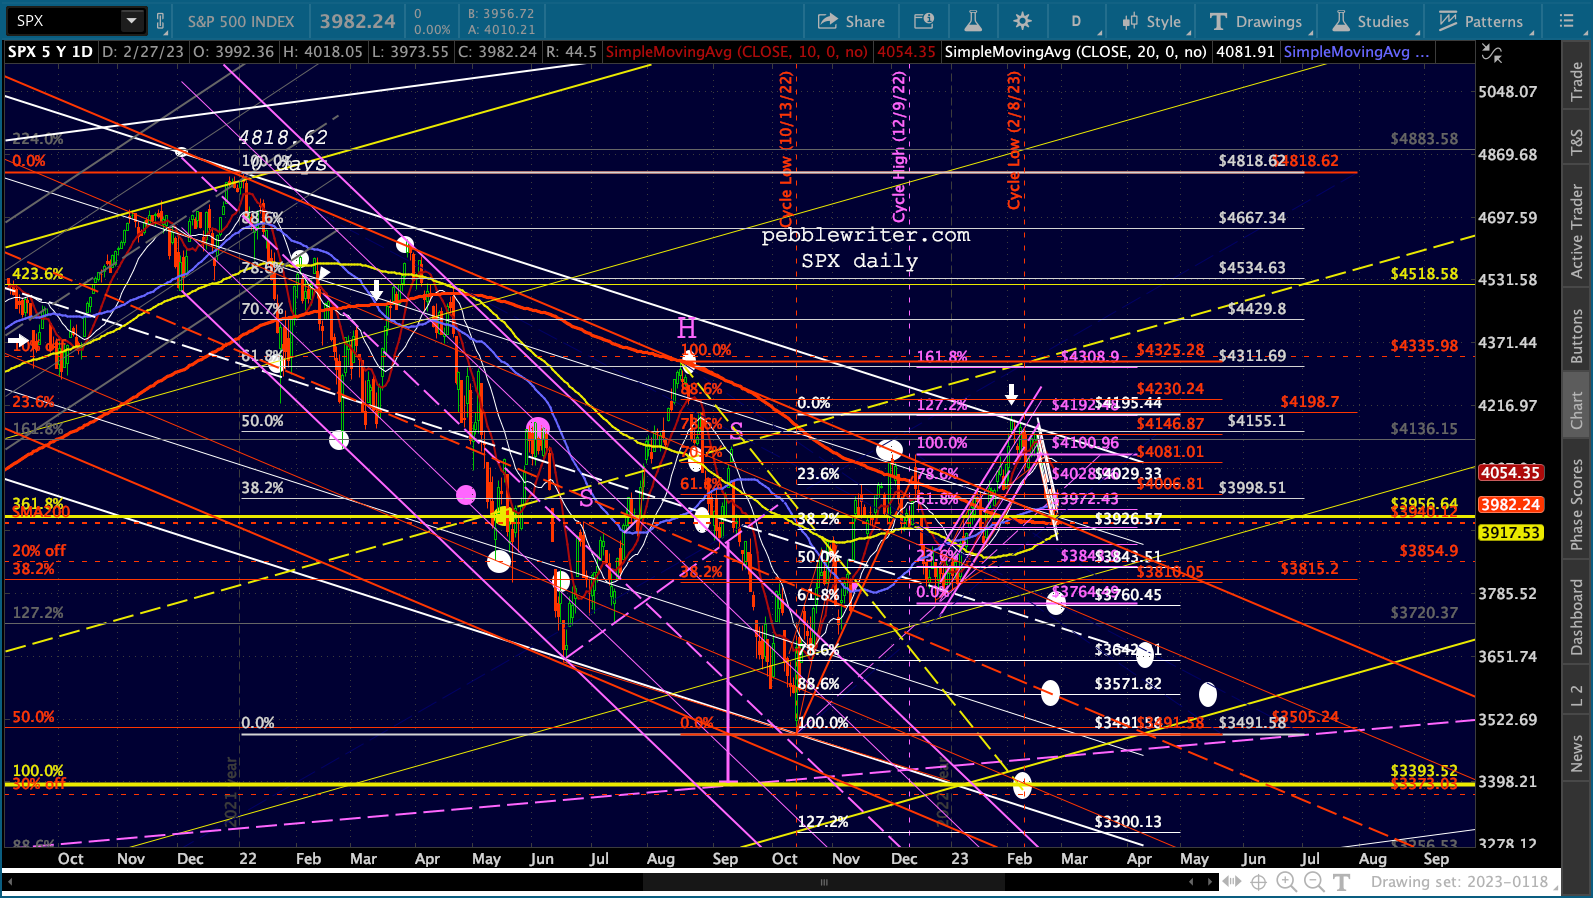
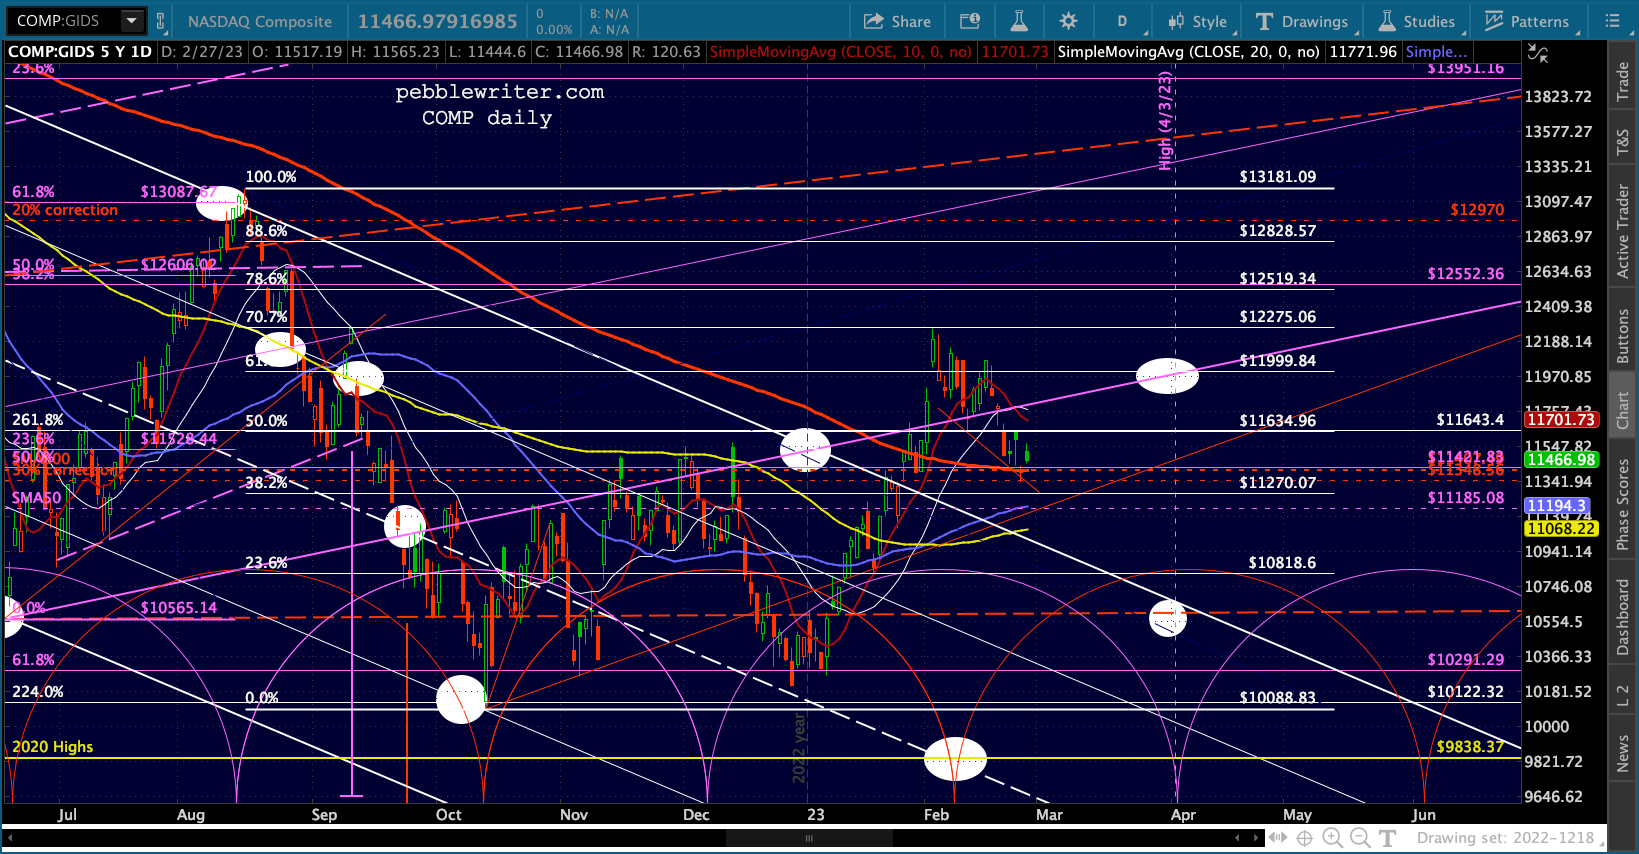
First, the big picture for equities. Nothing has really changed since yesterday. Major indices have all broken out of and backtested their downtrends, leaving us in a sort of limbo where lower prices are certainly a possibility but the usual outcome is a time-wasting trading range. Having said that, the extent of the range is still unclear.
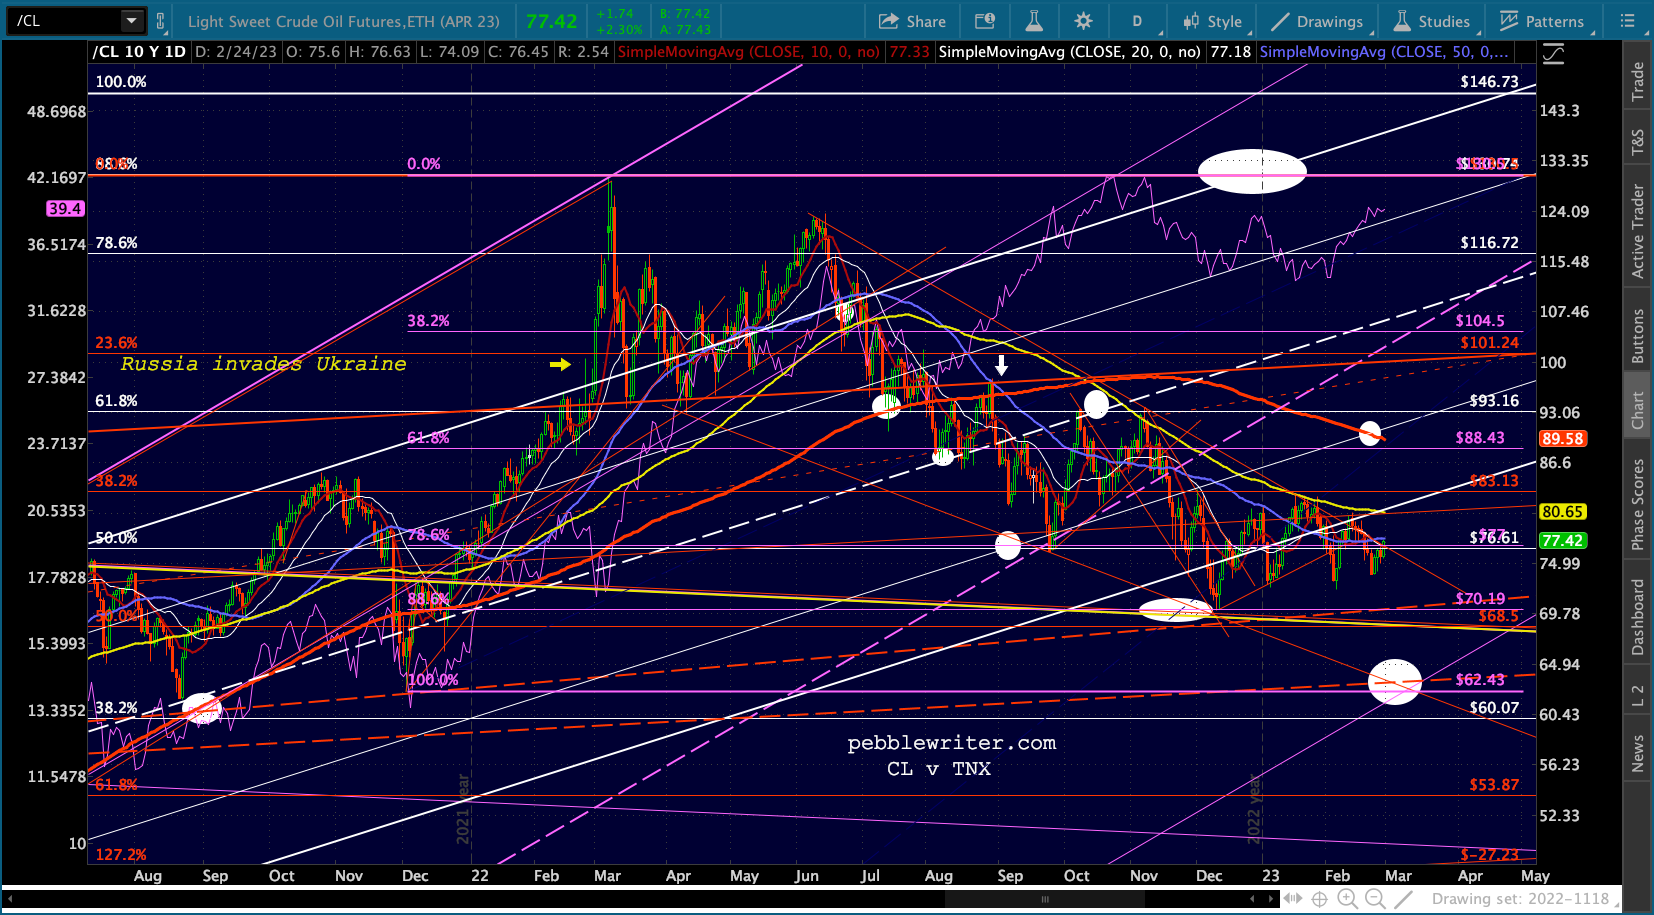
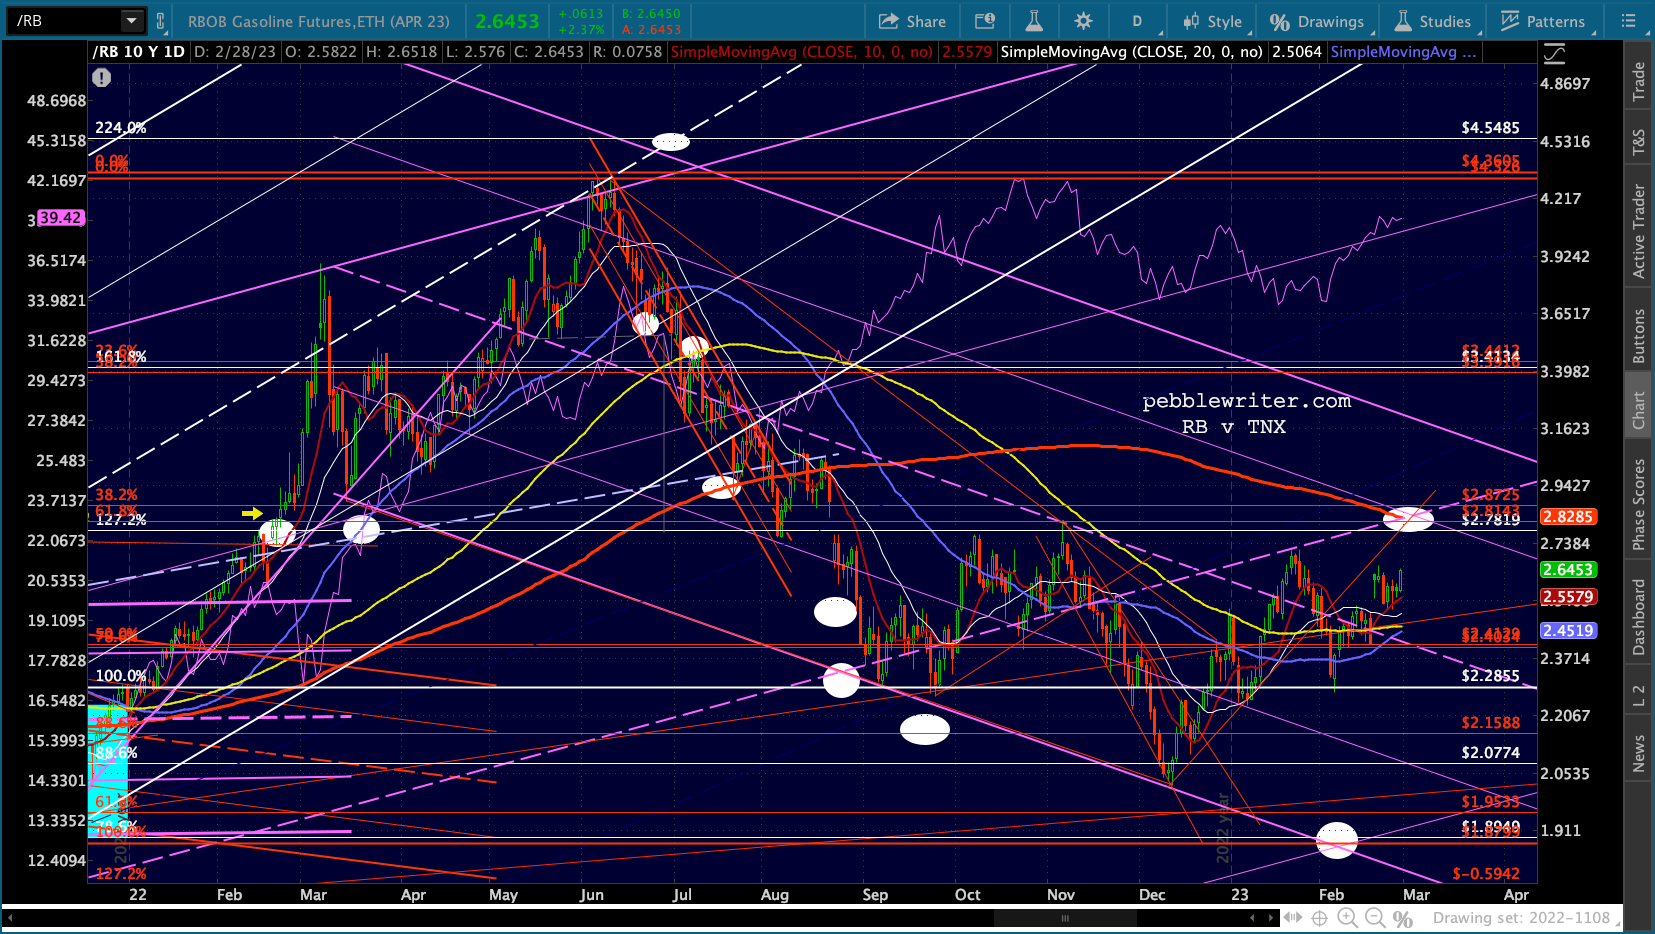
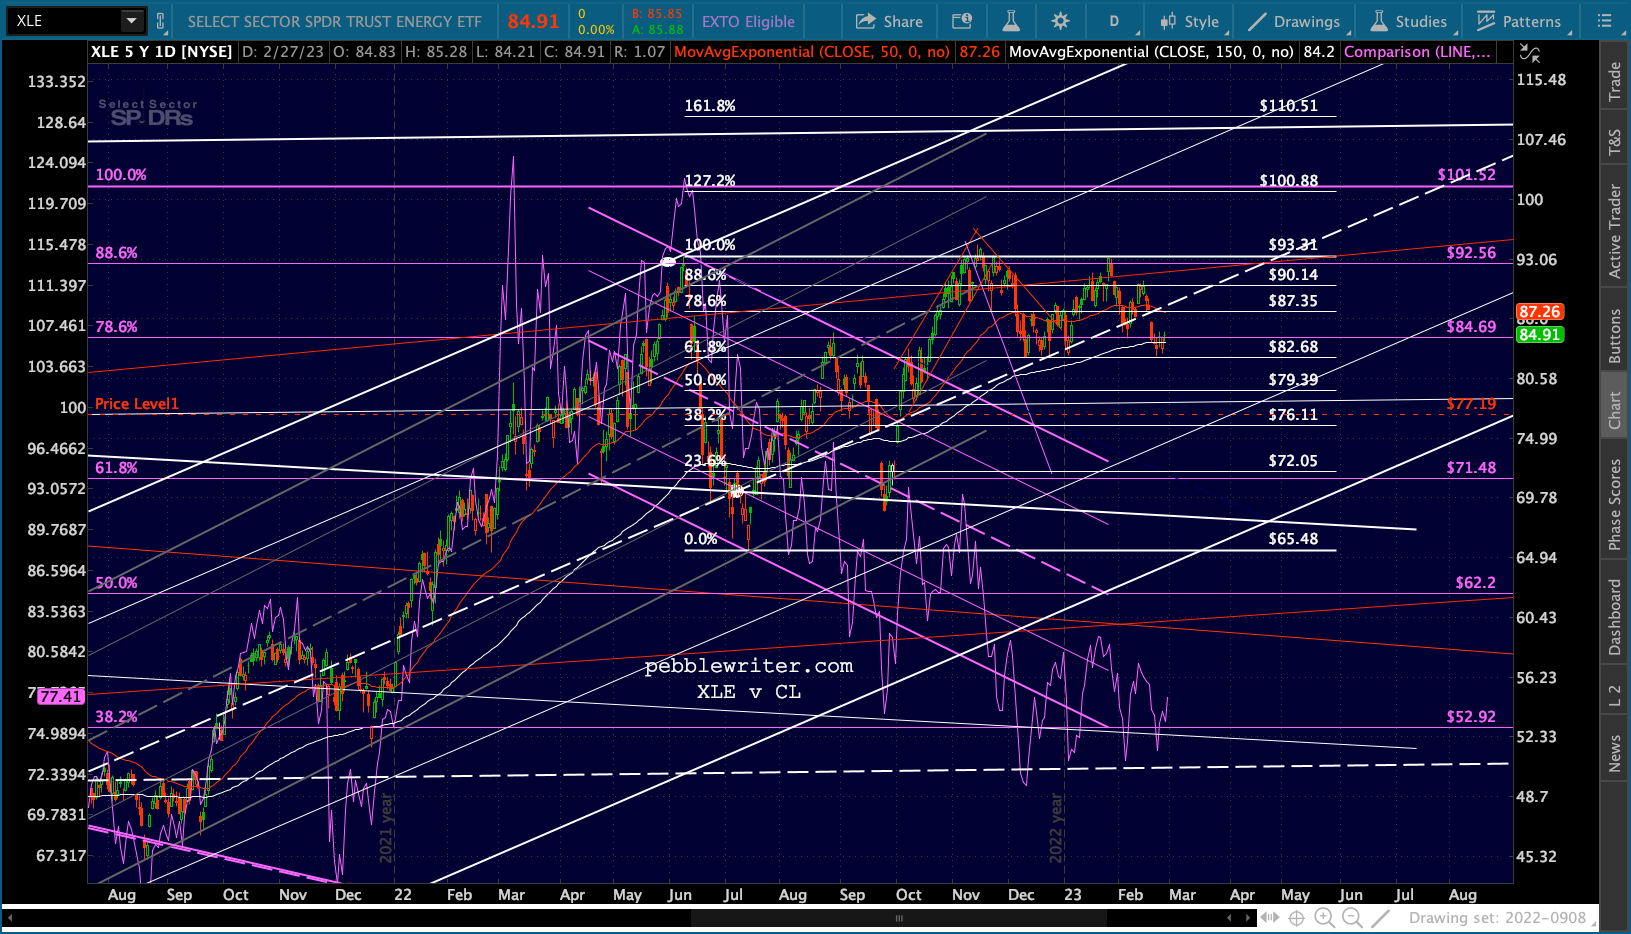
 Oil and gas are both playing along this morning, aptly feeding the inflation narrative…
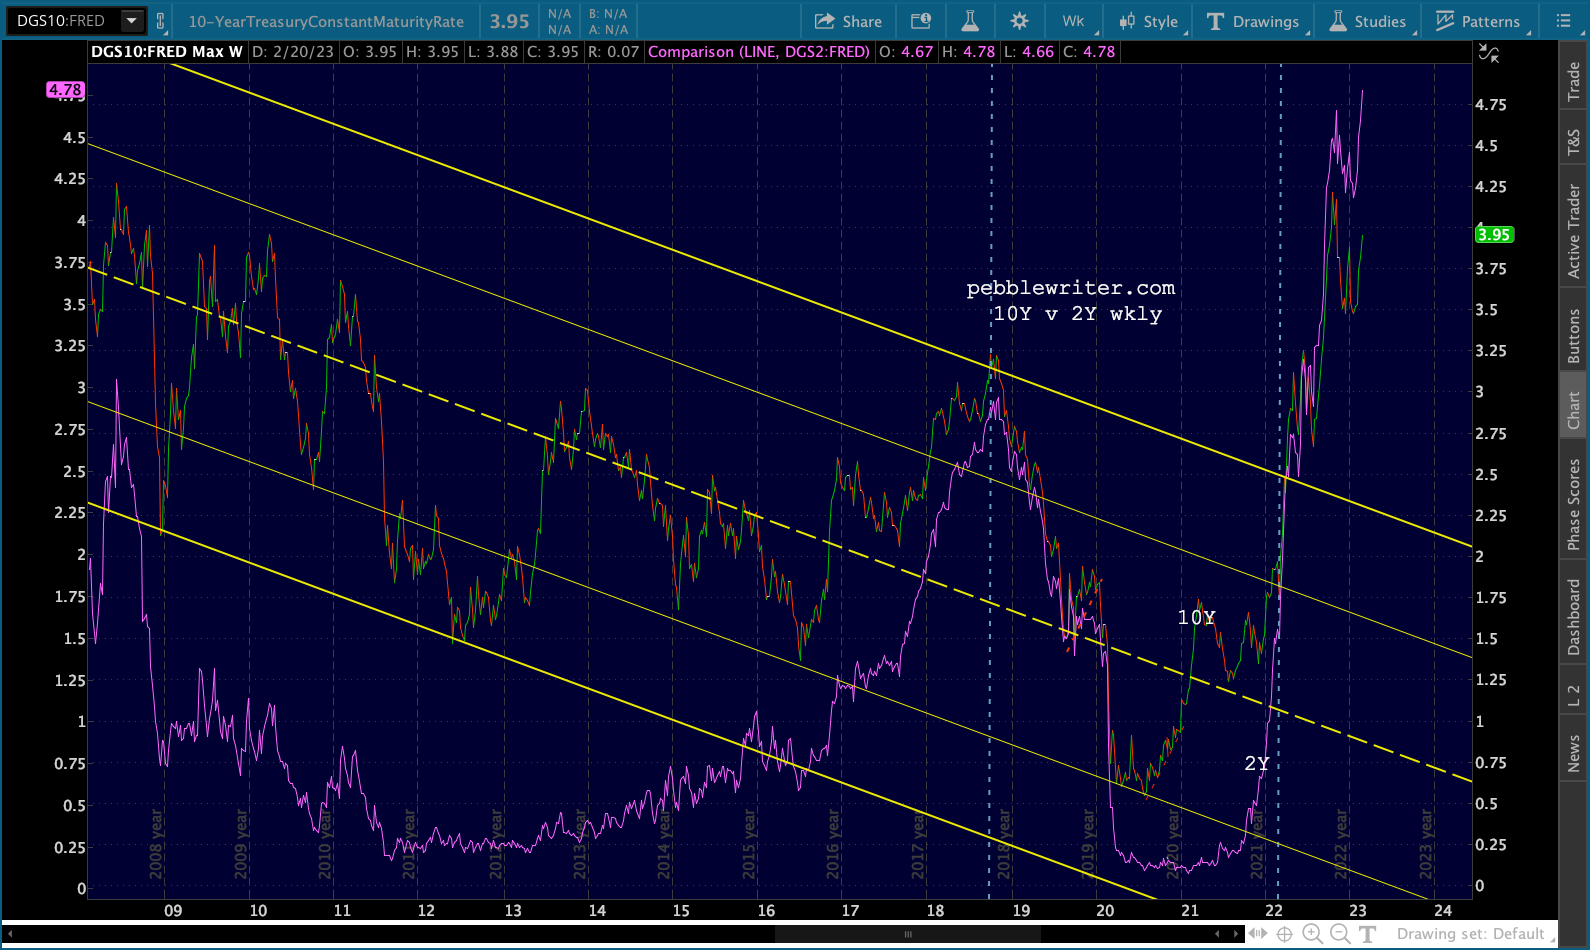
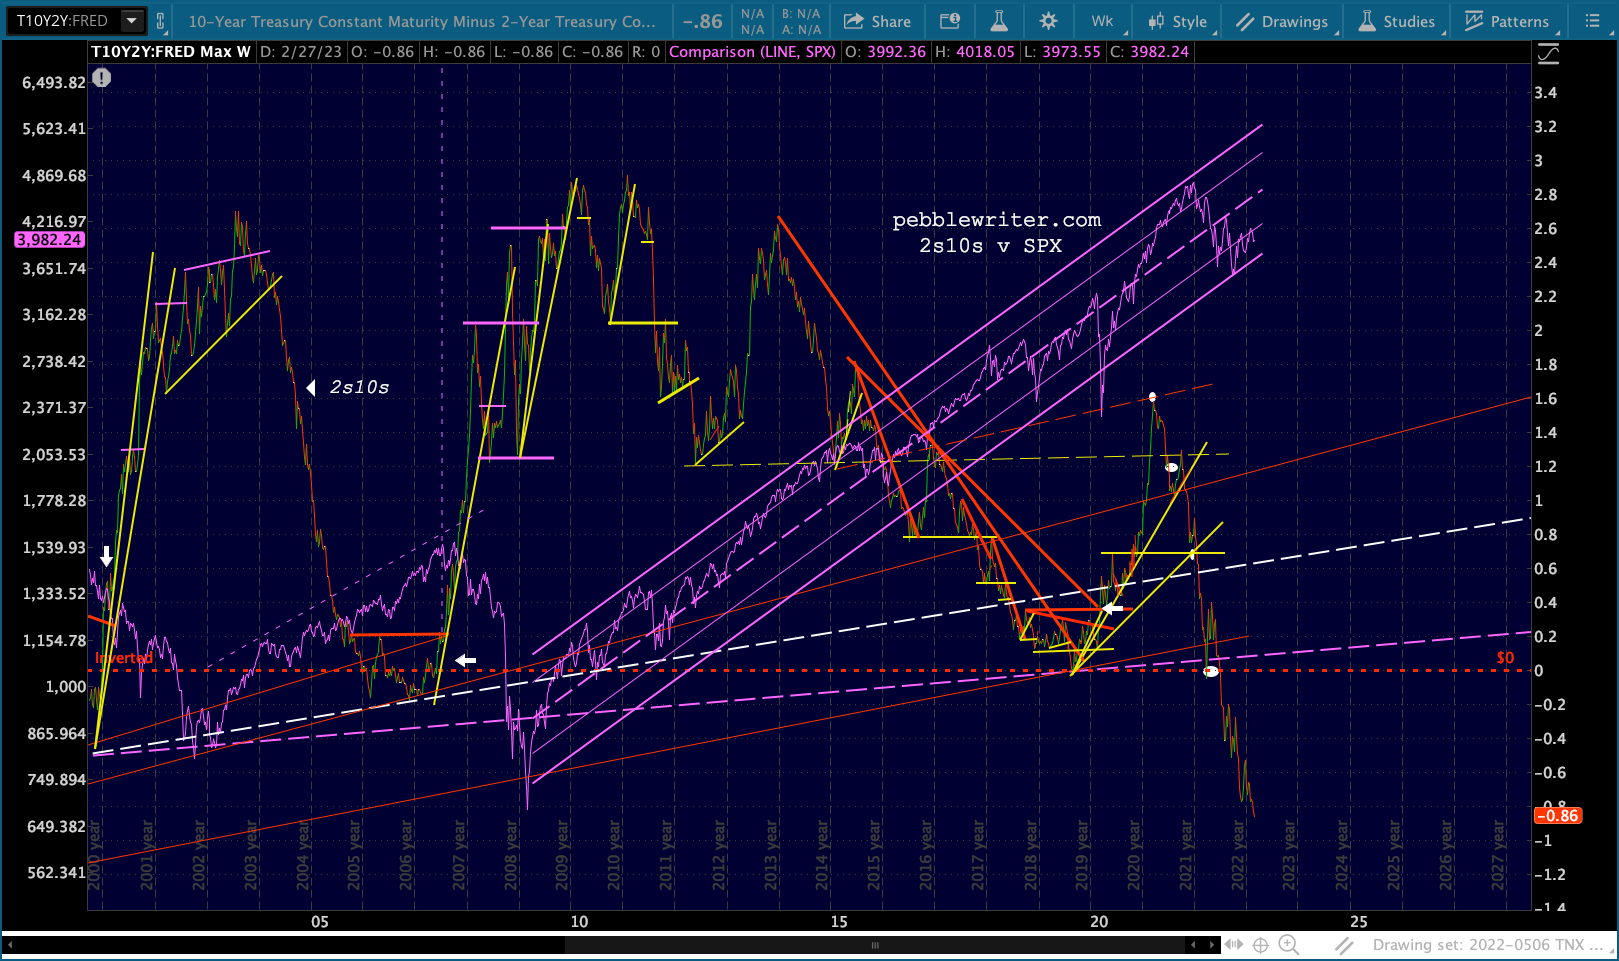
 …which is pushing the 2s10s lower and lower.
 I have some conference calls after the open, but will be back to lay out the big picture for EURUSD, USDJPY and DXY.
The initial charts:


 Apologies for the lengthy delay. Here are the longer term charts I promised…
EURUSD:
There are lots of potential channels to choose from, but at the end of the day the yellow channel midline (dotted) is the line that EURUSD keeps coming back to.
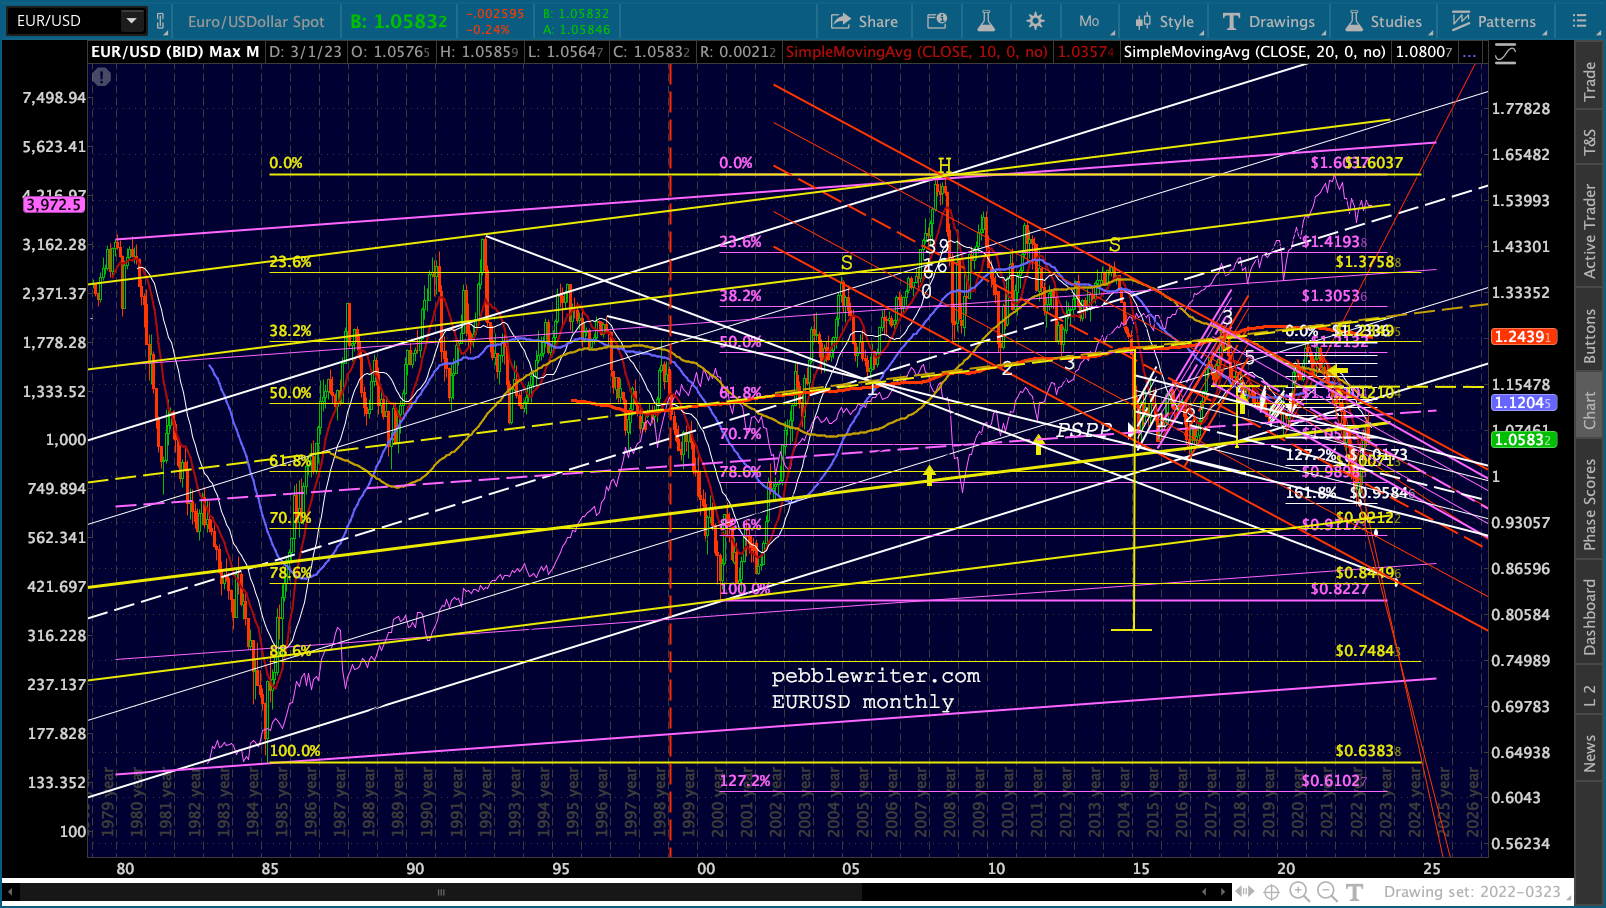
 This changed in April 2022, however, when the Russia invaded Ukraine. The yellow .236 line broke down and had since been backtested. The year-long breakout of the falling red channel(Aug 2020-Oct 2021) had driven much of equities’ gains and its demise presided over equities’ decline.
It was only the breakout from the steeply falling red channel in October 2022 that prevented stocks from cratering any further. Since then, EURUSD is course correcting back to the SMA200 (at least) and, depending on how things go with the war, it should continue lower. The caveat: If inflation in the US subsides to an acceptable level or the Fed simply gives up on 2% CPI, then a drop in US rates relative to euro-centric ones could further strengthen the euro and EURUSD could again test the yellow midline.
 I’m comfortable remaining short the pair until at least the SMA200. After than, we’ll reassess.
USDJPY:
With USDJPY, it’s mostly about the relationship with oil and the Nikkei. The BoJ has a very brazen policy to deflate the yen any time necessary in order to prop up stocks. Secondarily, they try to keep inflation at a reasonable level. The tension between these two can get intense.
 Breakouts in USDJPY and breakdowns in oil go hand in hand – the reason being that a much cheaper yen can’t purchase much oil – hence the need to manage both. The two most notable adjustments were 2014 and 2022. The 2014 one didn’t cause much of a problem with inflation, but the 2022 one was a different story.
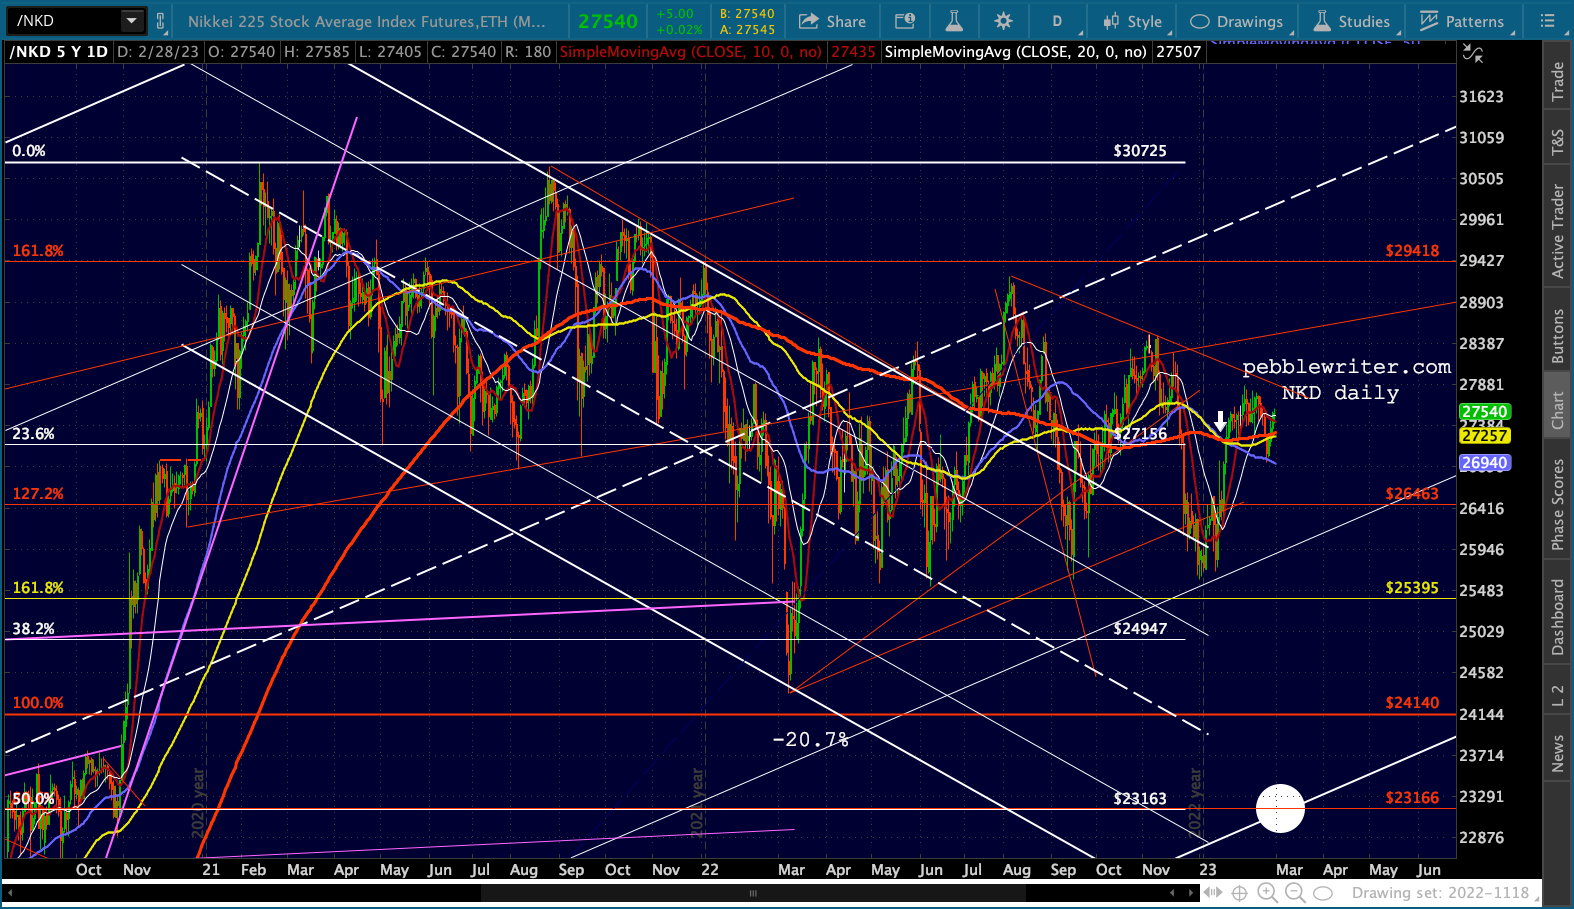
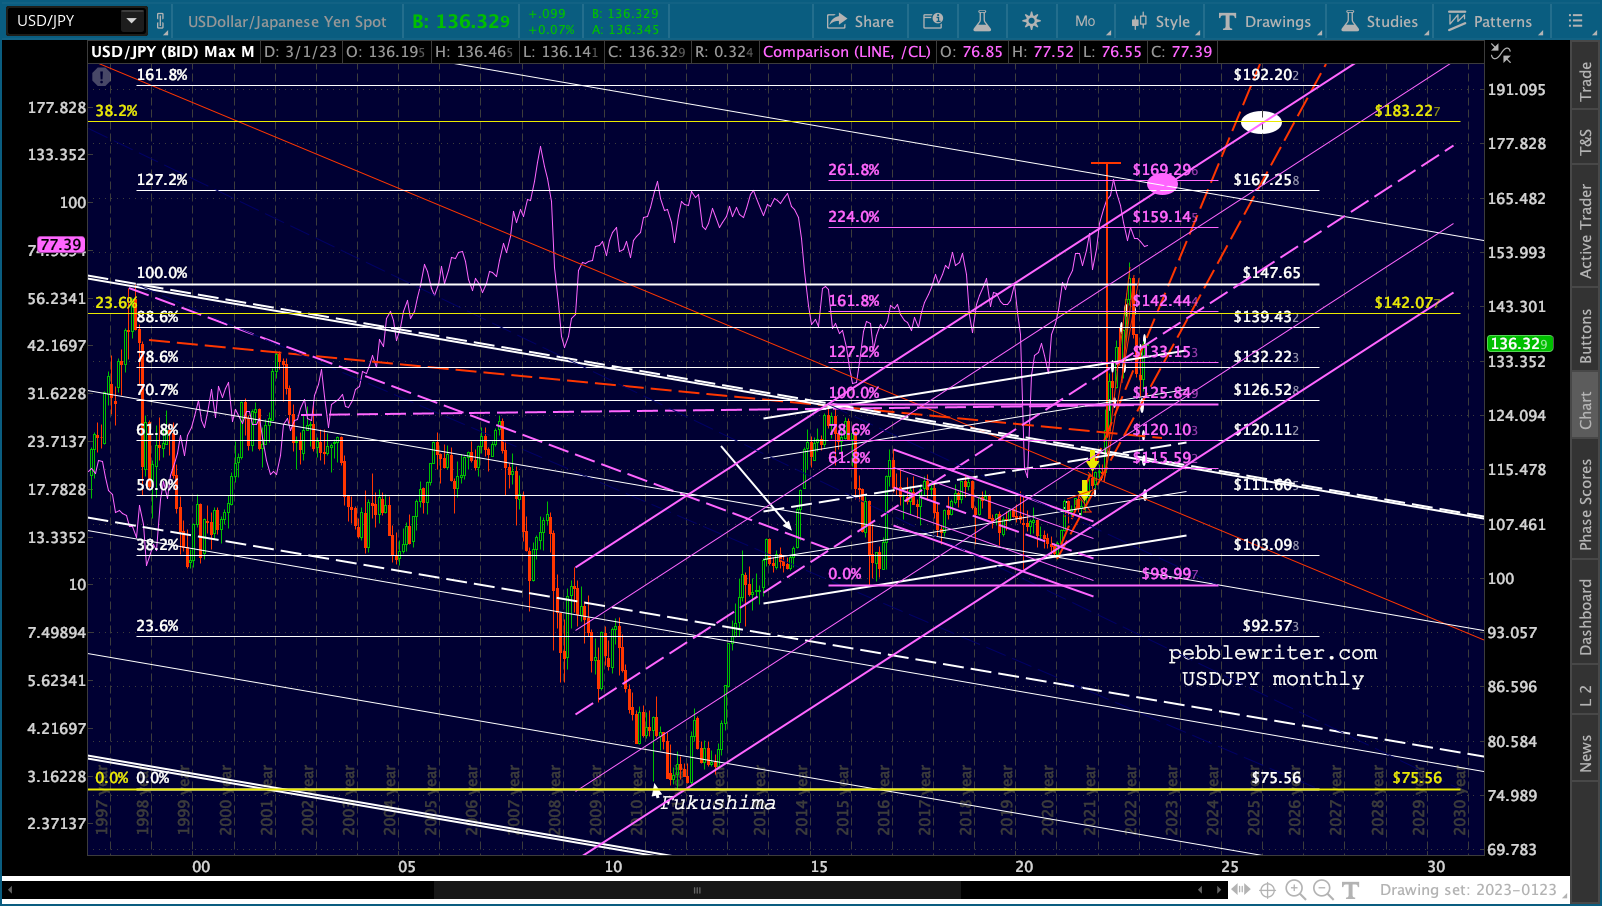 Rates have risen sharply, even in Japan. And, the enormous debt burden…well, people are starting to talk. In the absence of another big leg down in oil prices, the yen will have to appreciate more. The only problem is that this hurts the NKD [see: Yen Carry Trade.]
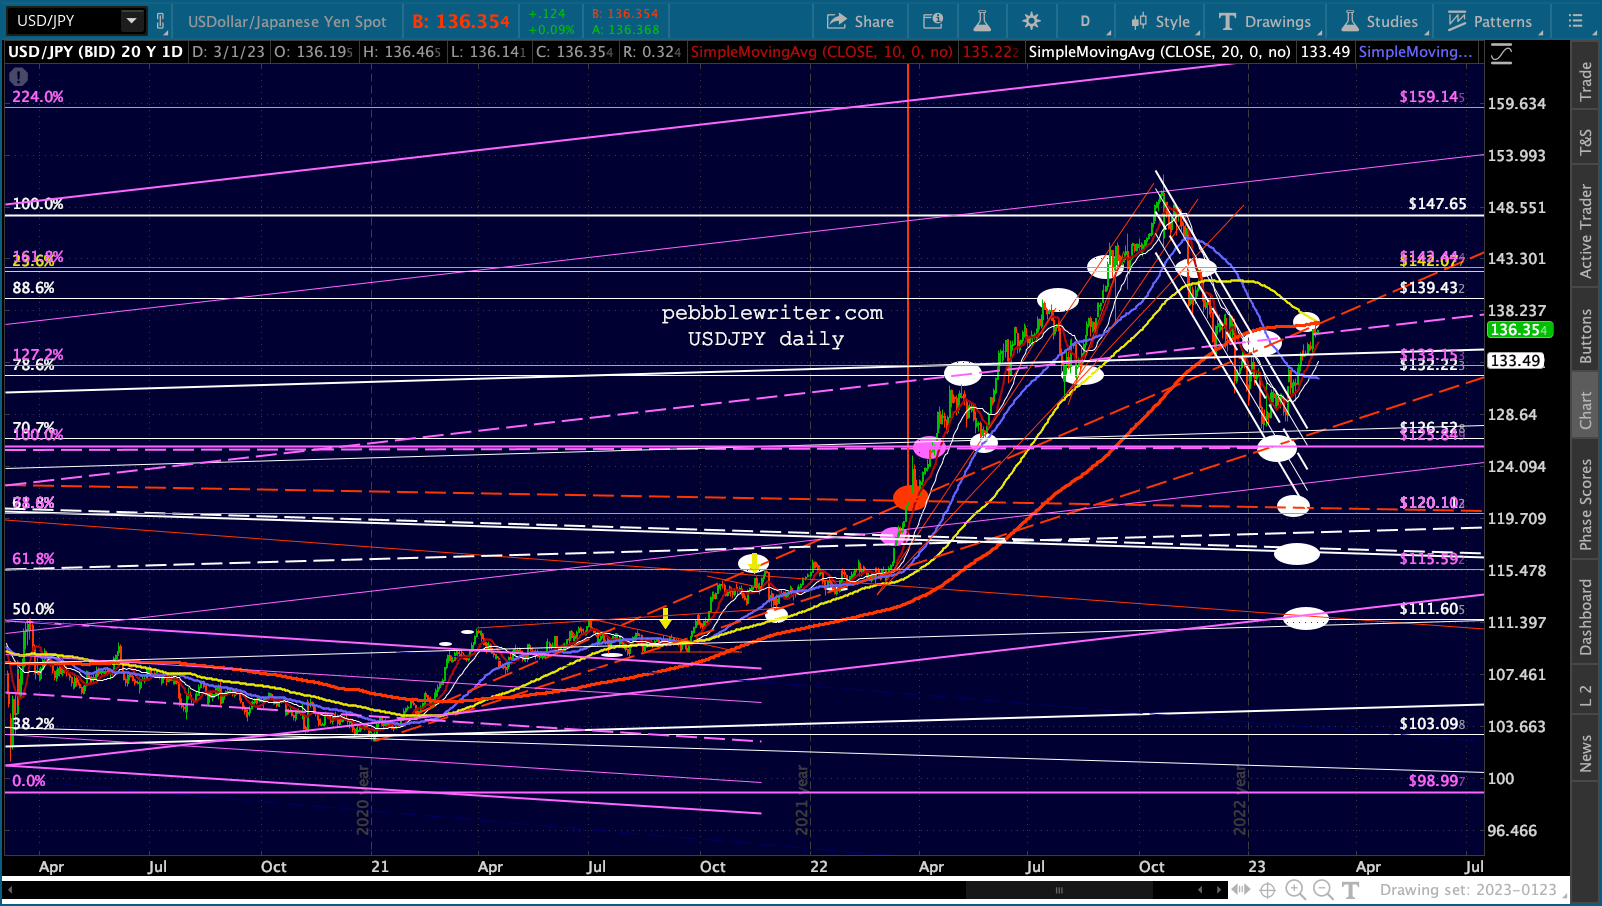
So, this one is tricky. With USDJPY coming up on its SMA200, it remains to be seen whether the gigantic inverted H&S patterns will play out. I think they will eventually, though it would be surprising to not see any reaction at the SMA200.
Therefore, I’m looking for a pullback at these levels but am fully prepared to go long again. The IH&S backtest is complete, and the BoJ is nothing if not determined to keep the NKD aloft.
 DXY:
DXY:
DXY’s breakout from the rising purple channel (Aug-Oct 2022) was a tough blow for stocks. Therefore, the goal since then has been to bring the DXY back to earth – tough to do unless rates come back down as discussed above.
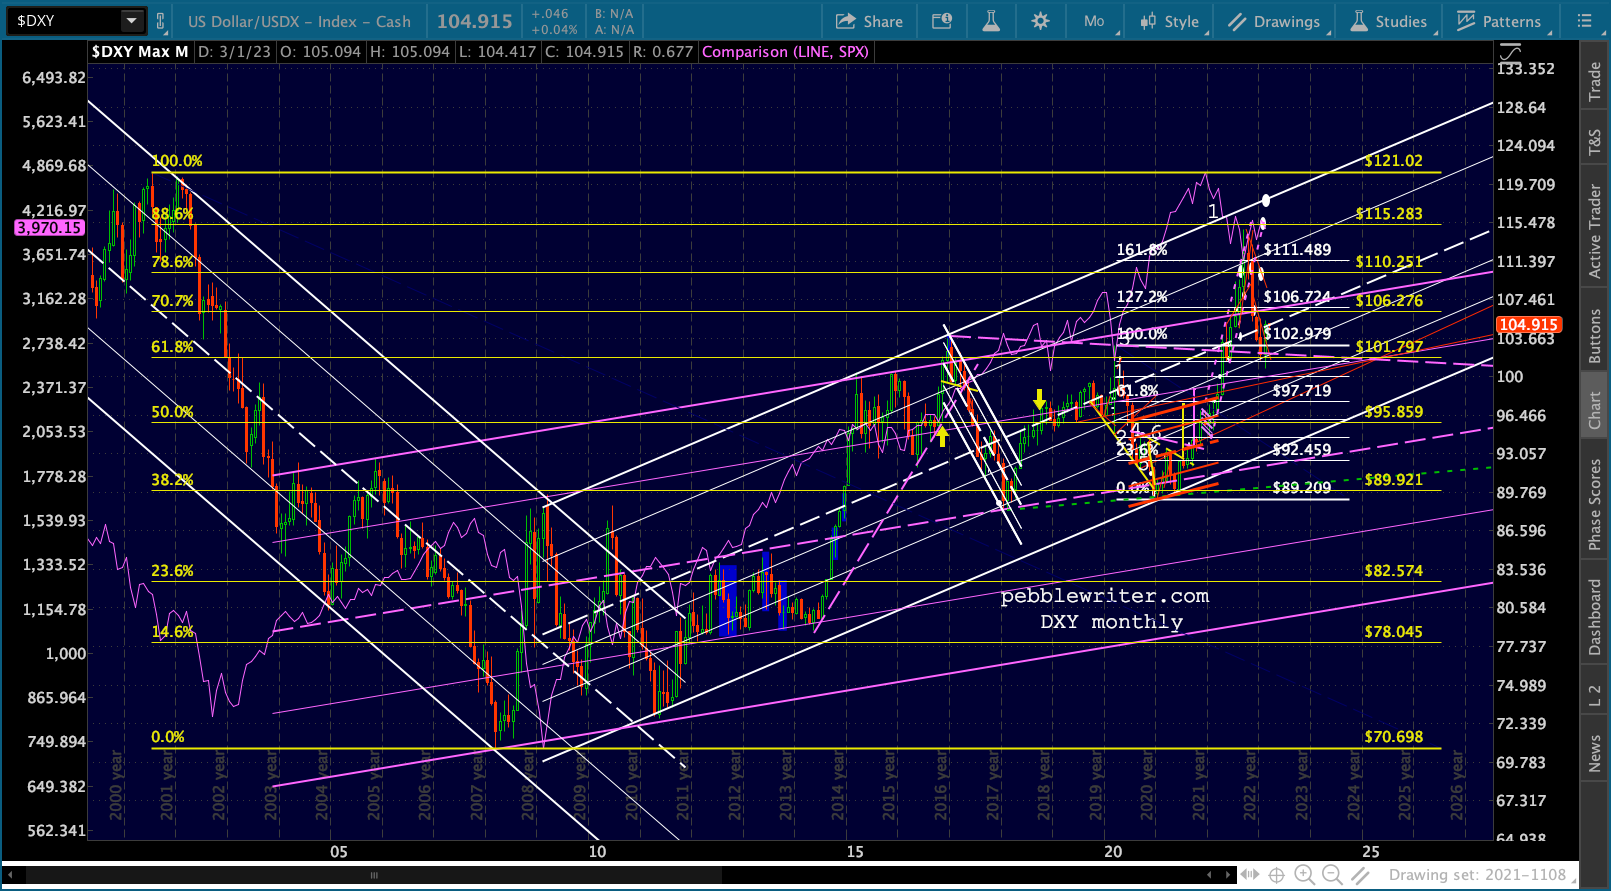 Still, as long as propping up stocks takes precedence, the downward pressure should remain a factor. I’m therefore thinking that DXY will continue to climb along the white channel midline until such time as we get another unavoidable downdraft in stocks. If the Fed can wrangle inflation, then it definitely has downside potential towards the bottom of the white channel.
  But, first things first. If it can stop rising by the time it reaches the SMA200 (106.45ish) then we’ll see. If it passes through the SMA200, then we’ve probably got a pretty ugly equity market going again.
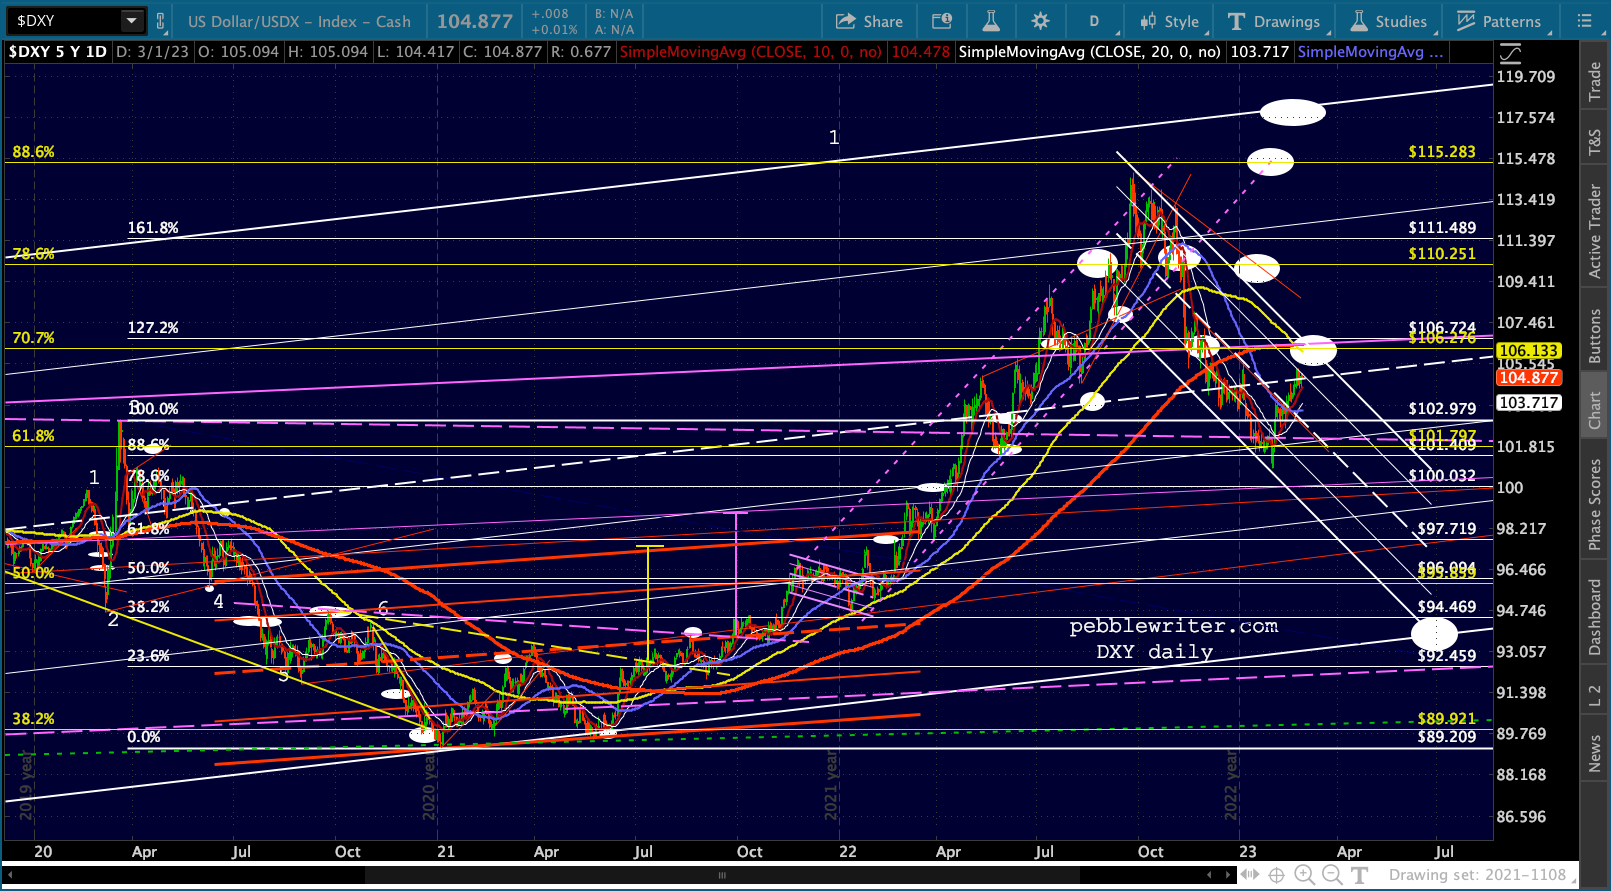 Stay tuned.