

The rising wedge we’ve been watching develop has made no further progress, but has merely extended as we approach OPEX Friday. With so much riding on whether it breaks down or breaks out, we’ll take a look at the big picture. One thing’s for sure: the next move will be measured in hundreds of points.
continued for members…
VIX has clearly broken down. 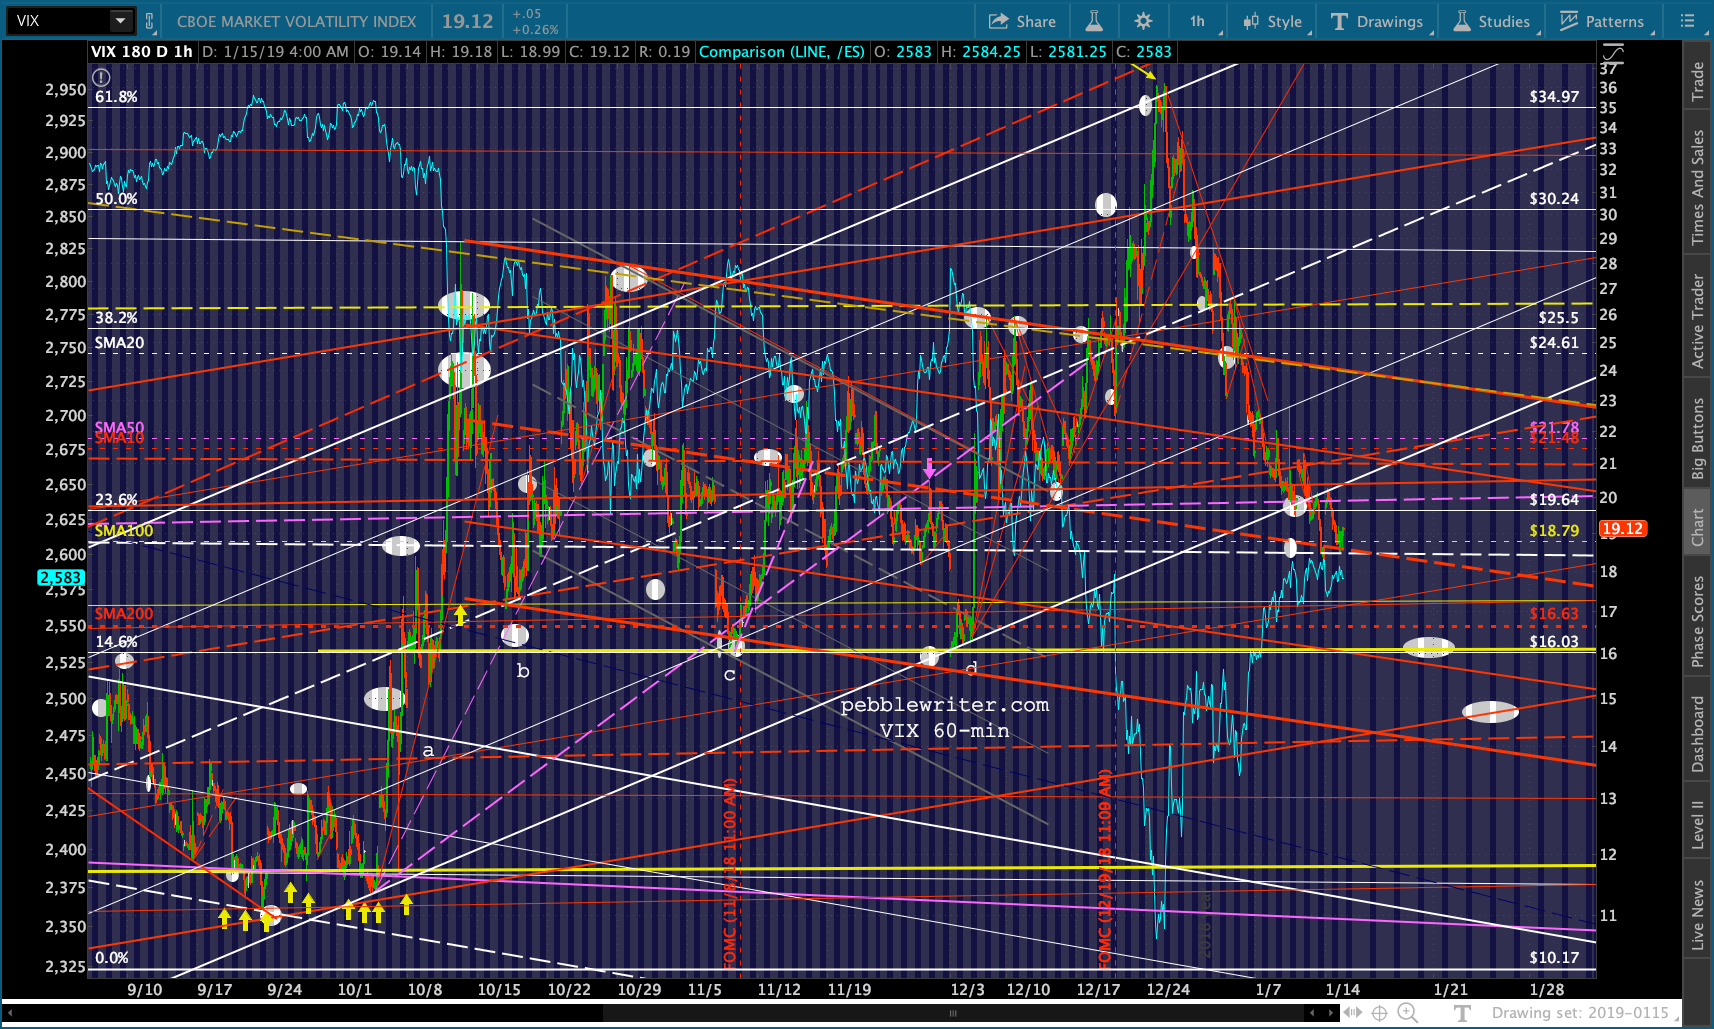 But, note the horizontal support at 16ish which has marked many market reversals. It’s presently below the SMA200, which means stocks would get a nice boost before it’s even reached.
The window is starting to close for the bears, as the channel leading to the .786 and .886 upside targets has broken down and the falling red fan line from the January highs has been breached. This doesn’t mean it can’t happen, merely that the odds are getting worse by the day.
 Even though SPX’s H&S Pattern completed, SPX never reached its target. It was cut short when the Plunge Protection Team crushed VIX. The fact that SPX moved back above the purple midline was another knife in the bear’s heart. The next would be a move back above the neckline at 2620ish. The final one would be a move back above the 2.24 Fib at 2703.62.
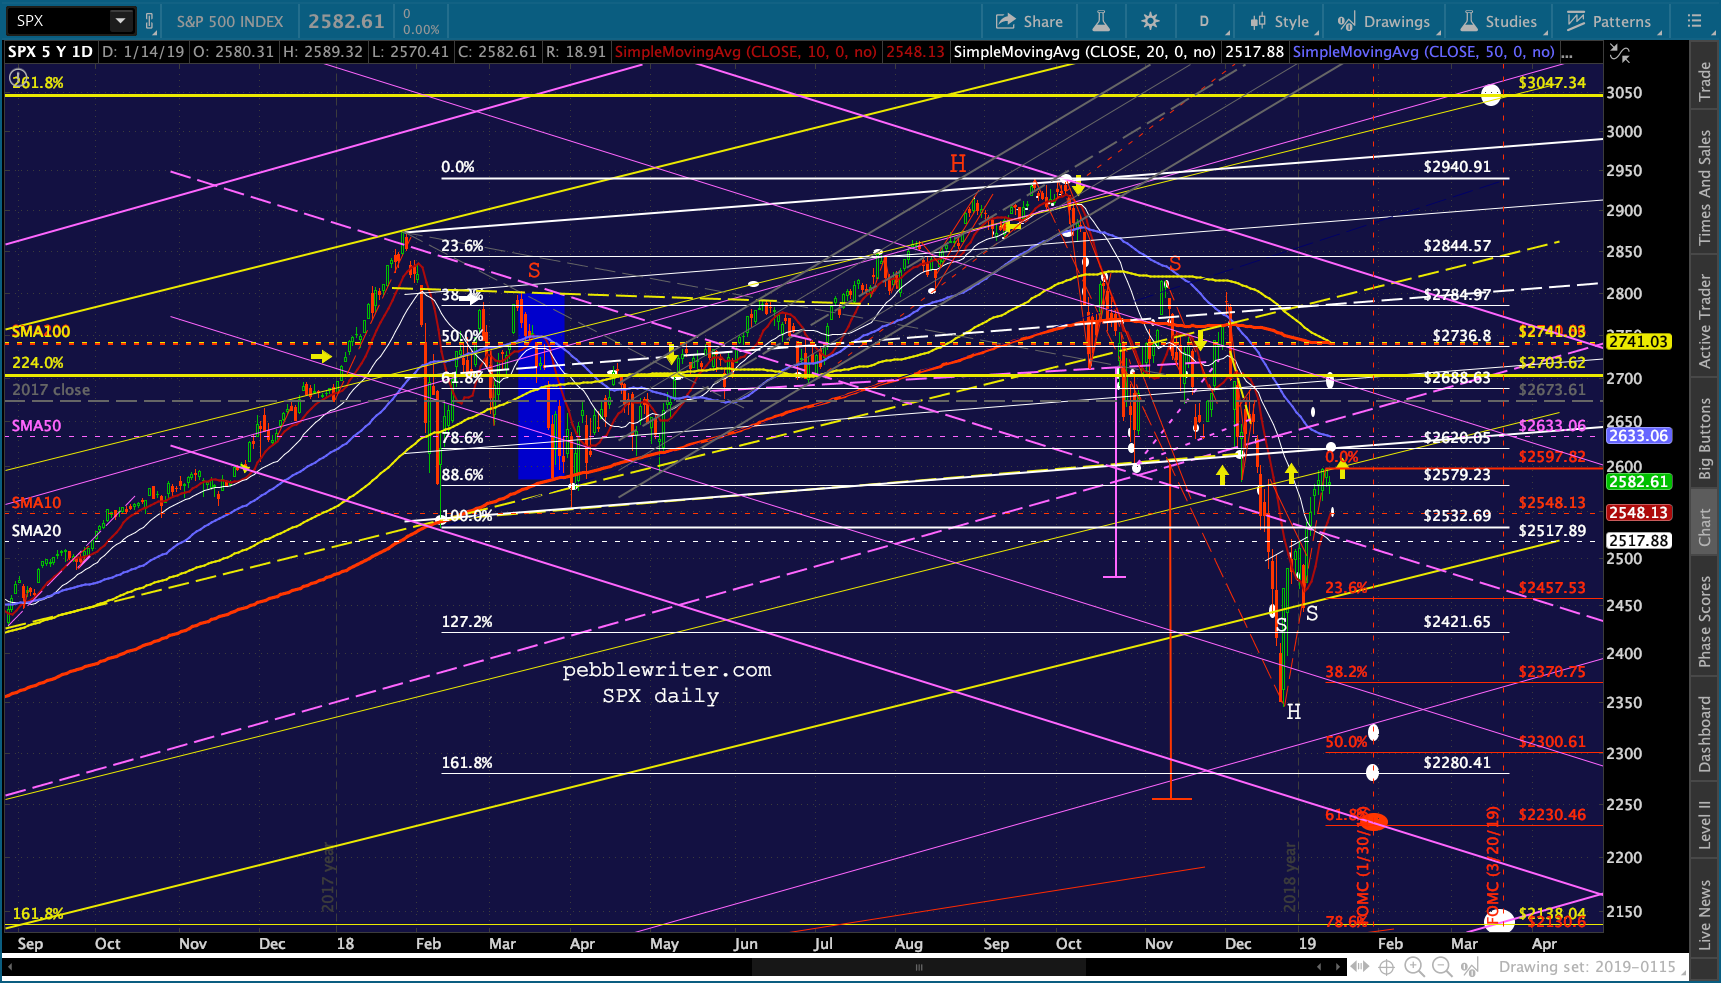 If SPX reverses before the neckline, then the bears’ hopes are still alive.
 And, so far, the PPT has done a great job – keeping the rising red channel below going despite CL/RB’s decline. If RB and CL can reverse at their channel bottoms, then stocks should be well supported.
 Then, there’s USDJPY’s ambivalence. Today, the central bankers decided to heat things up with a move above the purple TL that tested the gray channel top.
 Remember, the gray channel was rejoined on Jan 3 with the plunge to a lower low. Technically, it’s still a breakdown. But, the squiggles such as last night’s are offering a little help to the market, which still sees a stronger USD as bullish for stocks.
 Witness the latest dollar boosting reversal for EURUSD which has bought DXY some more time.
 So, we have all three algo drivers hard at work to keep stocks on the rise: oil/gas, VIX and USDJPY. The complication is that they are often employed to keep stocks rising through OPEX, which is Friday. If they keep the pressure on after 2620, then there are longer run bullish implications.
The one indicator we haven’t touched on yet is the yield curve model. It’s in a place, now, where a move in either direction signals a drop in stocks. A breakout of the dashed, red TL would be bearish, as would be a drop through the yellow TL.  I have to run out for a meeting this morning, but will continue later this afternoon with the bigger picture, especially as it relates to interest rates and inflation.
The 10Y yield ratcheted up from 1.226 in Jul 2017 to 3.248 in Oct 2018, topping out 2 days after the oil and gas peak on Oct 3.  They have since declined to as low as 2.55 on Jan 3 as it became quite apparent that inflation would not justify additional rate hikes.
 While the correlation between TNX and RB/CL is quite strong, TNX hasn’t fallen nearly as much as have RB/CL. There are several reasons for this.
First, the Fed and the administration know that a high dollar mitigates inflation which, up until six months ago at 2.95%, was a serious concern. As we’ve talked about many times, this forced an increase in interest rates that simply wasn’t sustainable.
 This convinced me that rates had to come back down, which convinced me that inflation had to come back down, which convinced me that oil and gas prices had to come back down.
Since then, the gas price YoY delta has plummeted to what is now a negative number. If January 2019’s average price of 2.1355 holds, it will represent a -15.5% change from January 2018. When charted against CPI, we can see that this will have a tremendous effect on CPI. There’s a very good chance inflation will drop below 1.5%, possibly much closer to 1%. The last time the delta was in this neighborhood, -15.98% in August 2016, CPI came in at 1.08%. TNX ranged from 1.47-1.63%, a good 100 bps below current levels.
 One last note on this before I move on… The gas price delta ran negative from Aug 2014 through Oct 2016.
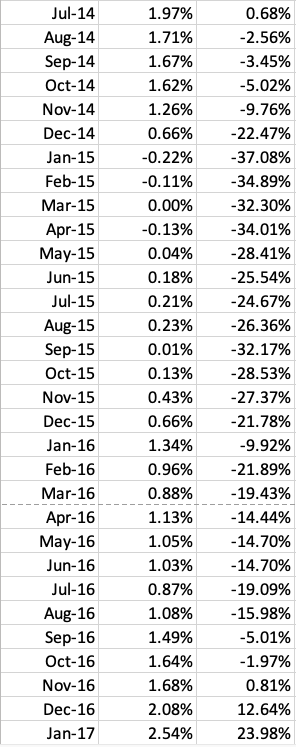 This was obviously a time when the market really struggled. It makes good fundamental sense: how can the economy be growing if inflation is near or below zero?
 If TPTB learned anything from that episode, it should be that oil and gas prices should move modestly higher now that CPI is back below 2%.
There were 20 months since Feb 2009 where CPI ranged from 1.8% to 2.2%, theoretically the sweet spot for the Fed. The average delta in gas prices during those 20 months was +10.4%.
A 10.4% increase in gas prices would mean a rise to 2.72 (Jan 2018) or 2.74 (Feb 2018.) In other words, a 27% increase from current prices. This would be equivalent to RB rising to about 1.79 from its current 1.41. Imagine that large a move!
Now, I suspect the Fed would keep right on tightening if inflation were to run 1.8-2.2%. But, at, say, 1.5-1.8%, they might be persuaded to hold steady. And, at that level, perhaps investors wouldn’t freak out over too low inflation.
Again, we’d have seen 20 such instances since Feb 2009. The average delta in gas prices, 13 of which were negative, would be negative 0.8%, suggesting a target price of about 2.45 – around a 14% increase in gas prices and an increase to about 1.61 for RB.
The folks pulling the levers have an agenda — CPI and 10Y interest rates in mind that they’d be happy with. Watching RB and CL should tell us where they’re headed, and watching CPI and TNX should tell us what to expect from RB and CL. At the moment, I suspect they’re waiting for the dust to settle. But, the weeks ahead should be quite interesting. At the very least, I suspect interest rates will continue to settle lower.
Second, interest rates and the value of the dollar don’t operate in a vacuum. The value of the yen and the euro, each of which is a function of insanely low interest rates and FX expectations in a heavily manipulated environment, push and pull on the USD and TNX.
If the BoJ and/or ECB lose control of their rates, we’ll see TSHTF in no time. For now, though, US rates are much lower than they might otherwise be due to the lack of serious competition for investment assets.
Why discuss all this? There are three primary levers for algos: oil & gas, USDJPY and VIX.
VIX can be pounded into submission with few repercussions as long as there’s no black swan type event to unleash it as occurred last year. The USD can hold its own with ease against the euro, and things have been going sideways since August for EURUSD. I think TPTB would be perfectly happy to keep it going sideways.
The yen, however, is susceptible to huge swings as we saw on Jan 3. Lots of hot money that all flows back into the yen when bad/scary things happen. Japan’s inflation came in at 0.8% for November and might reach zero or even negative in December. Obviously, when inflation gets too low, the yen has room to fall — which is good for stocks. But, a rise in the yen (drop in USDJPY) would drive inflation lower and nick stocks.
Oil and gas, as discussed above, have room to rise. But, I think the administration will keep the ROC low enough to ensure the Fed doesn’t start hiking again and, just maybe, cuts back on the balance sheet reduction.
I’m going to take a break for the night and resume this train of thought in the morning. SPX was up 27.69 on the day, a function of VIX making new lows… …USDJPY “breaking out”…
 and CL/RB not breaking down toward their obvious channel bottoms.

I suspect we’ll see more of the same over the next few days as SPX and ES draw ever closer to their necklines.
