

September retail sales sharply beat estimates, coming in at +1.9% versus 0.8% expected. With enhanced unemployment and virtually all other stimulus having dried up, however, this could be retail’s last hurrah.
 But, it’s enough to boost stock prices on this OPEX Friday 2 1/2 weeks before a presidential election.
continued for members…
The deets:
 The 10Y, which had already bounced at support yesterday, popped on the news…
 …as did the 2s10s, which is backtesting the latest red TL.
 Notably, the DXY didn’t react much at all. It is still in backtest mode, along with EURUSD and USDJPY.


 A quick detour here re USDJPY – note that Japan CPI is trending higher over the past several months as the yen is continually devalued (increase in USDJPY.) A higher yen is the key to keeping inflation and, thus, interest rates under control.


 Unfortunately, a higher yen (lower USDJPY) is bad for the Japanese stock market. Note that the NKD is trying desperately to hold on to a rising wedge.
 The next leg down in the USDJPY should undo NKD’s rise above its .886. A 6.5% drop to NKD’s SMA200 would equate to a drop to SPX 3253, a favorite downside target of mine and one which I believe TPTB would find an acceptable backtest of the falling white channel that SPX recently broke out of (courtesy of the continuing assault on VIX.)


 Note that VIX is yet again positioned for a algo-boosting “breakdown.”
 The biggest problem with Japanese CPI is usually oil and gas – all of which is imported. So, this is as good a time as any to review where things stand. I usually post 60-min charts in order to better detect the squiggles. Today, we’ll look at the daily charts in order to better see the moving averages.
First, note that CL is still in backtest mode – having tagged the midline of the falling purple channel and going no further.
 The intial channel higher broke down, but prices haven’t really gone much of anywhere – not even a 23.6% retracement of the rally. Note that the 10,20, 50, 100 and 200-day moving averages are all converging into a very tight range.
 This is typical of a very tightly controlled market, which is certainly the case when transportation and economic activity has been crushed as Libya restarts production and OPEC relaxes production cuts put into place earlier this year.
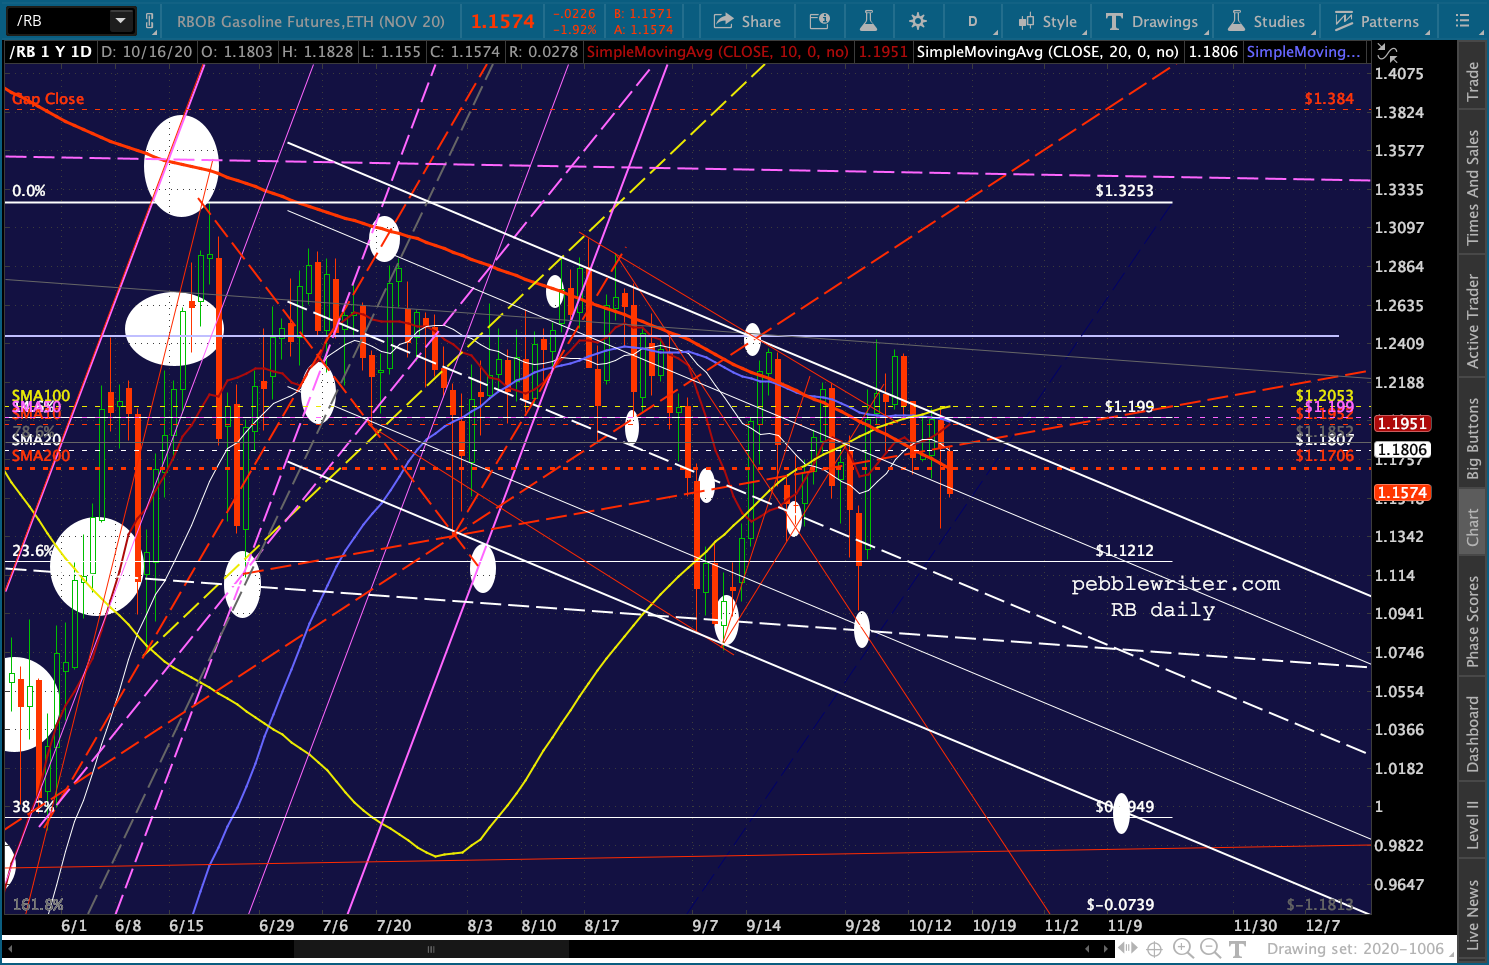
RB’s chart isn’t much different. Though gas prices have a more direct impact on CPI and, will thus be more carefully managed lower in order to ensure low interest rates for the foreseeable future.
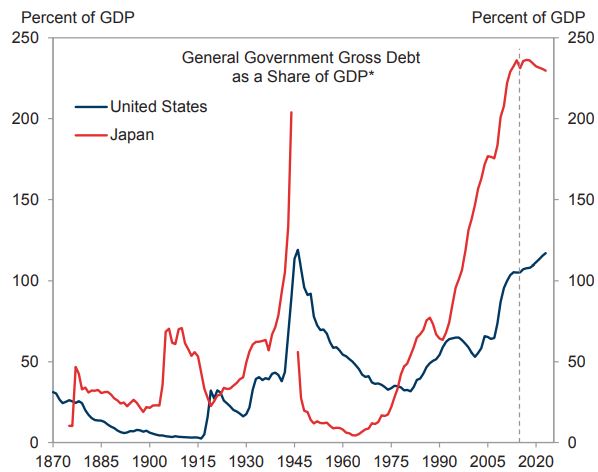
 It wouldn’t matter so much if debt weren’t exploding higher, with no end in sight.
UPDATE: 3:30 PM
The holding pattern continues, with USDJPY remaining just high enough and VIX having broken down just low enough to try and keep stocks in the green. It’s still looking like a selloff from here to me, with 50/50 odds of closing in the red.


