

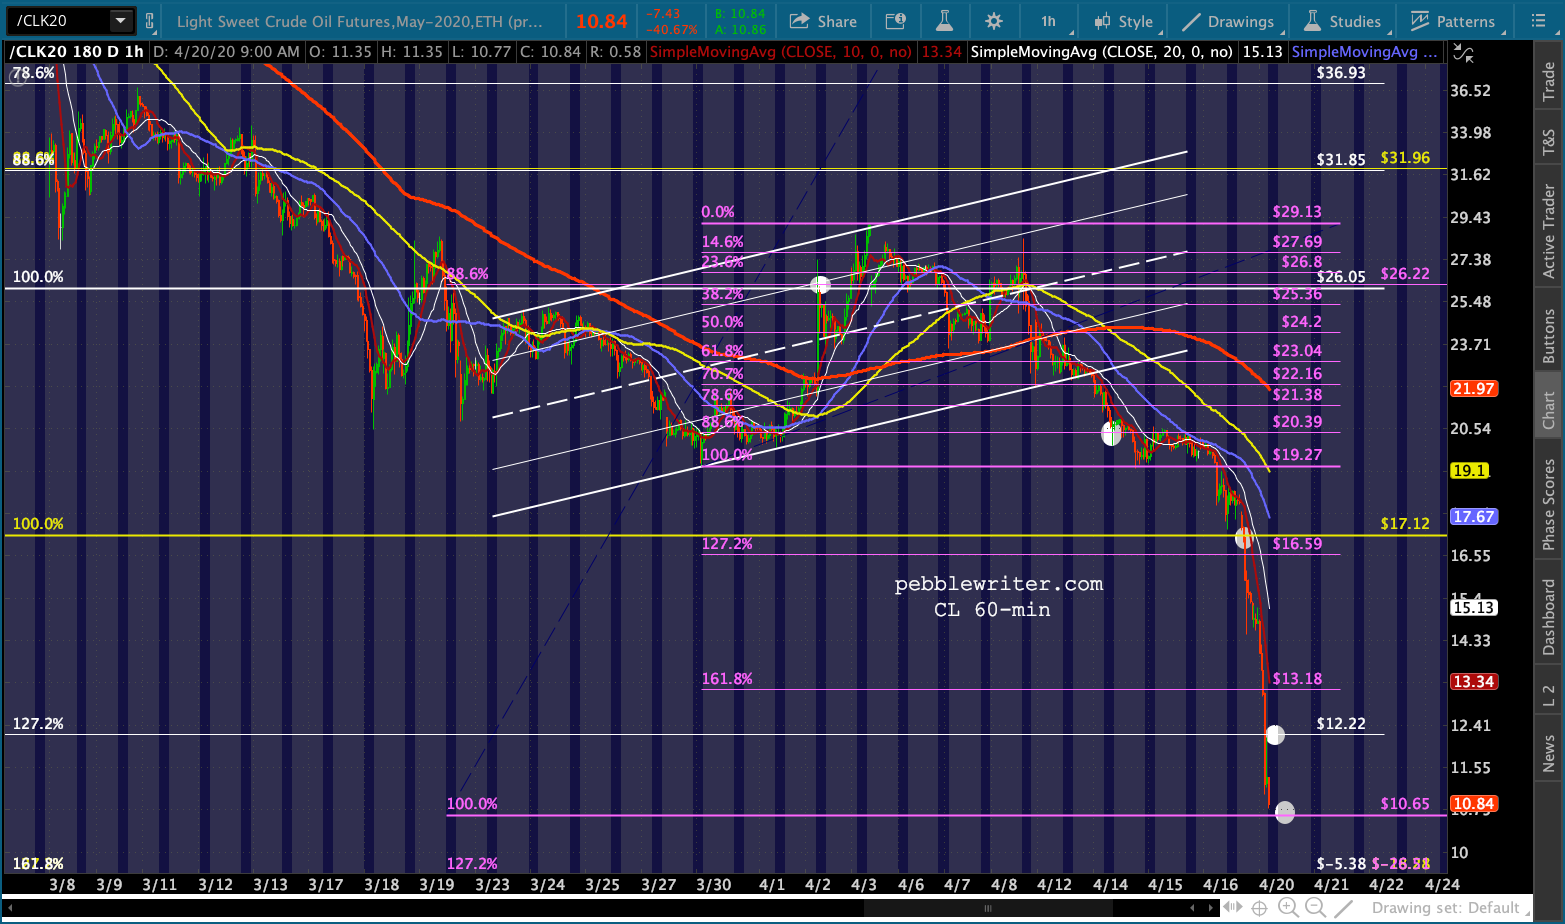
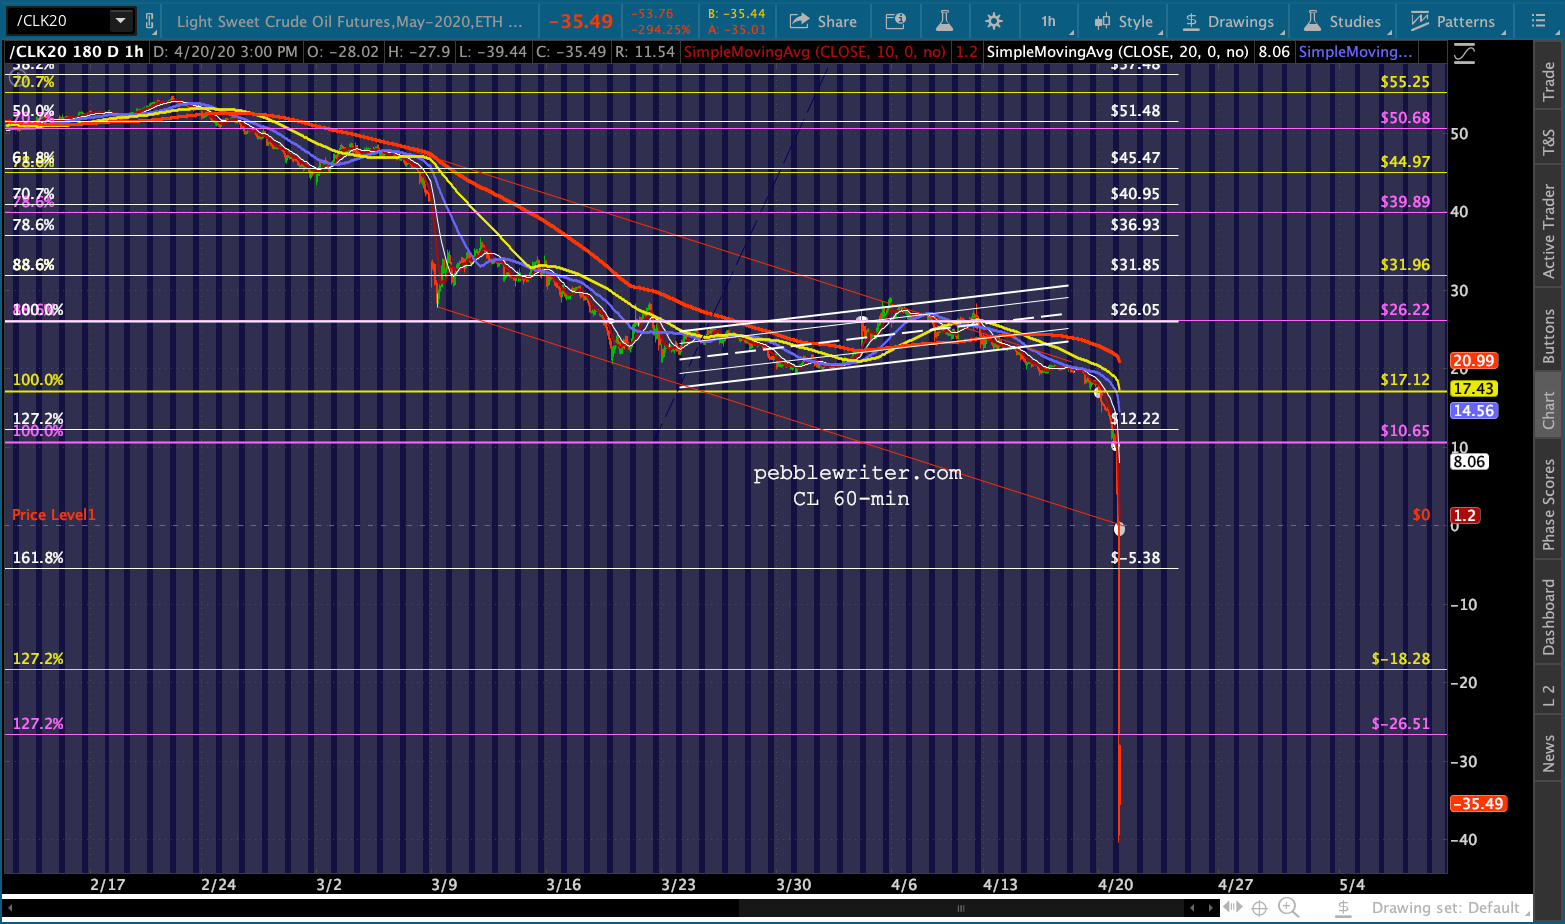
May WTI futures are off almost 35% since Friday’s close.  This drops it below the 17.12 target we first identified in March 2019 when, at 59.32, CL had completed a rising wedge and tagged multiple channel lines.
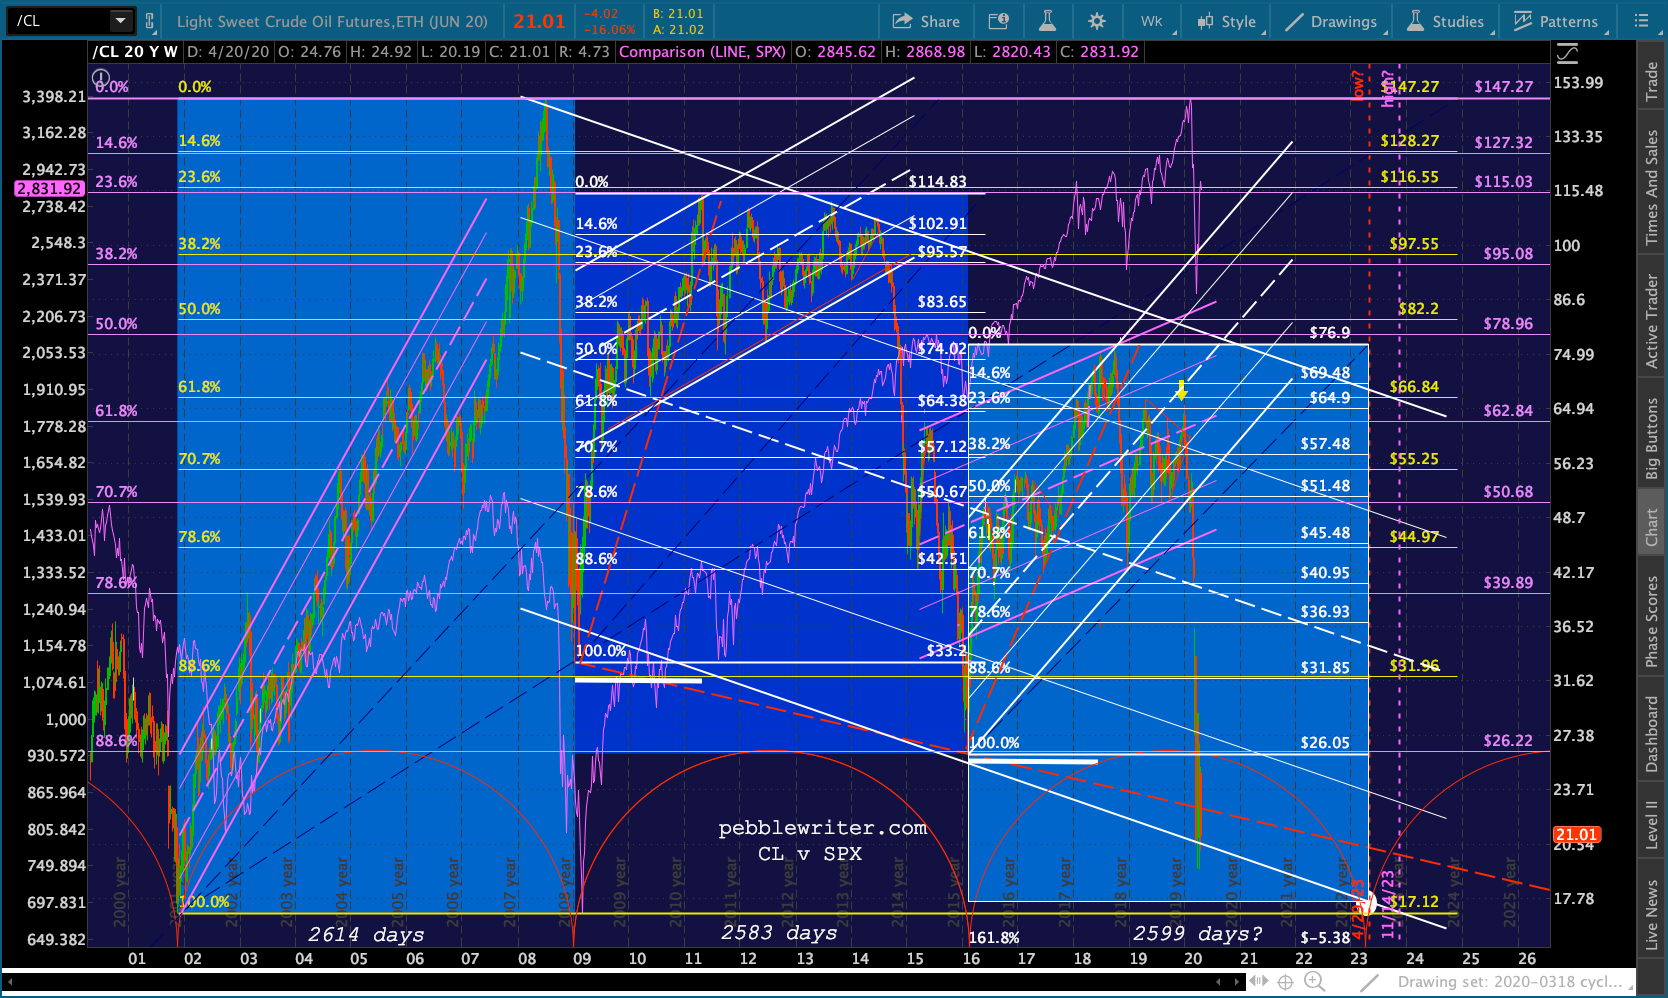
 Members might recall the 17.12 target was originally set for April 2023 in keeping with a March 2019 cycle study [see: Macro Factor Cycles and Regime Shifts.] The chart patterns and Fib levels fit nicely with the concept of a recurring 2600-day cycle for significant lows.
 We’ve reiterated the 17.12 target many times, including last December as CL finished on a high note after plunging 45% in the wake of Jamal Khashoggi’s Oct 2018 murder (when the US achieved maximum leverage over the Saudis – see: Coincidences and Consequences.) The last significant bounce accommodated both the Aramco IPO and the year-end equity ramp.
 Oil has been a favorite tool of not only the Saudis but also central bankers and politicians. In fact, understanding the relationship between oil/gas and inflation, interest rates and equity valuations has made it possible to accurately forecast most of its major moves over the years.
At times, this has meant ignoring the frequently misleading supply/demand data, OPEC deliberations, and presidential tweets and focusing instead on where central bankers needed oil/gas to go in order to achieve a particular inflation and interest rate goals.
As interest rates rose over the past few years, for instance, it became obvious that inflation would need to moderate to relieve the building budgetary pressure.
 One major theme on which we’ve focused since calling the top on interest rates in October 2018 [see: Suddenly Interest Rates Matter] has been the relationship between CPI and the YoY delta in gas prices. By “managing” the price of RBOB, CPI and, thus, interest rates could be managed higher or lower as needed.
 This was a very reliable theme for most of 2018, 2019, and early 2020 – when the focus shifted to oil’s strong correlation to stock prices.
Oil has long been a major factor in triggering algos to bid up stocks. So, when oil’s major channel from 2016 broke down in February, we knew stocks were in deep trouble.
With CL dropping through its 2001 lows and approaching its 1998 lows, what might we expect from oil and what are the implications for stocks? As we discussed last week:
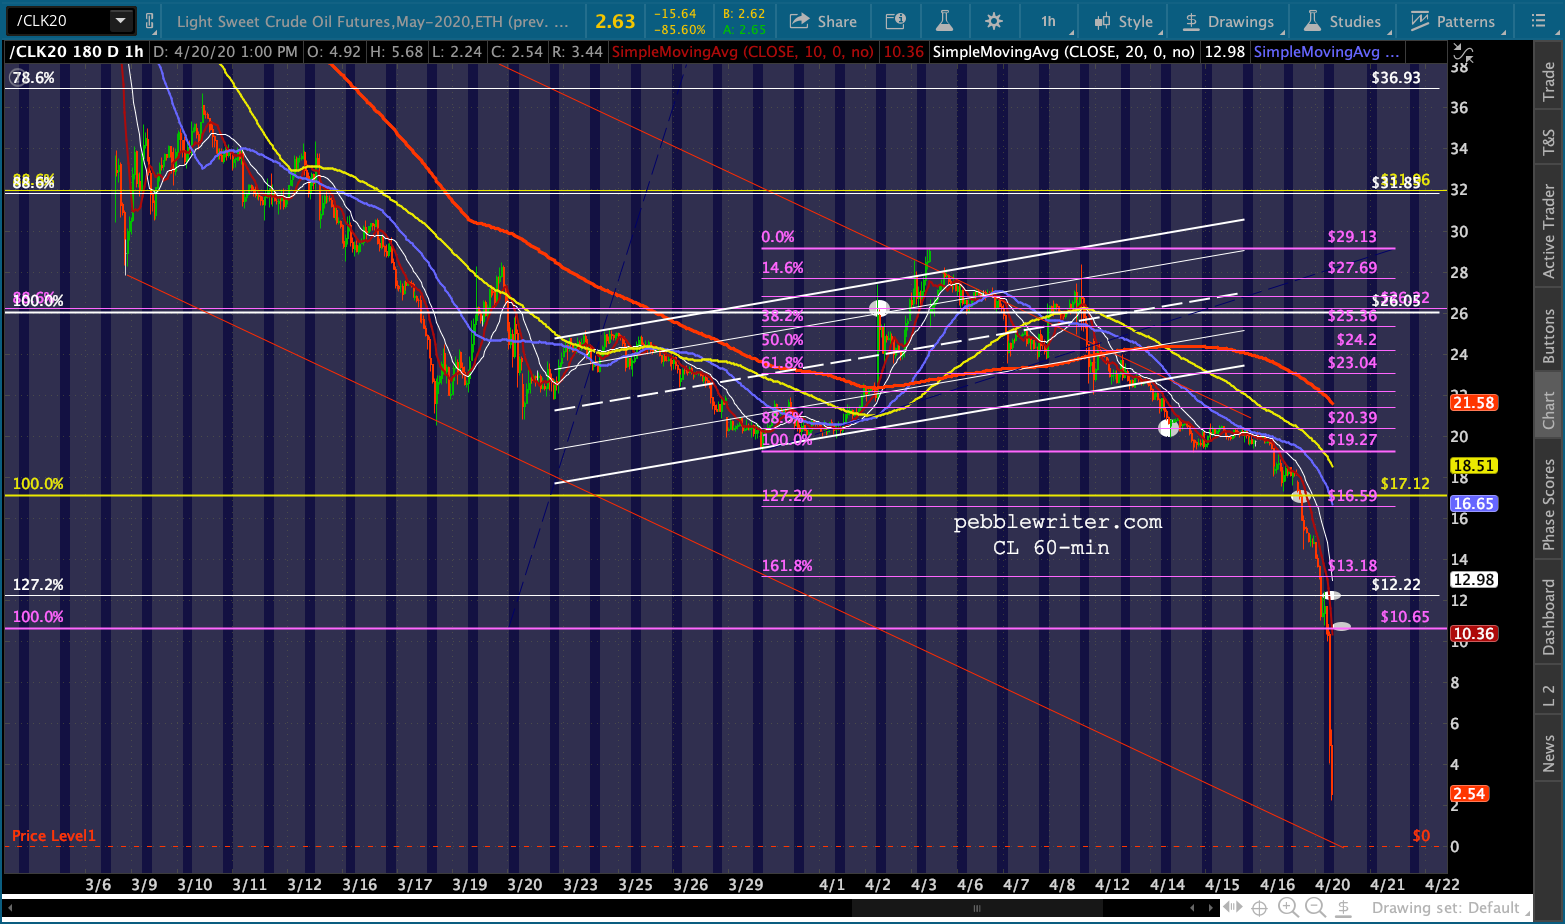
A drop through 19.27 would be reason enough to revert to short with 17.12 and 10.65 the only support between here and zero.
continued for members…
First, it’s important to distinguish between the May and June contracts and, as we discussed last week, to recognize the deep contango in the futures curve.
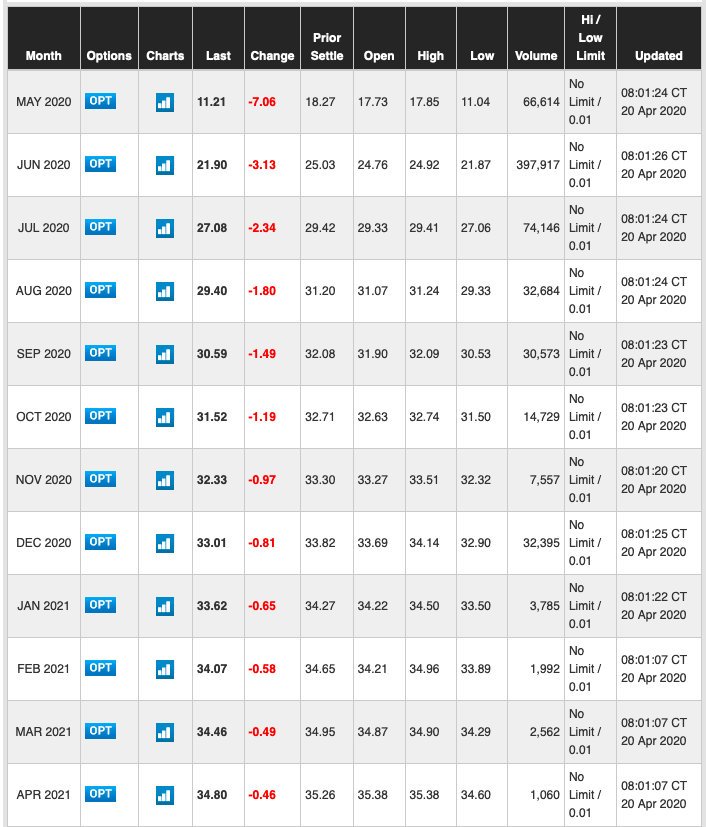 The May contract expires tomorrow. We would normally expect the May and June contracts to converge on expiration date, but in this case they’re not even close. The reason is that anyone taking delivery right now would find it next to impossible to find a place to store it. It might as well be radioactive.
The June contract, by contrast, offers at least the hope of a return to normalcy. The upshot is that as low as things might go today and tomorrow, we should expect a rebound. Bottom line, it’s time to take profits on shorts.
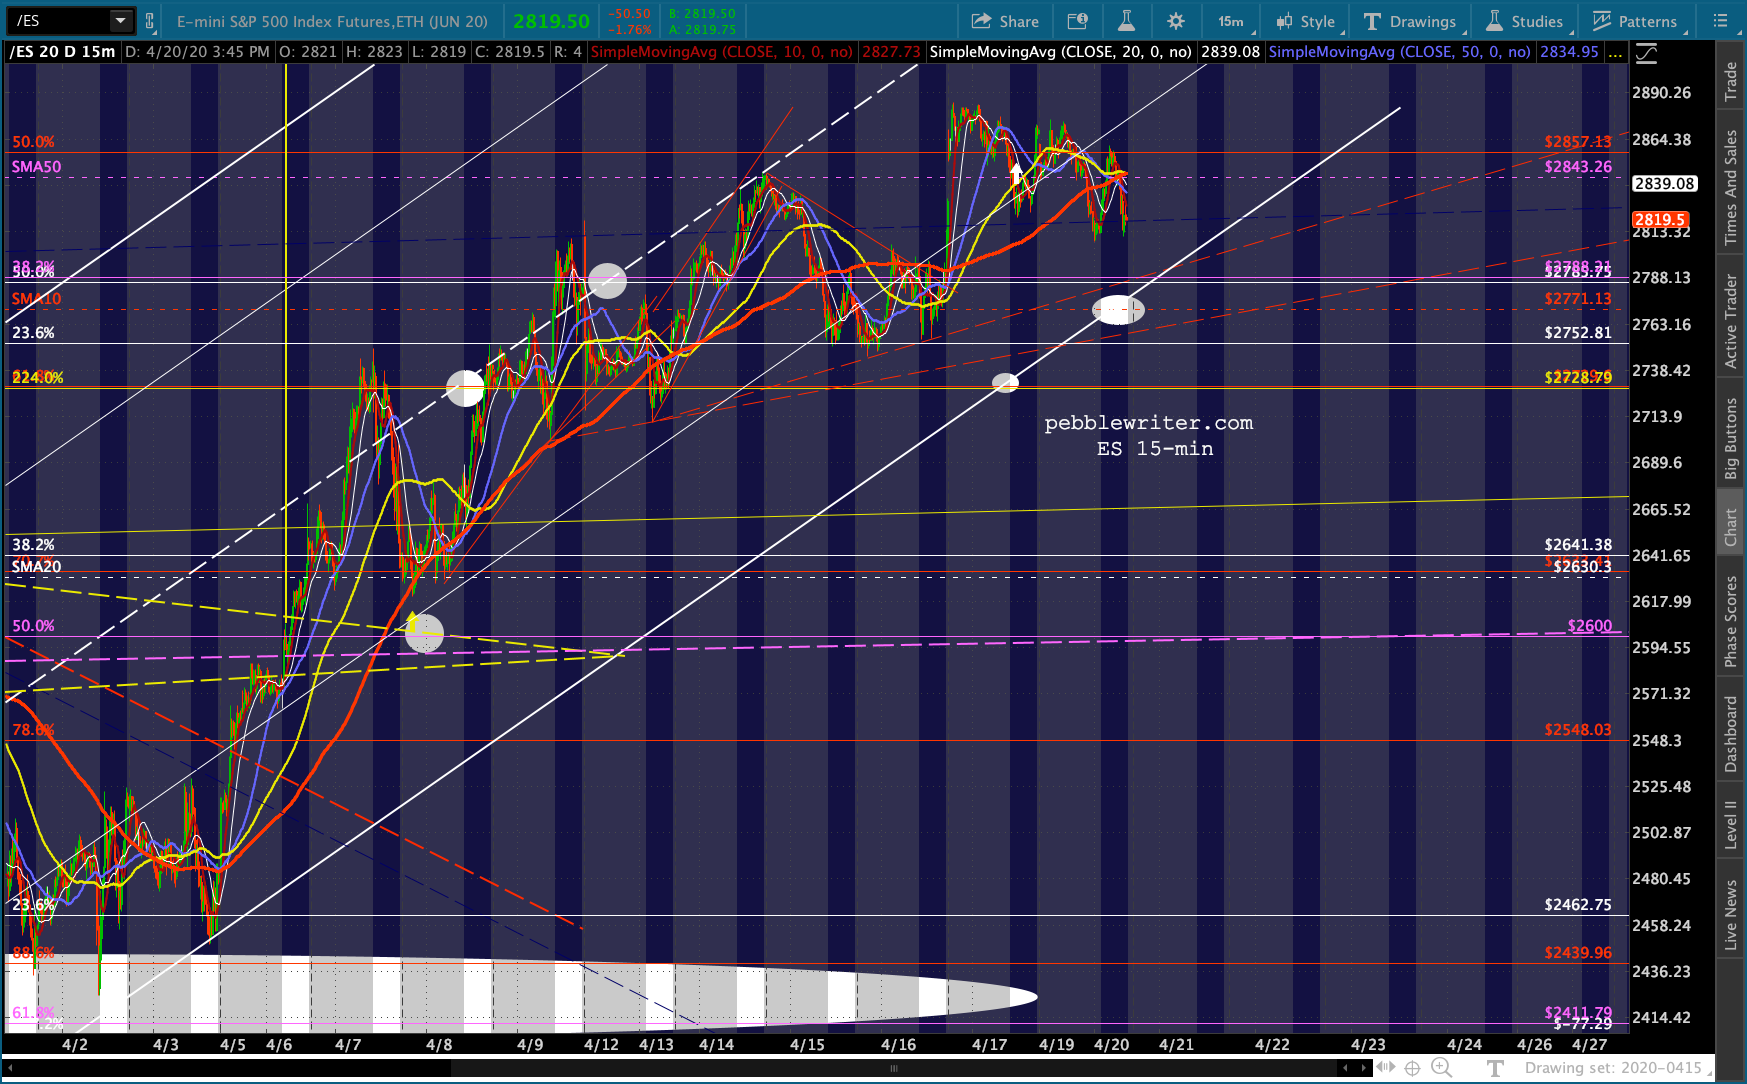
 Will it reach 10.65 or lower? Probably. ES seems intent on backtesting either the latest TL or even the white channel bottom at the SMA10 of 2771.13 and an additional drop in oil would accommodate that. Note, however, that ES’ SMA10 has been rising around 35 points per day. If it can hold its current lows, tomorrow’s support could rise to 2800ish.
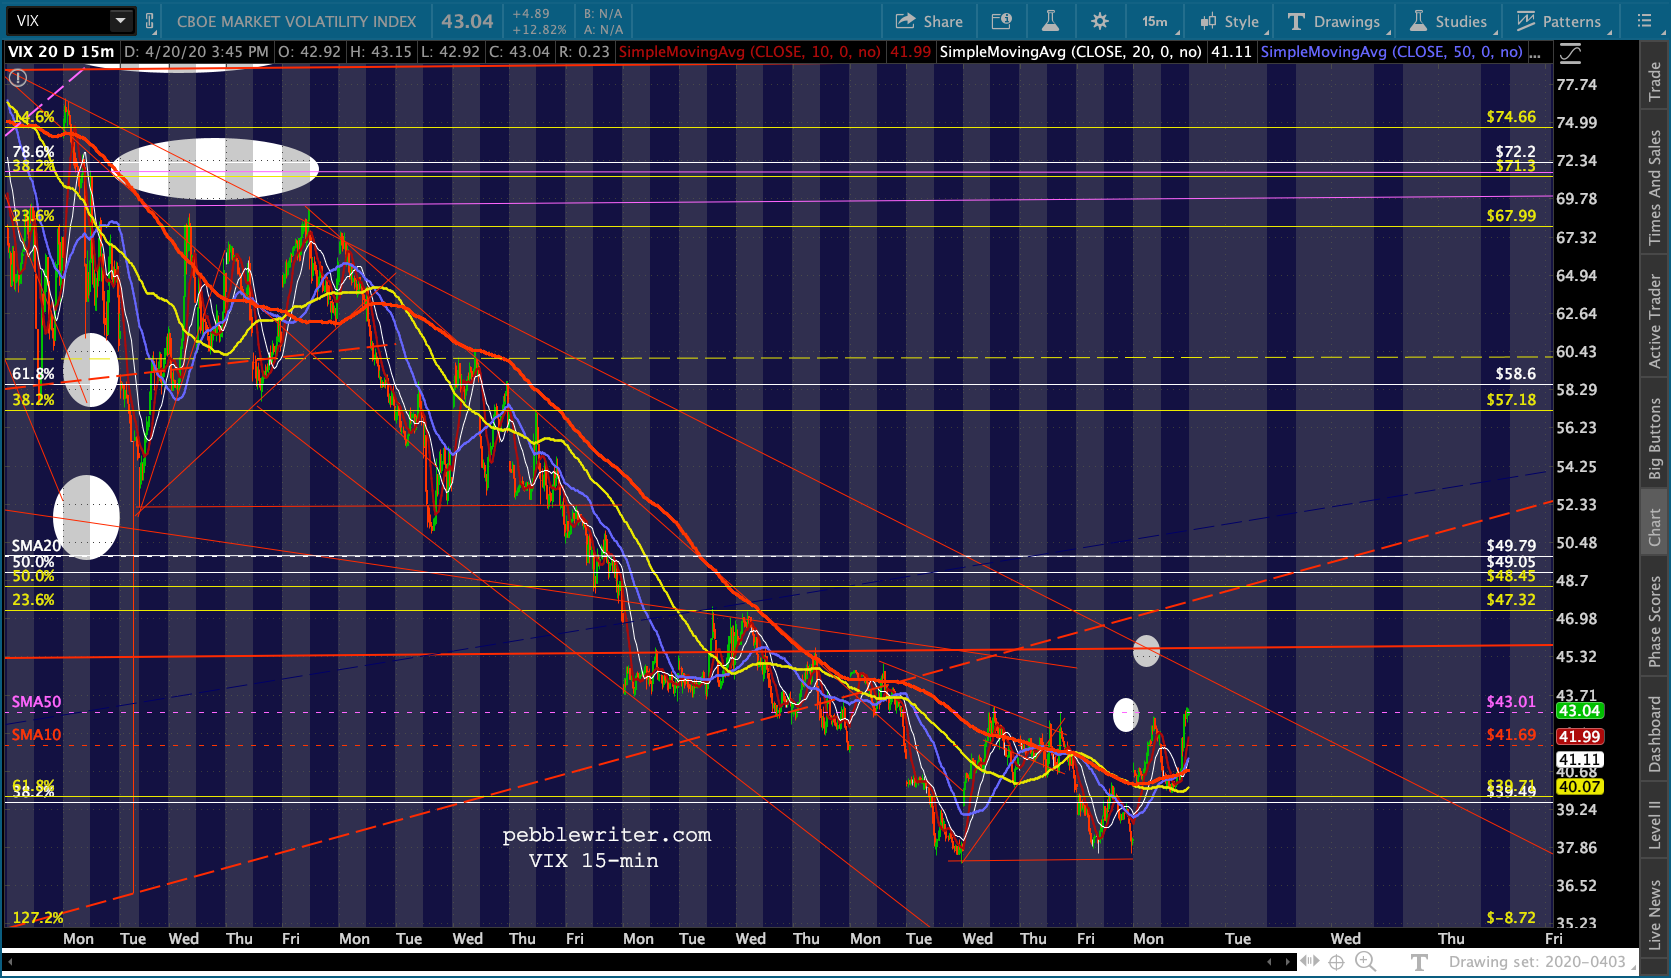
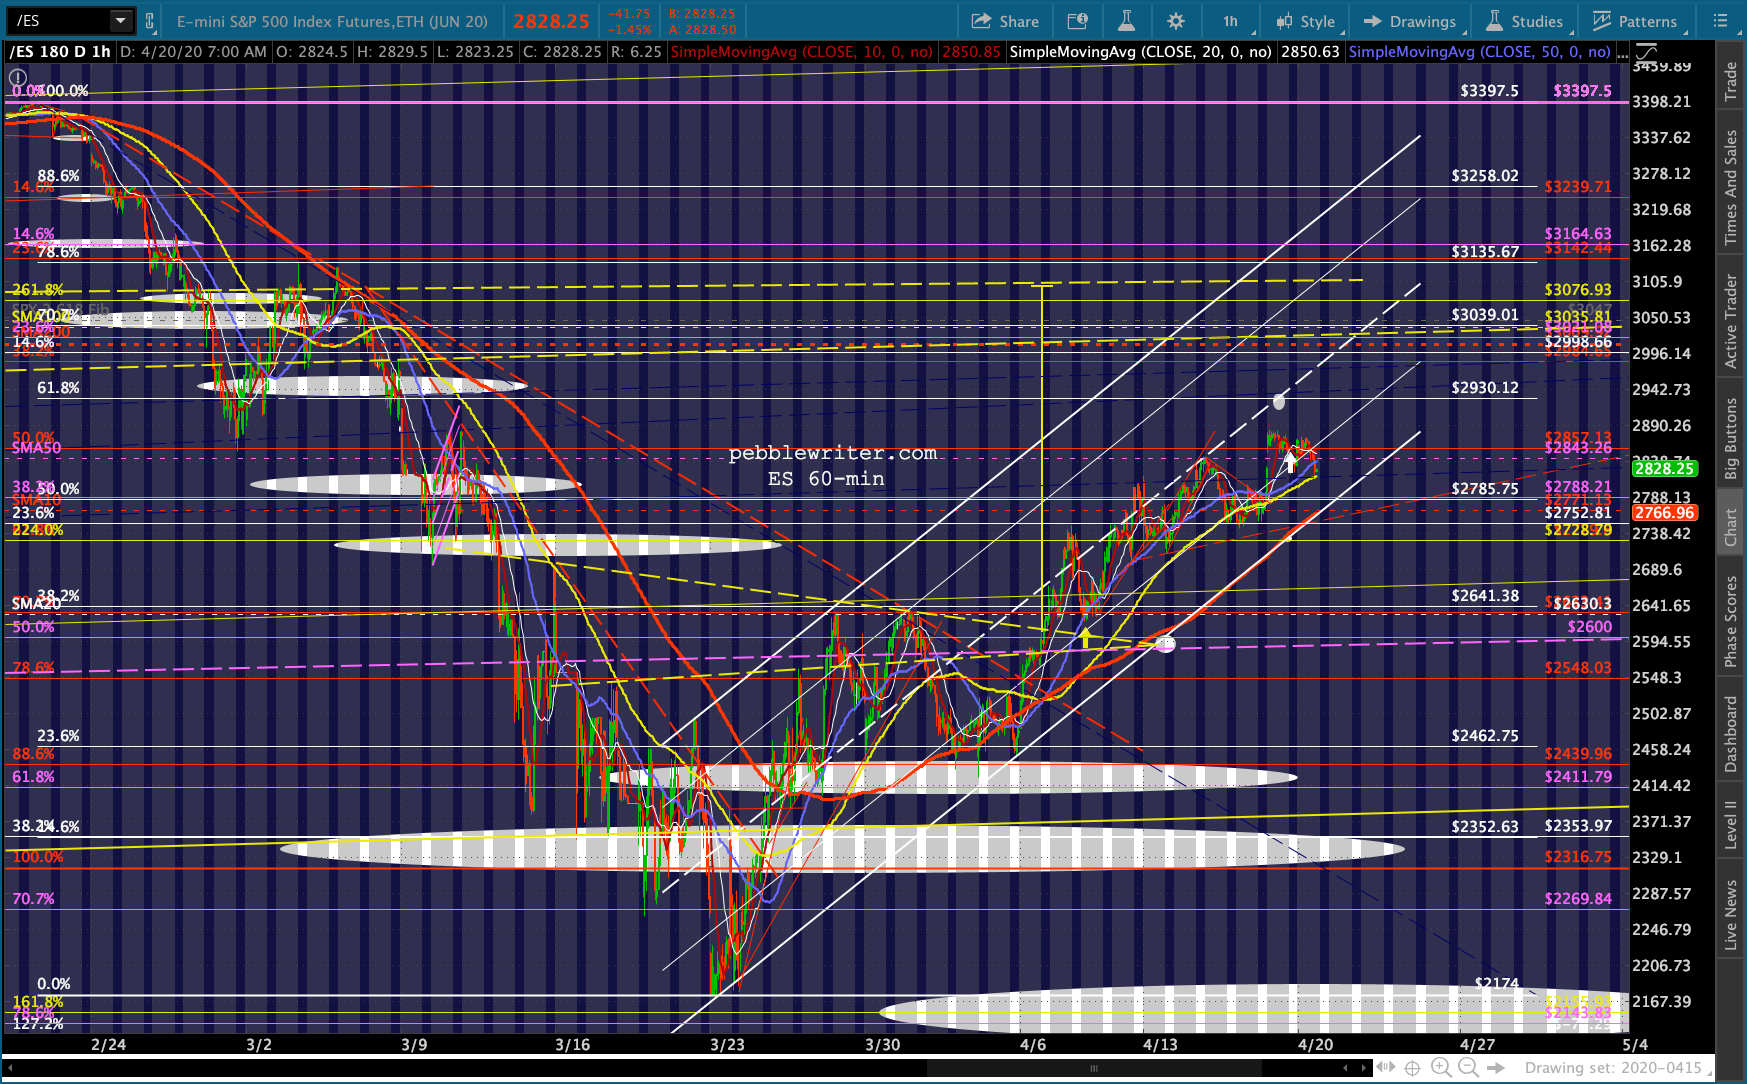 VIX continues to support at least a small correction – having room to bounce in order to help ES reach that target.
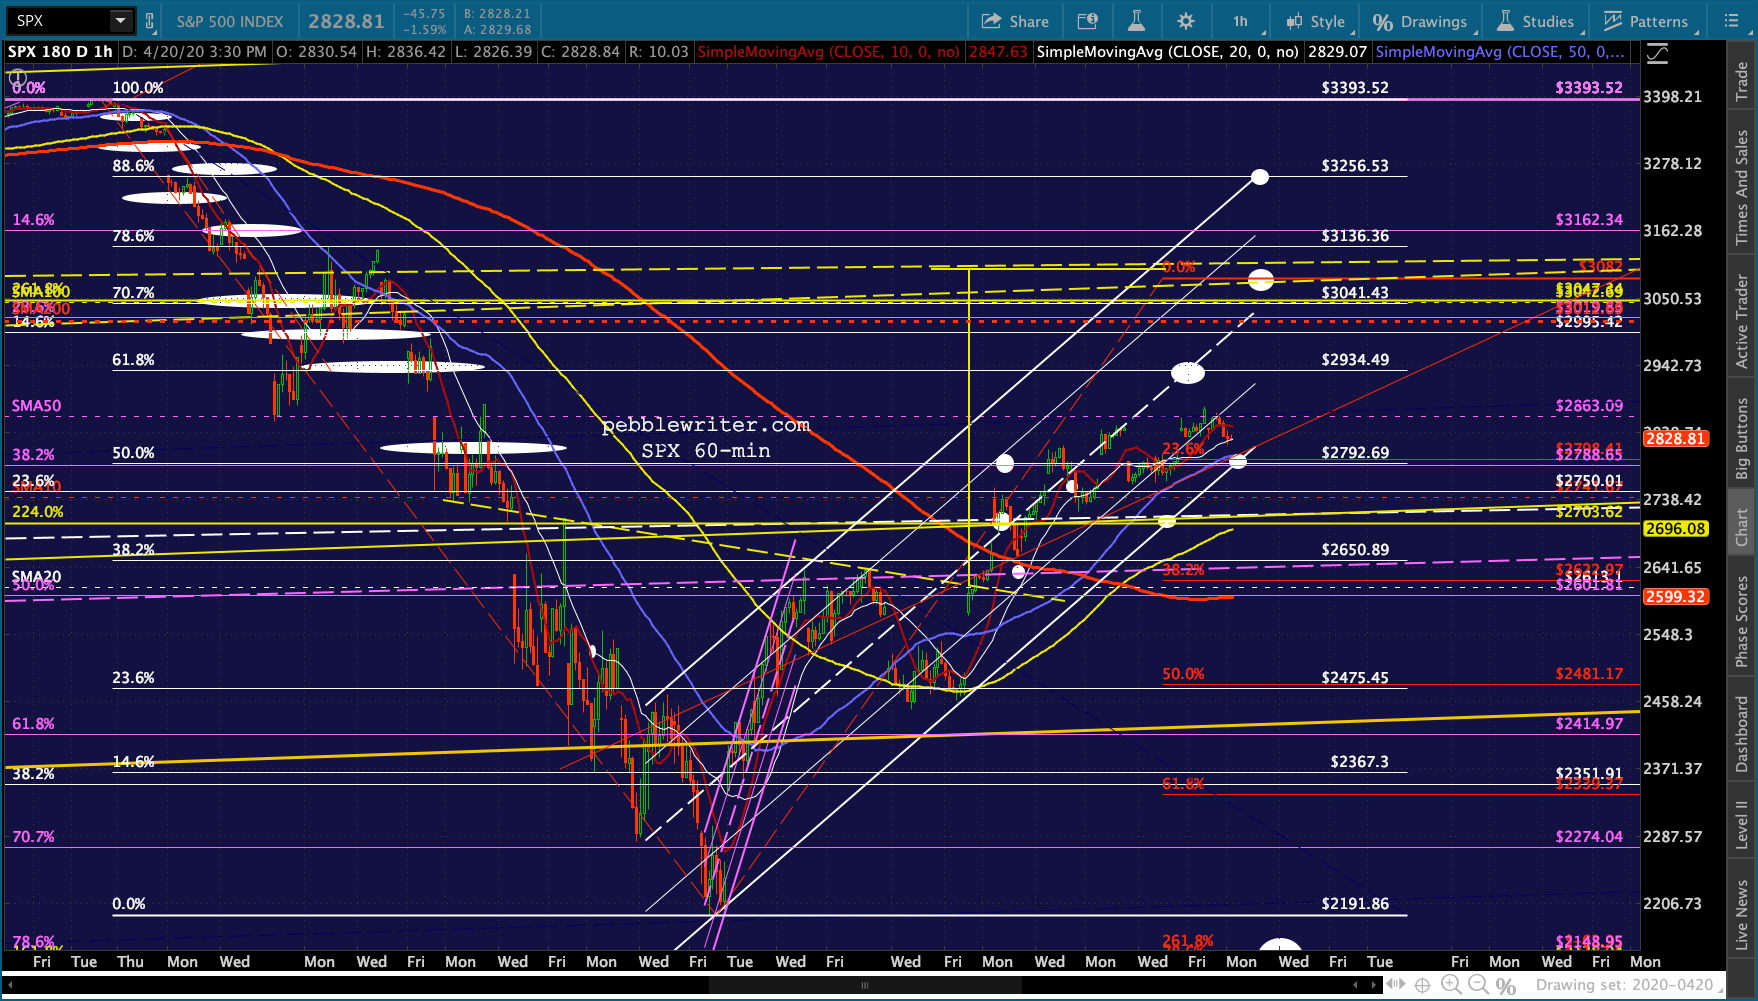
 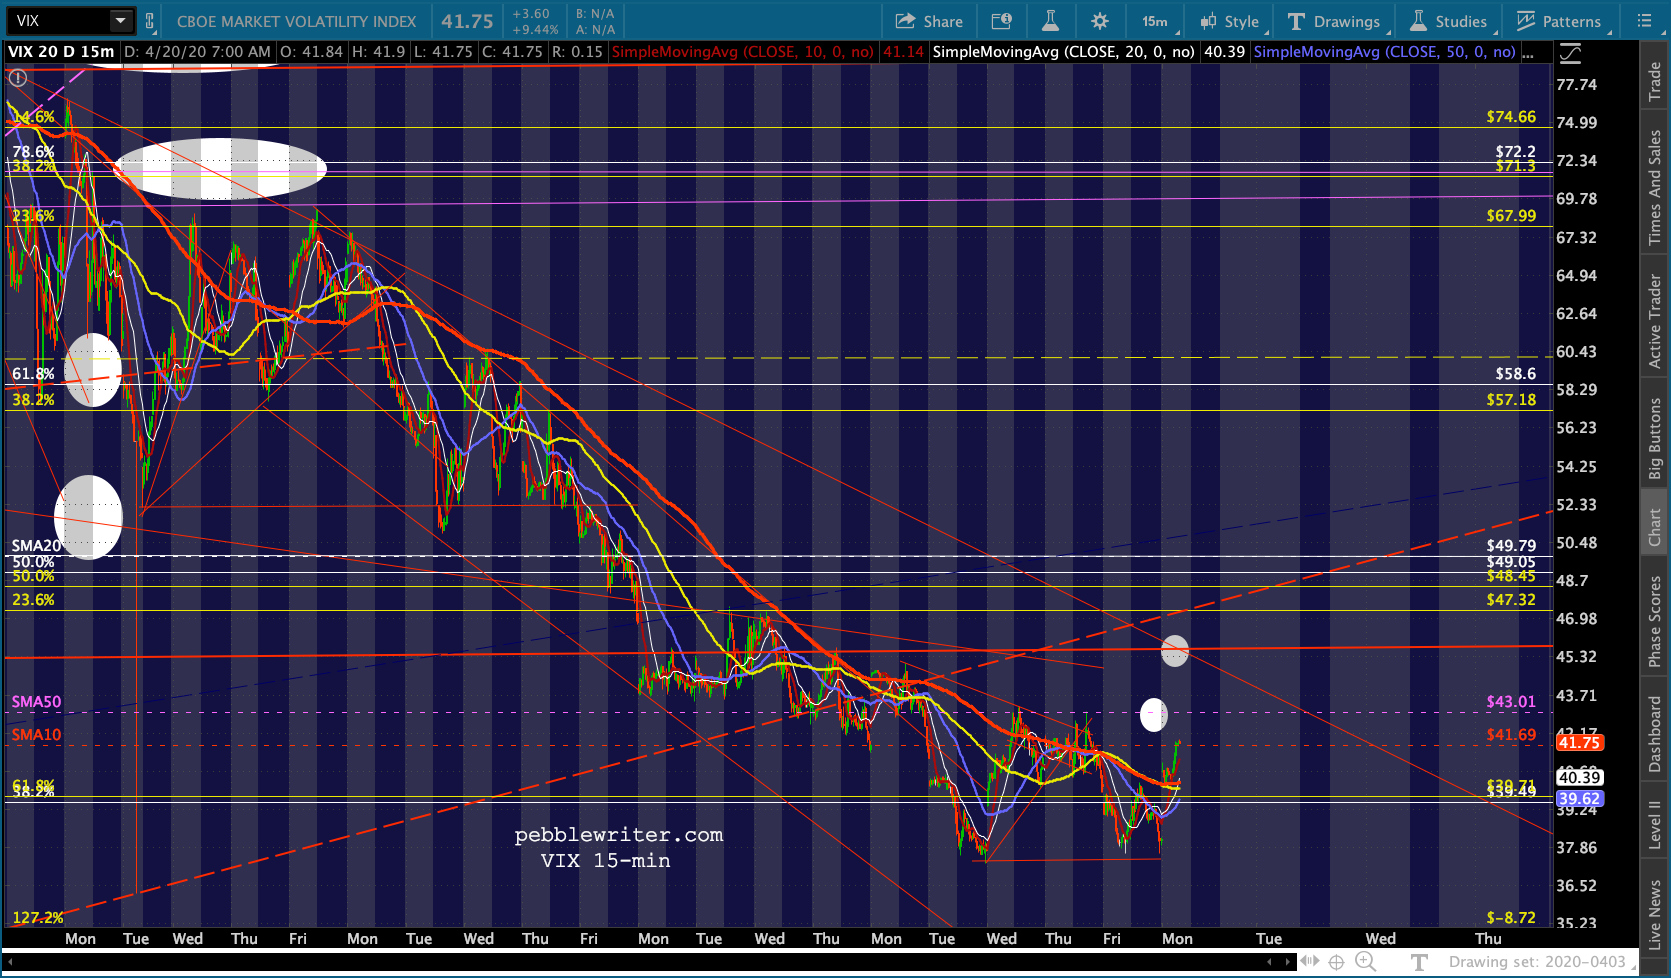 SPX, on the other hand, is well above its SMA10.
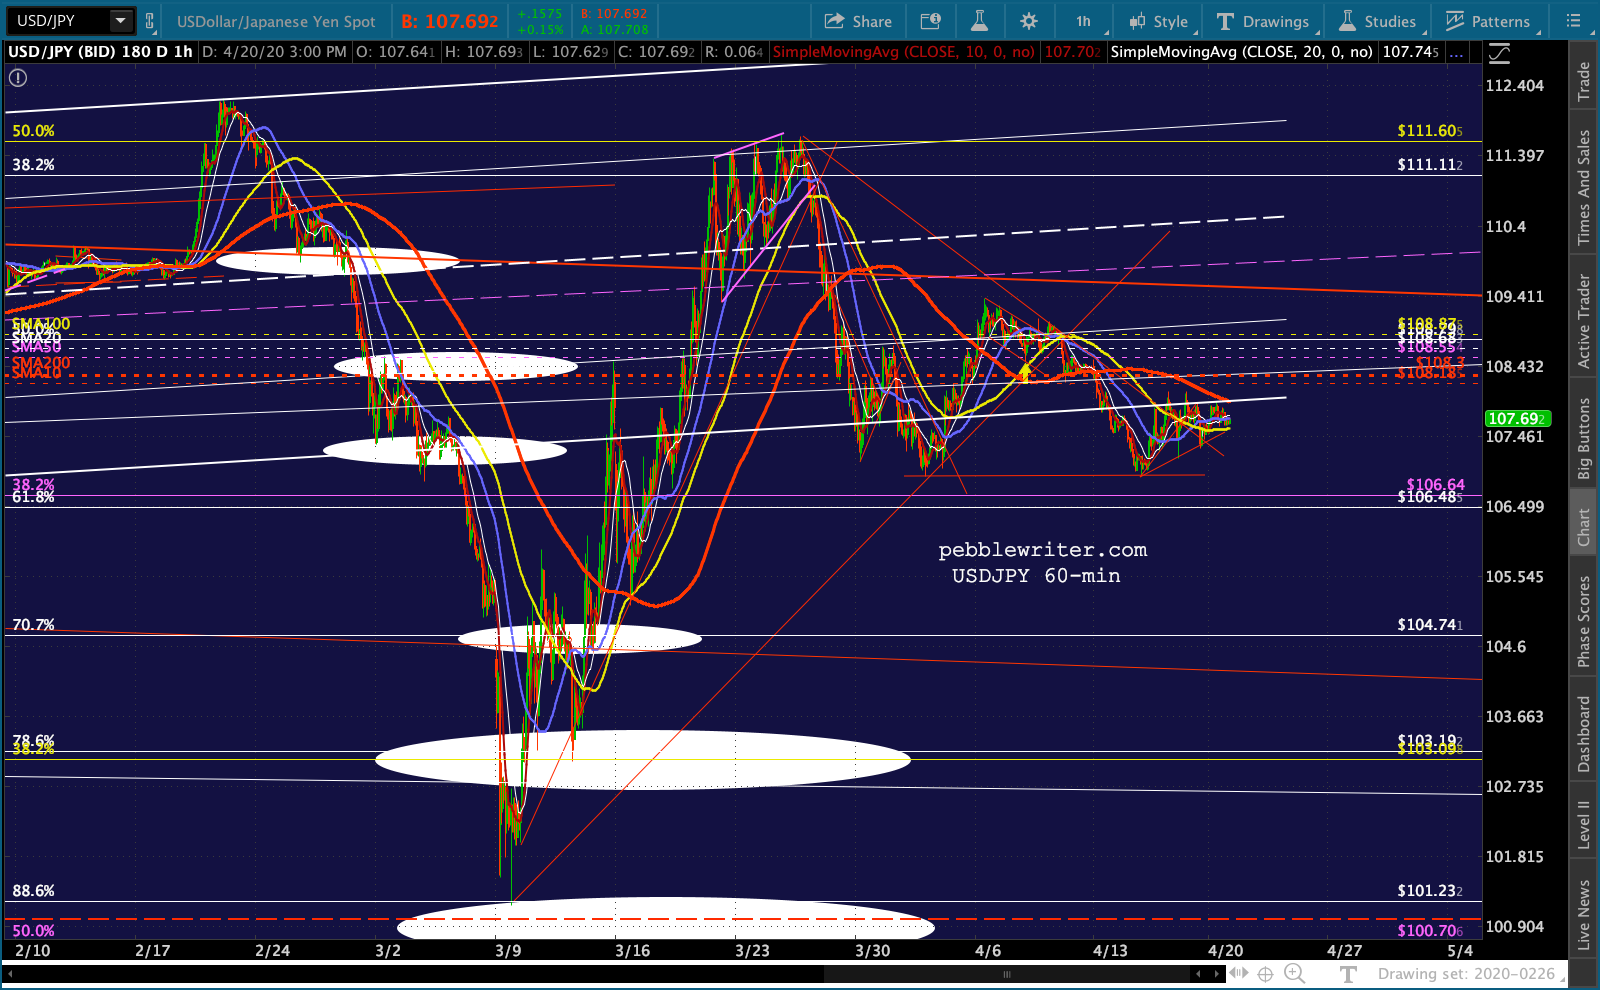
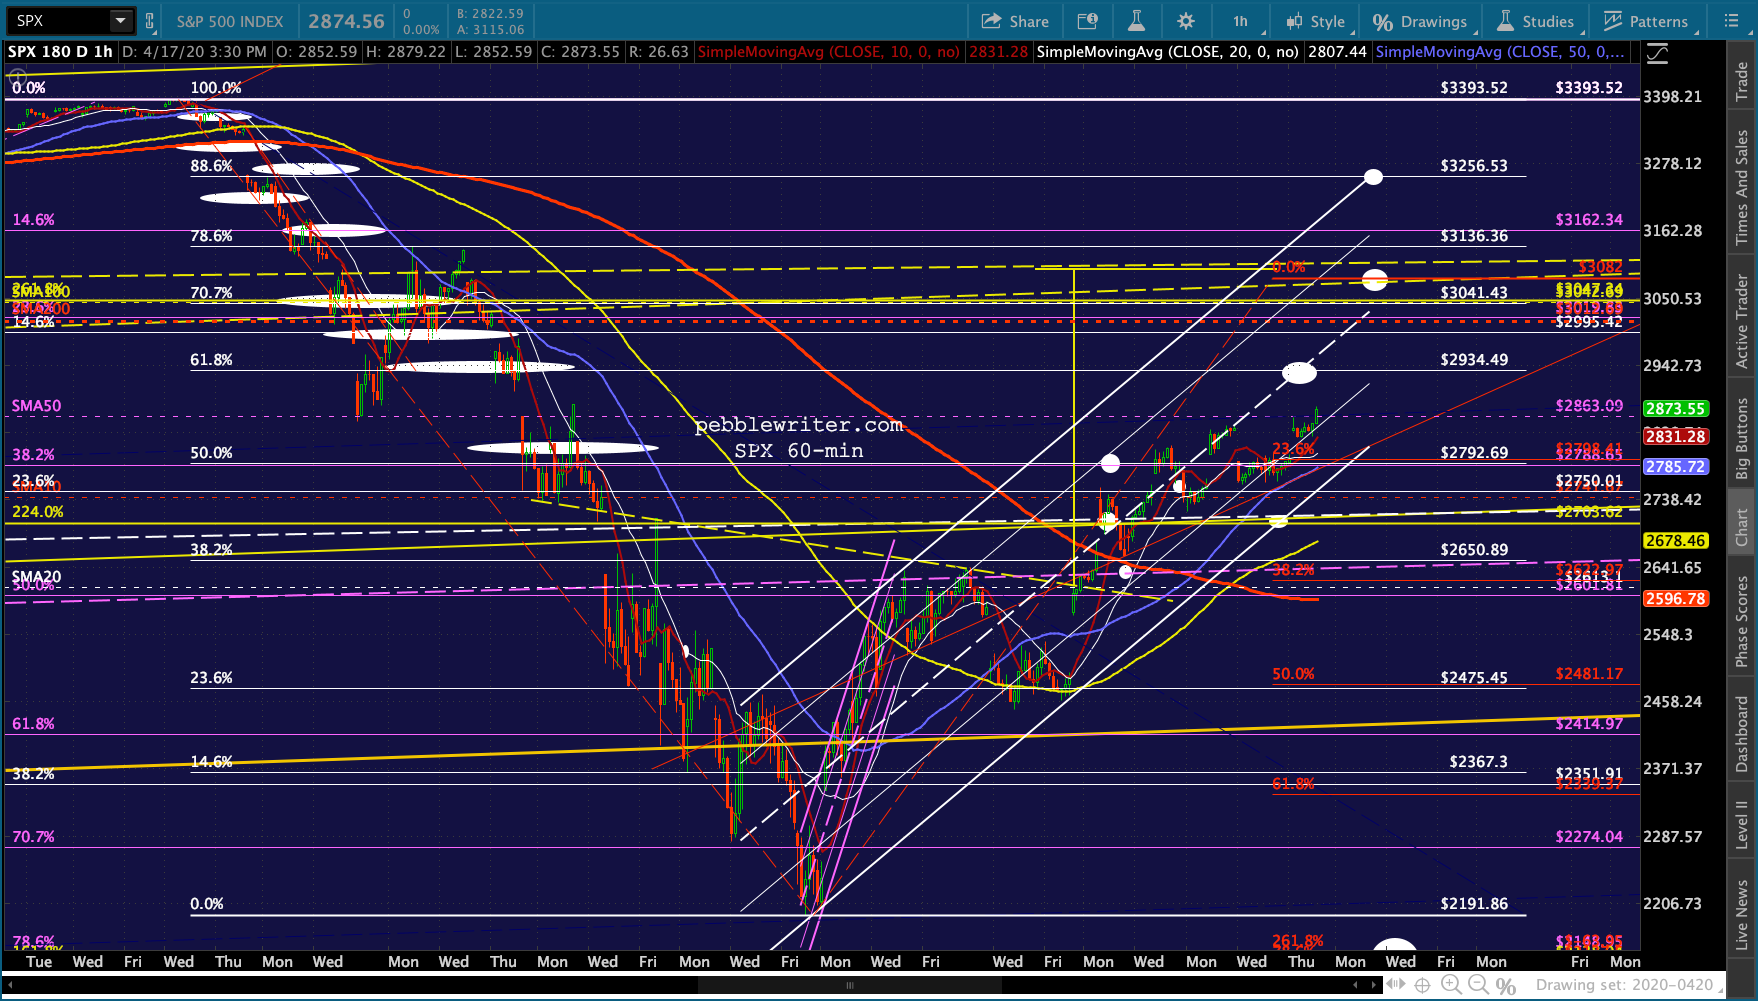 USDJPY continues to slumber, showing no effort to prop up stocks other than last week’s bounce at horizontal support.
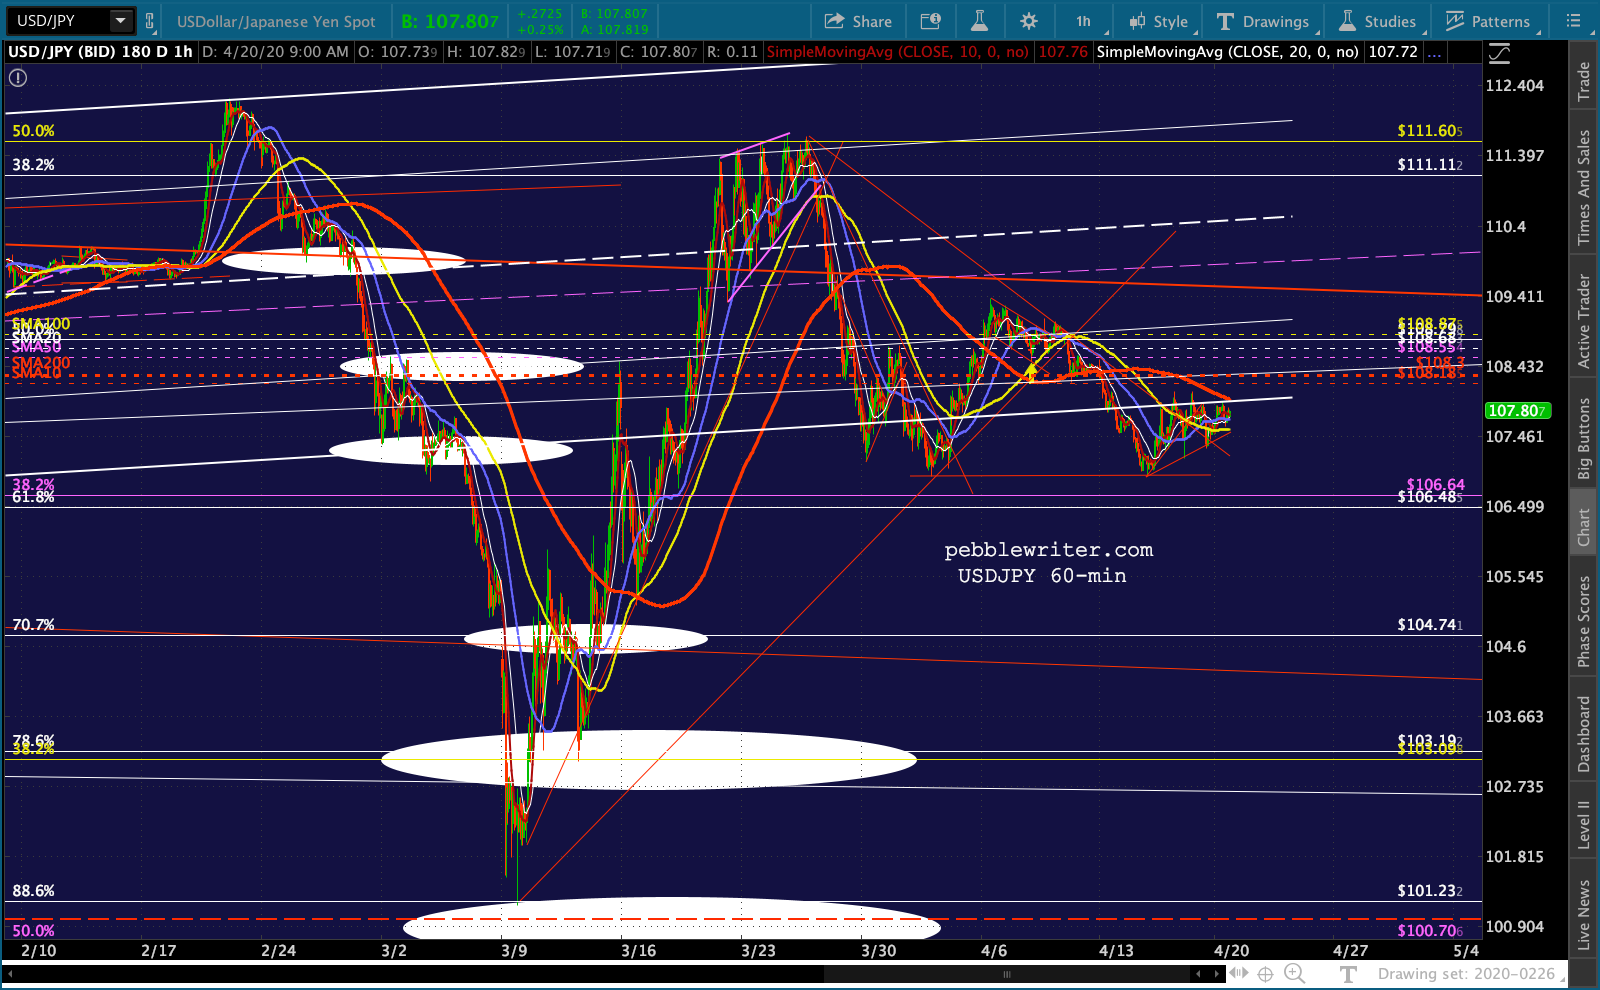 This leaves DXY with minimal support…
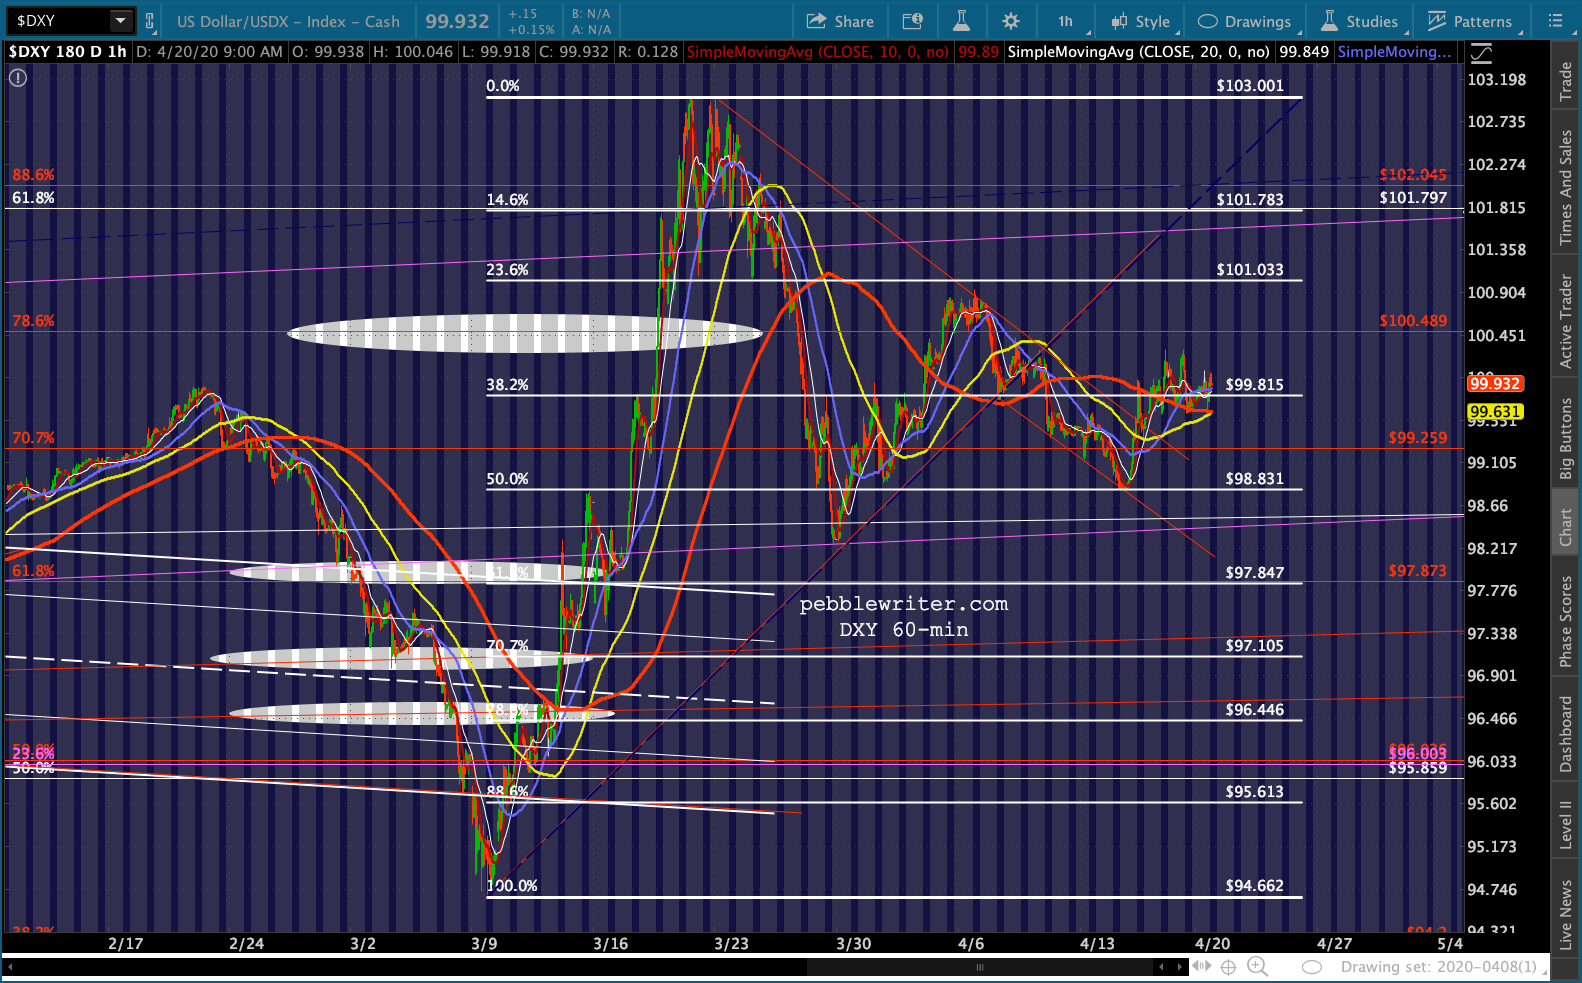 …unless EURUSD finally breaks down.
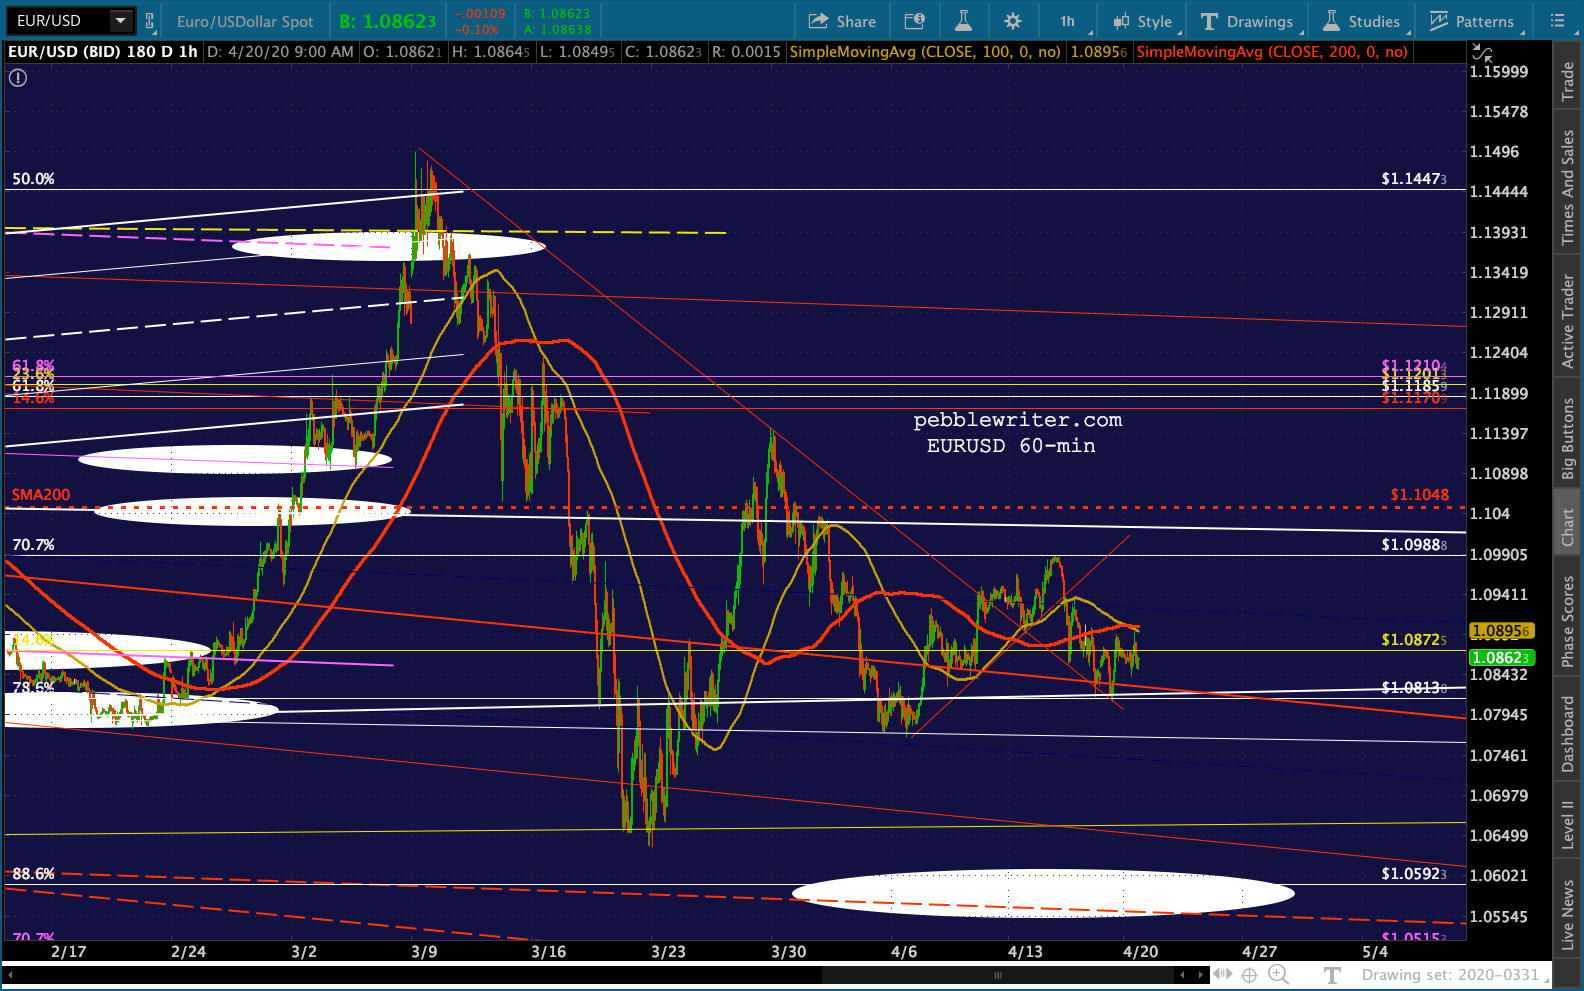 And, bonds are on the rise again…
 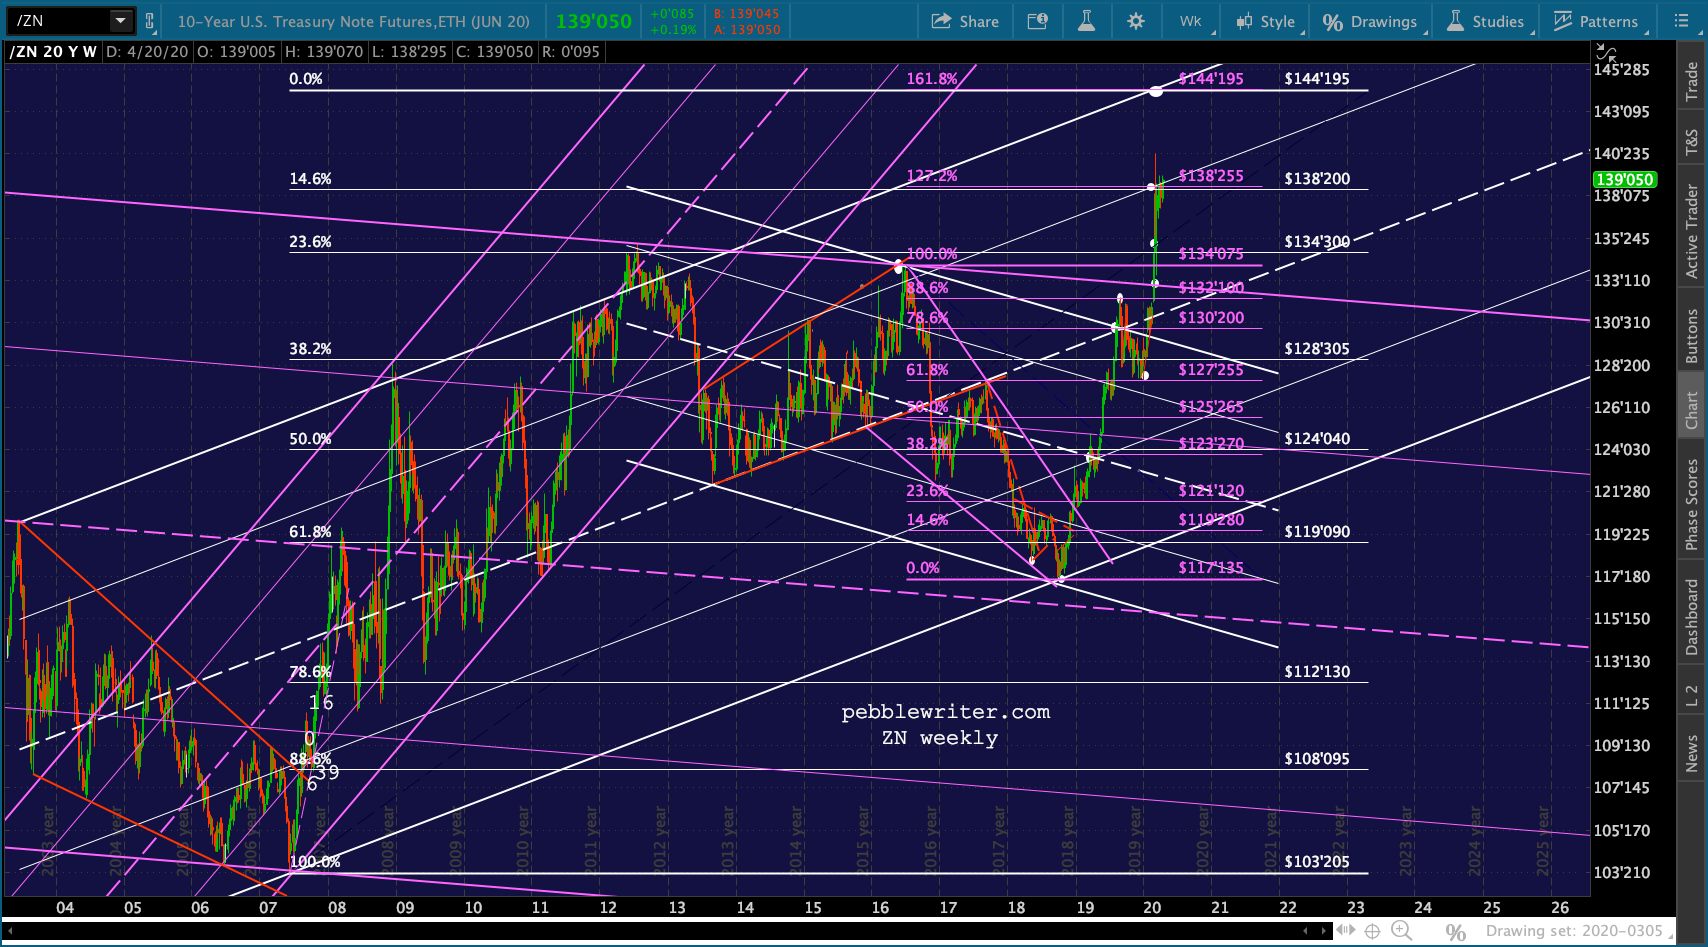 …indicating additional weakness in 10Y yields…
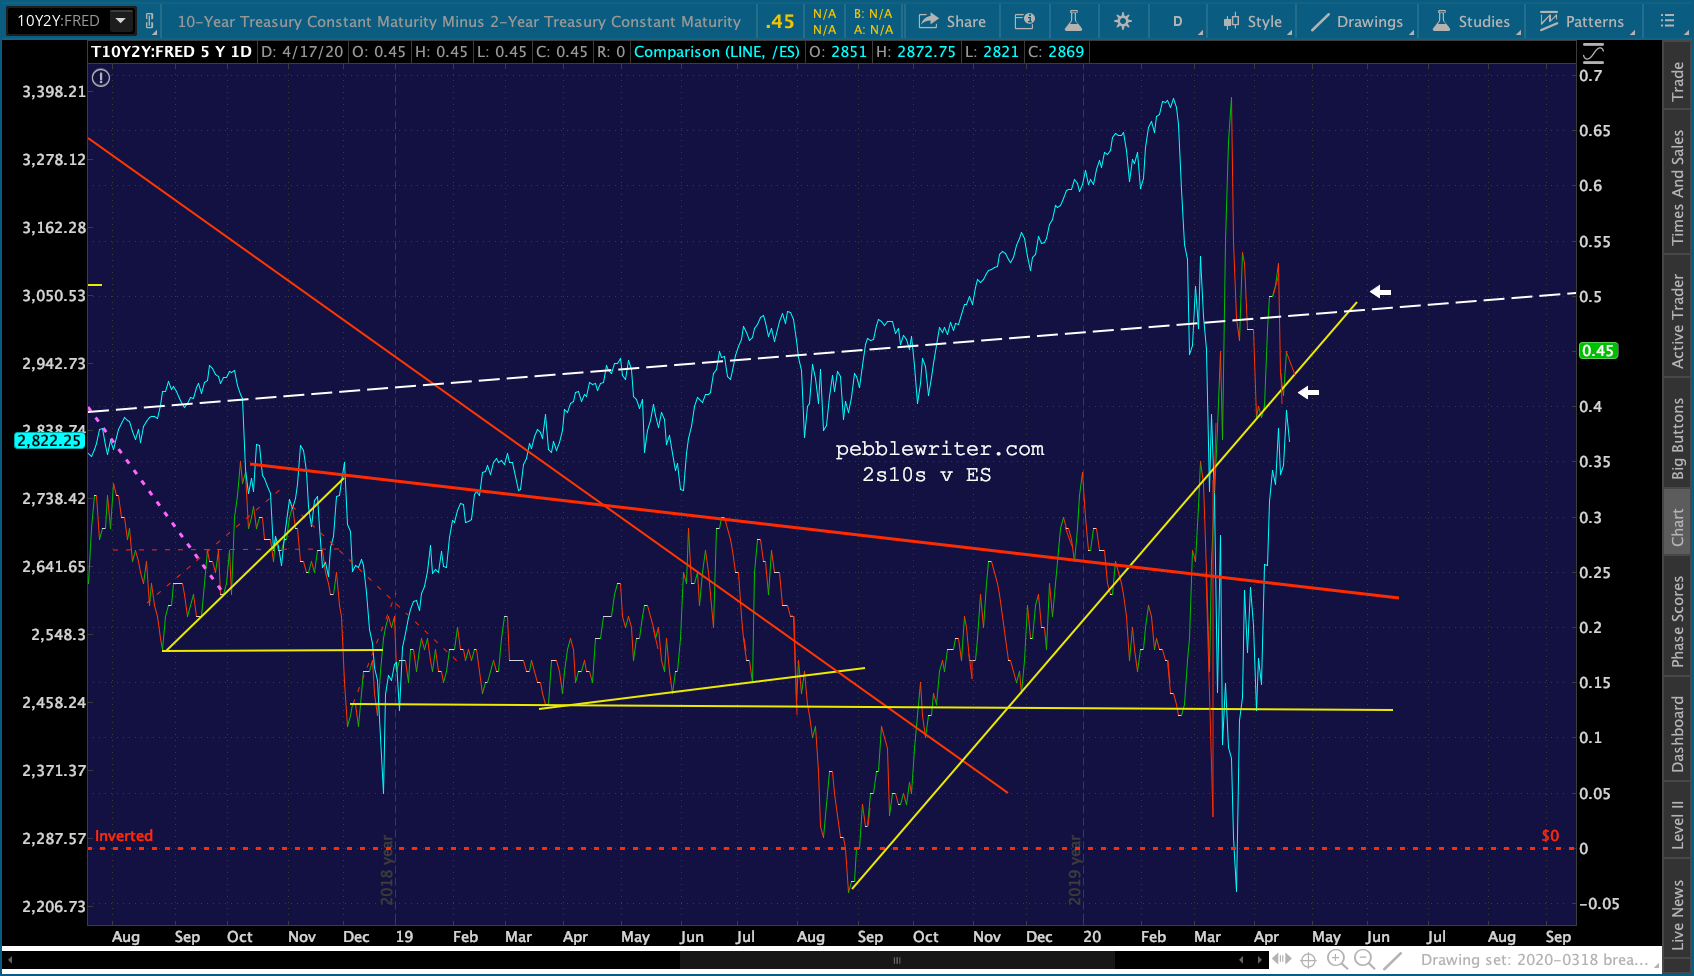
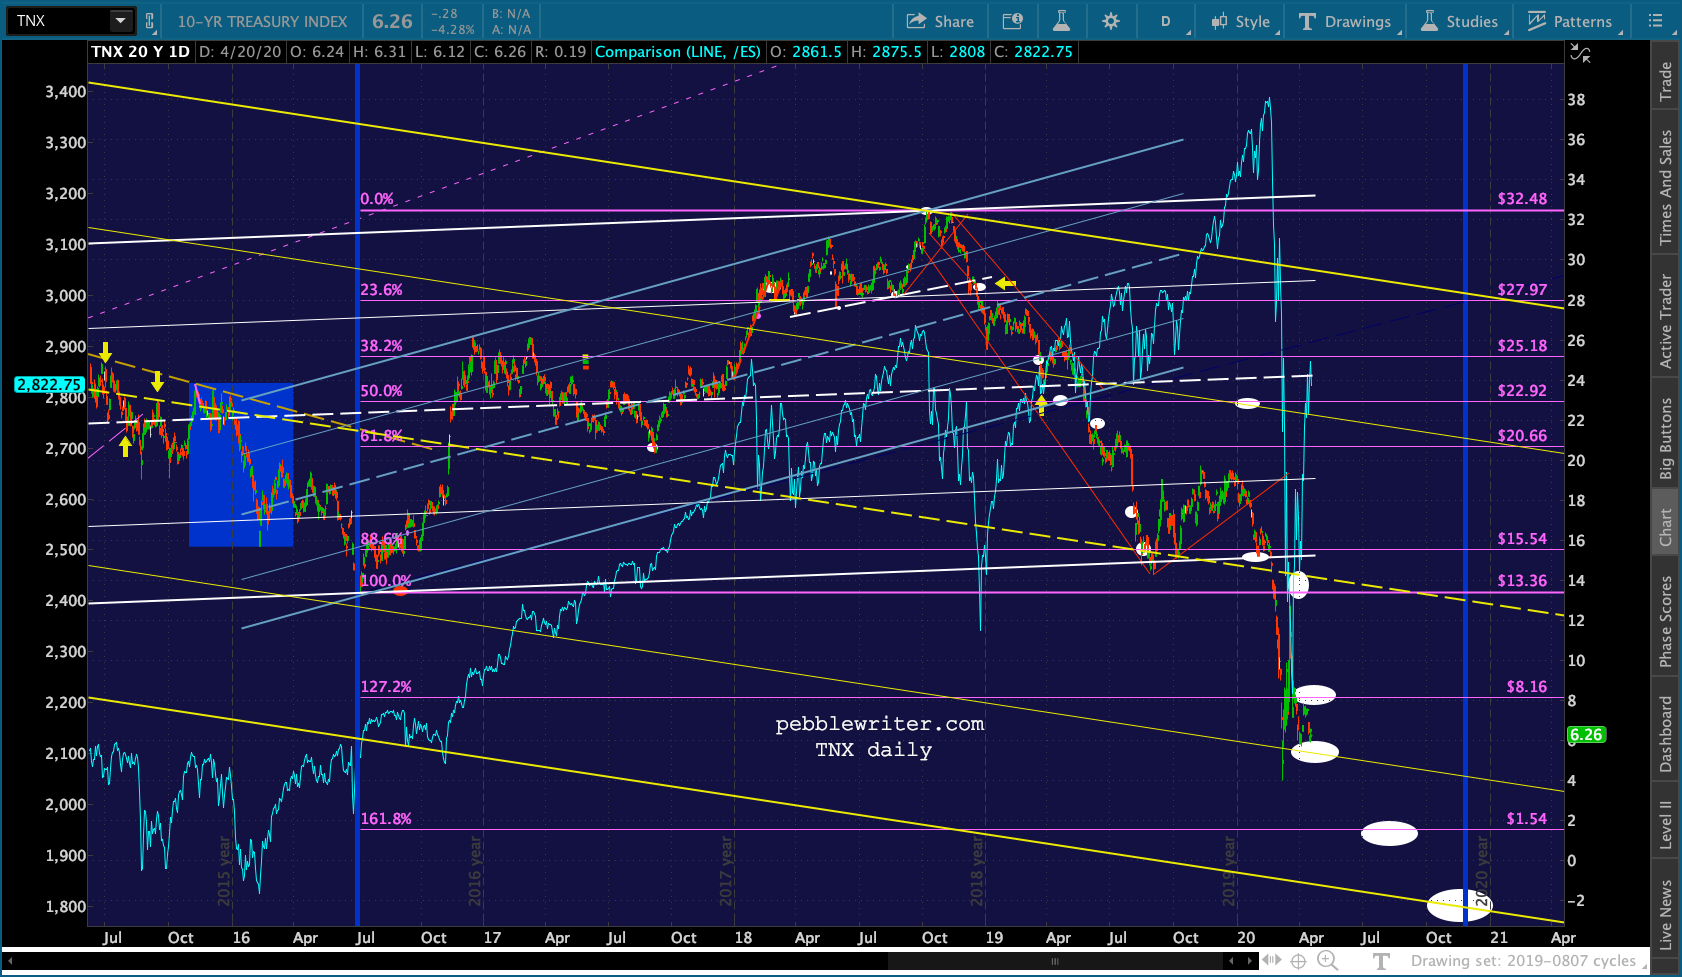 …and the 2s10s.
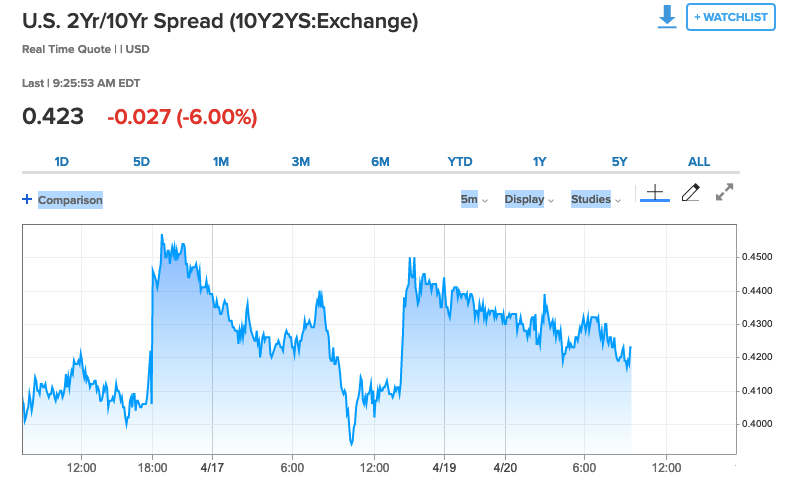
 The 2Y continues to flirt with a breakdown…
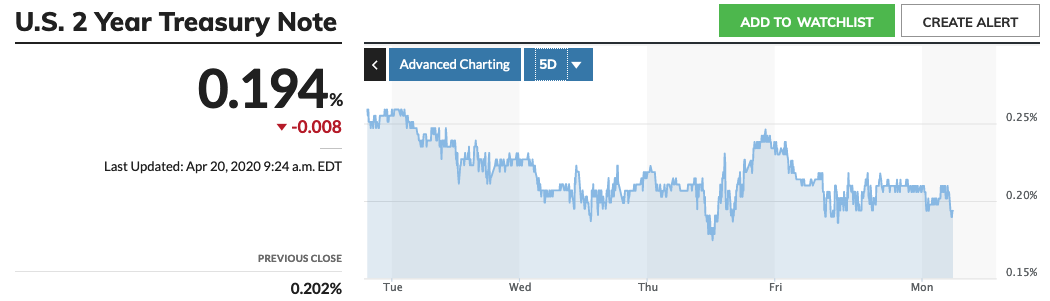 …with 17 bps representing disaster.
Sure, the Fed will probably continue to prop it up. But, it’s good to know where that support is – just in case.
Bottom line, none of this would be happening if the majority of investors bought into the idea of an economic recovery in the short term. The algos have driven most of the V-shaped recovery, and oil will be needed to support that narrative.
So, I expect CL’s June and later contracts to continue to hold the falling white channel — meaning a continuation of bouncing along with occasional breakdowns as each expiration date rolls along.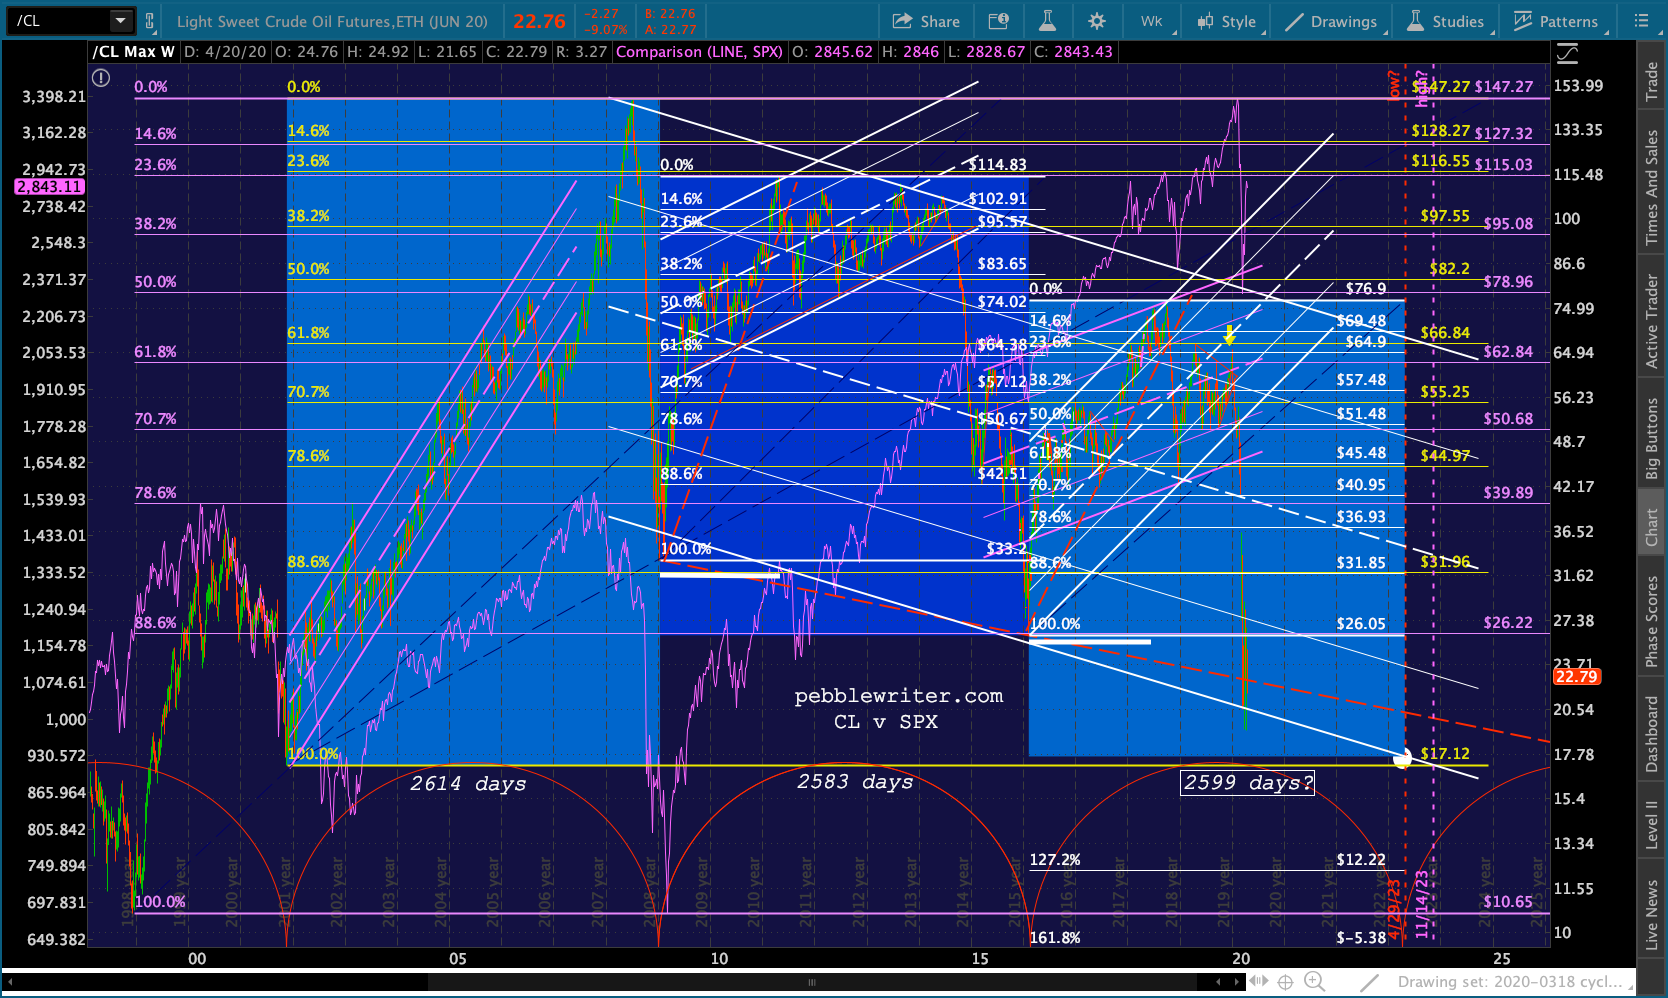 At some point, a therapeutic or vaccine will likely come along that really does make opening up the country safe. At that point, I can easily see front month CL soaring up past 26.05 and testing 31.96 – 36.93. But, we’re not there yet. Thus, I continue to look at CL as a trading vehicle.
I would have no problem playing a bounce back above 11 with tight stops as a trade, or holding short with tight stops if it drops through 10.65. But, for swing traders and buy-and-hold investors, I anticipate a continuation of the trading range for June contracts of 20-26.
more later…
UPDATE: 1:30 PM
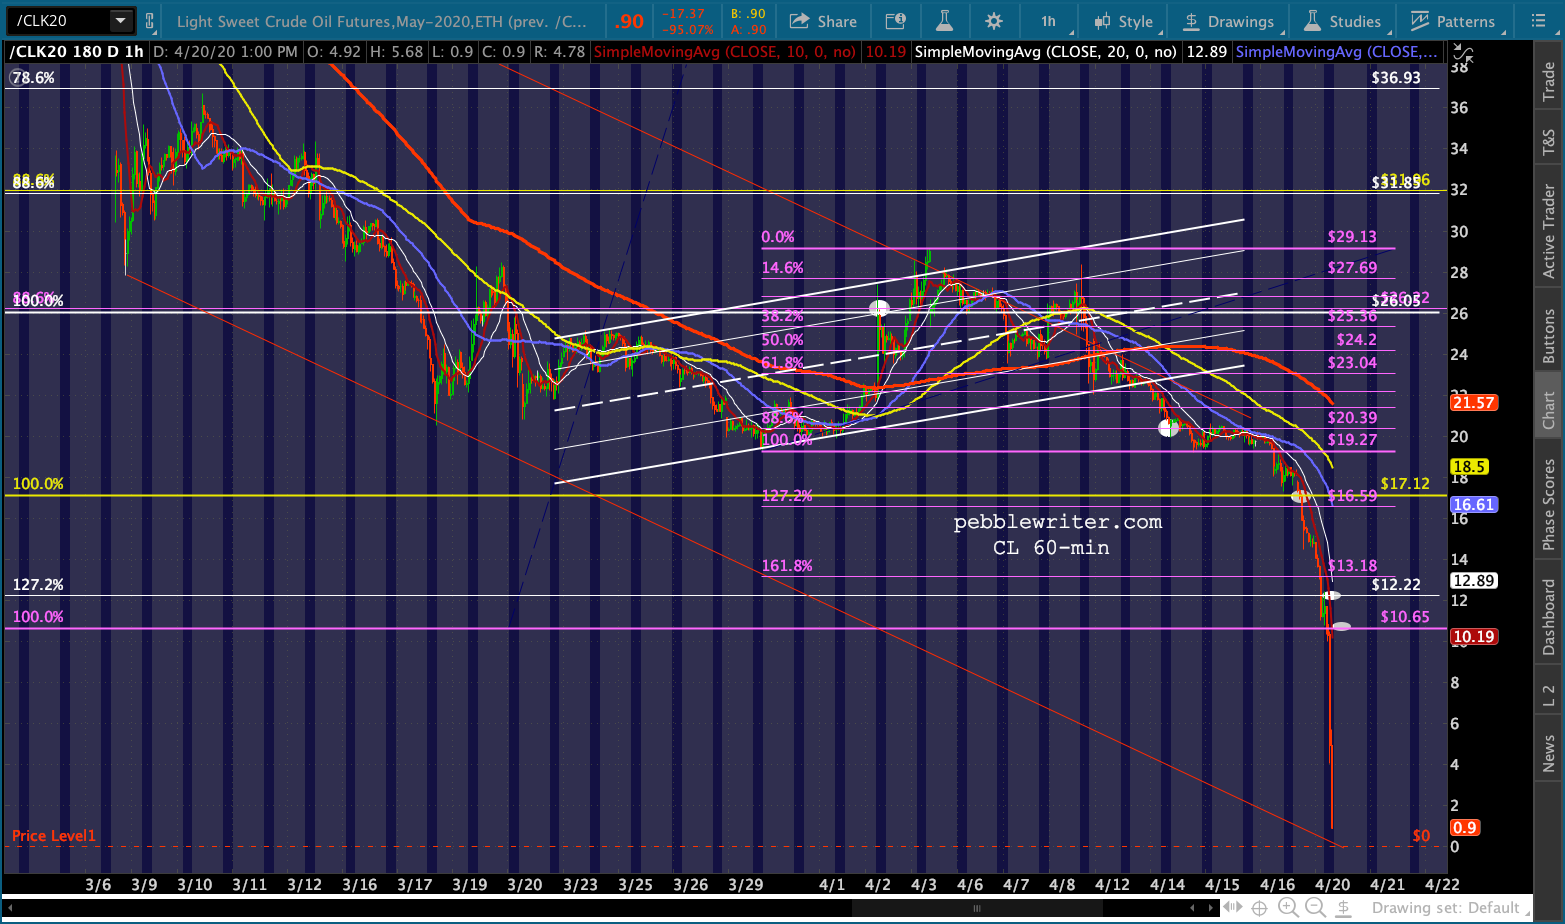
Yikes!
UPDATE: 1:52 PM
Sure, it could go all the way to zero. But, as a strong believer in the old adage that “pigs get fat and hogs get slaughtered” this is probably as good a time as any to call it a day.
 Note that the continuous contract (now June) has reached 20.19, a good place for it to take a stand if the falling white channel bottom is going to hold. I wouldn’t mind taking a nibble here with tight stops.
 UPDATE: 3:45 PM
ES/SPX: pretty impressive stability considering oil’s demise. Even CL is off a whopping 16%, while CLK20 is off a stunning 300%.
 This is one of those days people will talk about for years.