

We’ve been bearish on oil for ages, shorting back in October 2018 and playing most of the bounces and downdrafts along the way. So, we weren’t terribly surprised when May WTI futures dropped to zero, having suggested that very possibility when CL was testing its channel bottom just last week.
A drop through 19.27 would be reason enough to revert to short with 17.12 and 10.65 the only support between here and zero.
The drop to -40, however, was pretty shocking. The other huge surprise is that the Fed didn’t step in and “fix” things.
 Futures held up remarkably well under the circumstances, though we’re seeing more fallout this morning, with ES currently off about 2%.
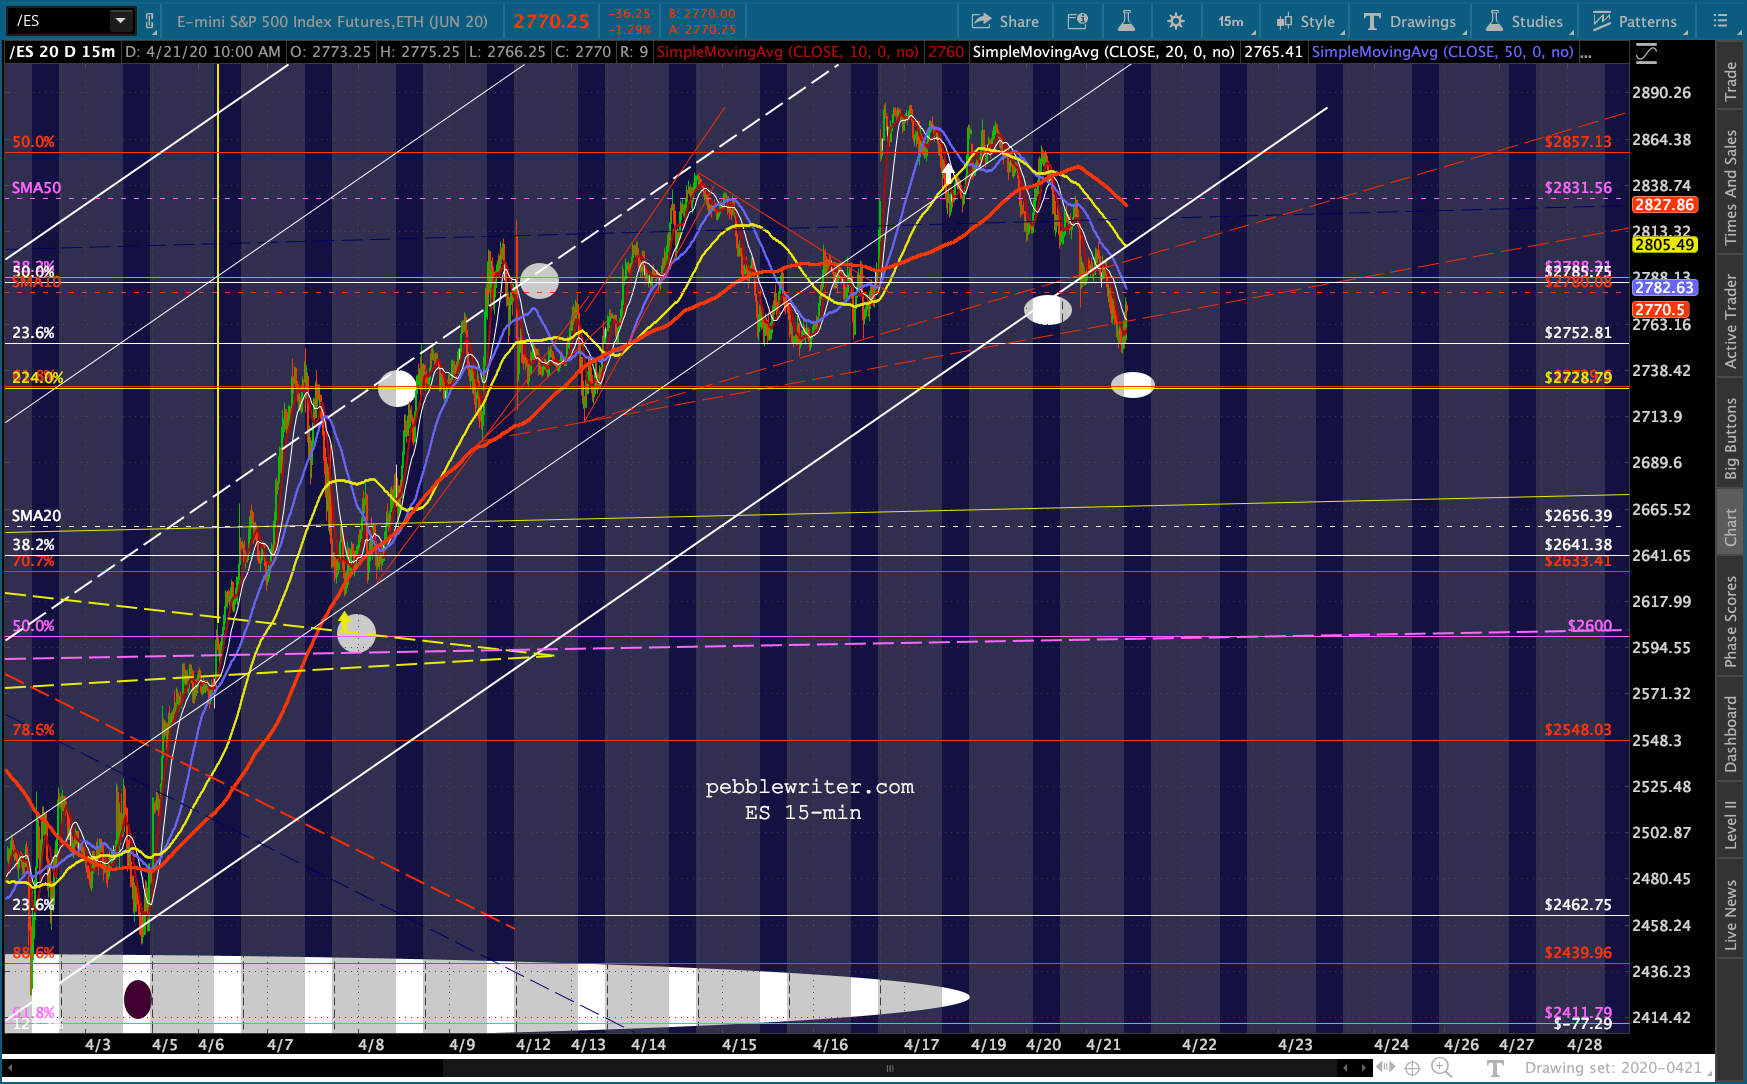
 This sets up an important test for ES and potentially SPX – the 2.24 Fibonacci extensions at ES 2728 and SPX 2703. More importantly, it could quite possibly trigger widespread selling as the 10-day moving averages (SPX 2775.12) and channel bottoms are breached – the two we identified as potential sell signals two weeks ago:
As we discussed last week, SPX’s SMA10 has crossed above its SMA20 – a bullish cross… For those inclined to follow the Fed’s lead, the safe strategy is to keep your stops reasonably close and to watch out for a drop back through the SMA10 and/or channel bottom. Either one is a signal for traders to sell and for buy-and-hold types to rein in risk.
continued for members…
Note that ES has already dropped through its SMA10 and below its channel bottom and is fast approaching its 2.24 at 2728. This is far short of the IH&S target and even the .618 Fib.
  SPX is in the same boat, though its 2.24 is much lower.
 One way of looking at the rebound since Mar 23 is as a rising wedge.
 The RW can be interpreted as bearish if it breaks down, but also in two bullish fashions: a sharply rising channel shown below in purple and a less aggressive one in white.

 In trying to determine which is more likely, we’ll want to keep a close eye on VIX – which has reached the overhead resistance we’ve been watching for the past several days.
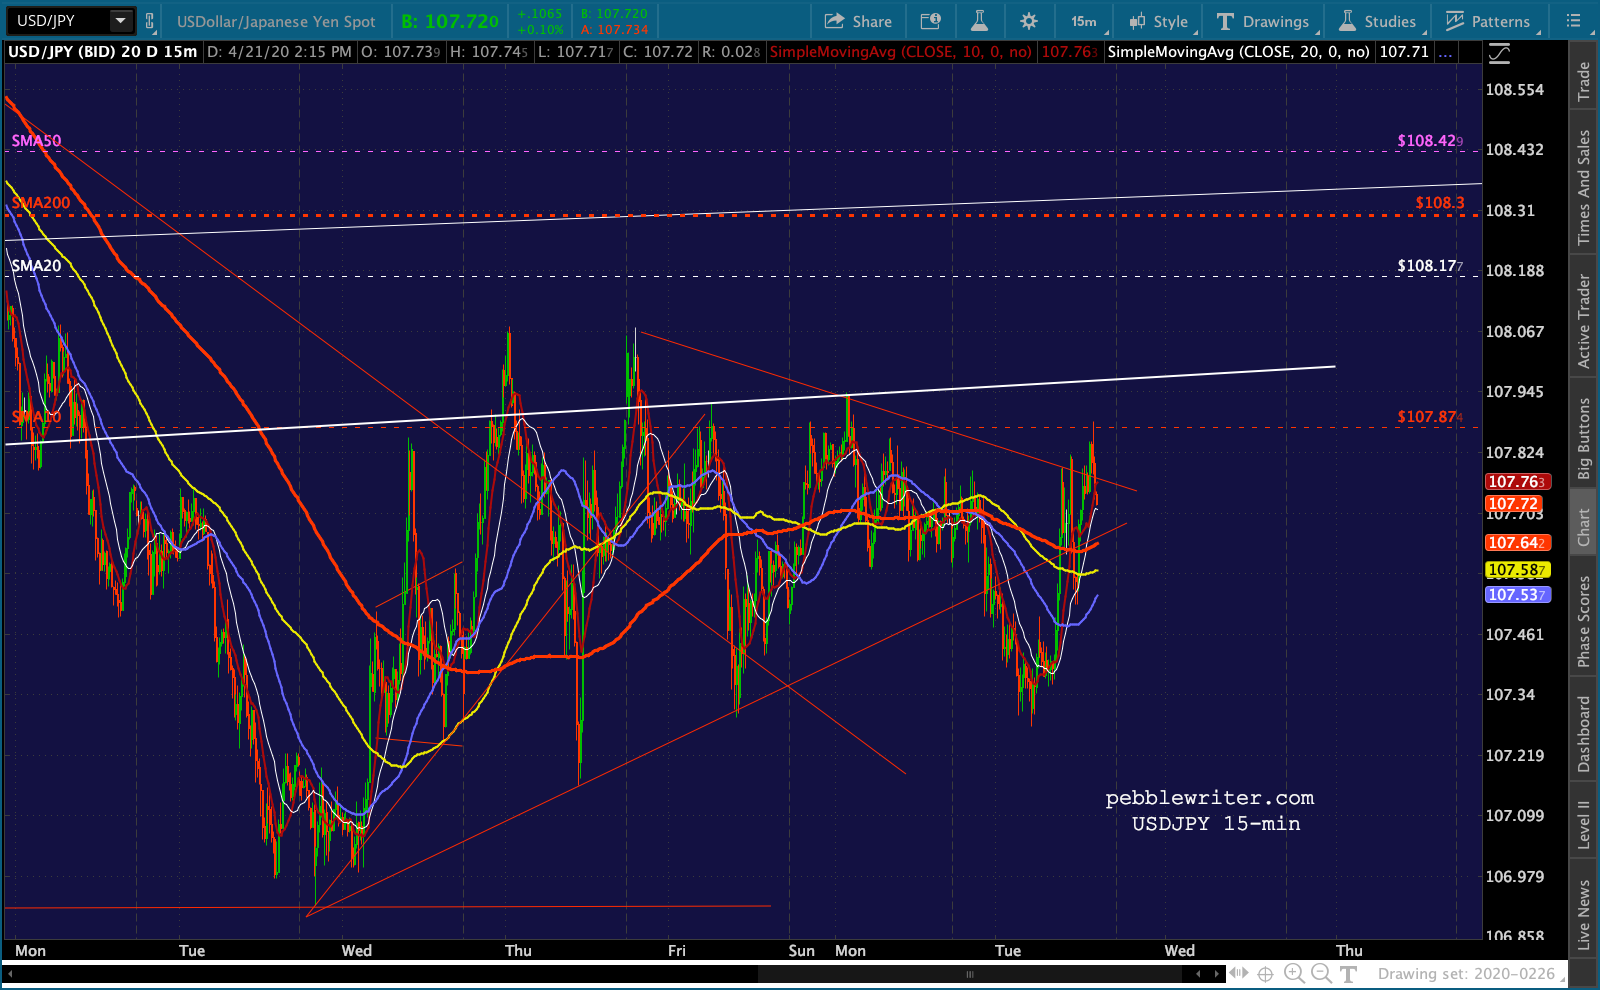
 We’ll also watch USDJPY, which has gone sideways for the past month – perhaps waiting for such an emergency.
 A move up through its SMA10 would attract the algos’ attention, and the SMA200 is not much higher.
 On the bond front, note that the 2s10s has finally broken down below the red TL we’ve been watching.
 …primarily on a drop in 10Y yields to cycle lows.
 Note that the 2Y is holding above the 17bps danger zone.
  And, contrary to the narrative that only the May contract was at risk, CL’s June contract is also breaking down, dropping to 11.79 overnight.
 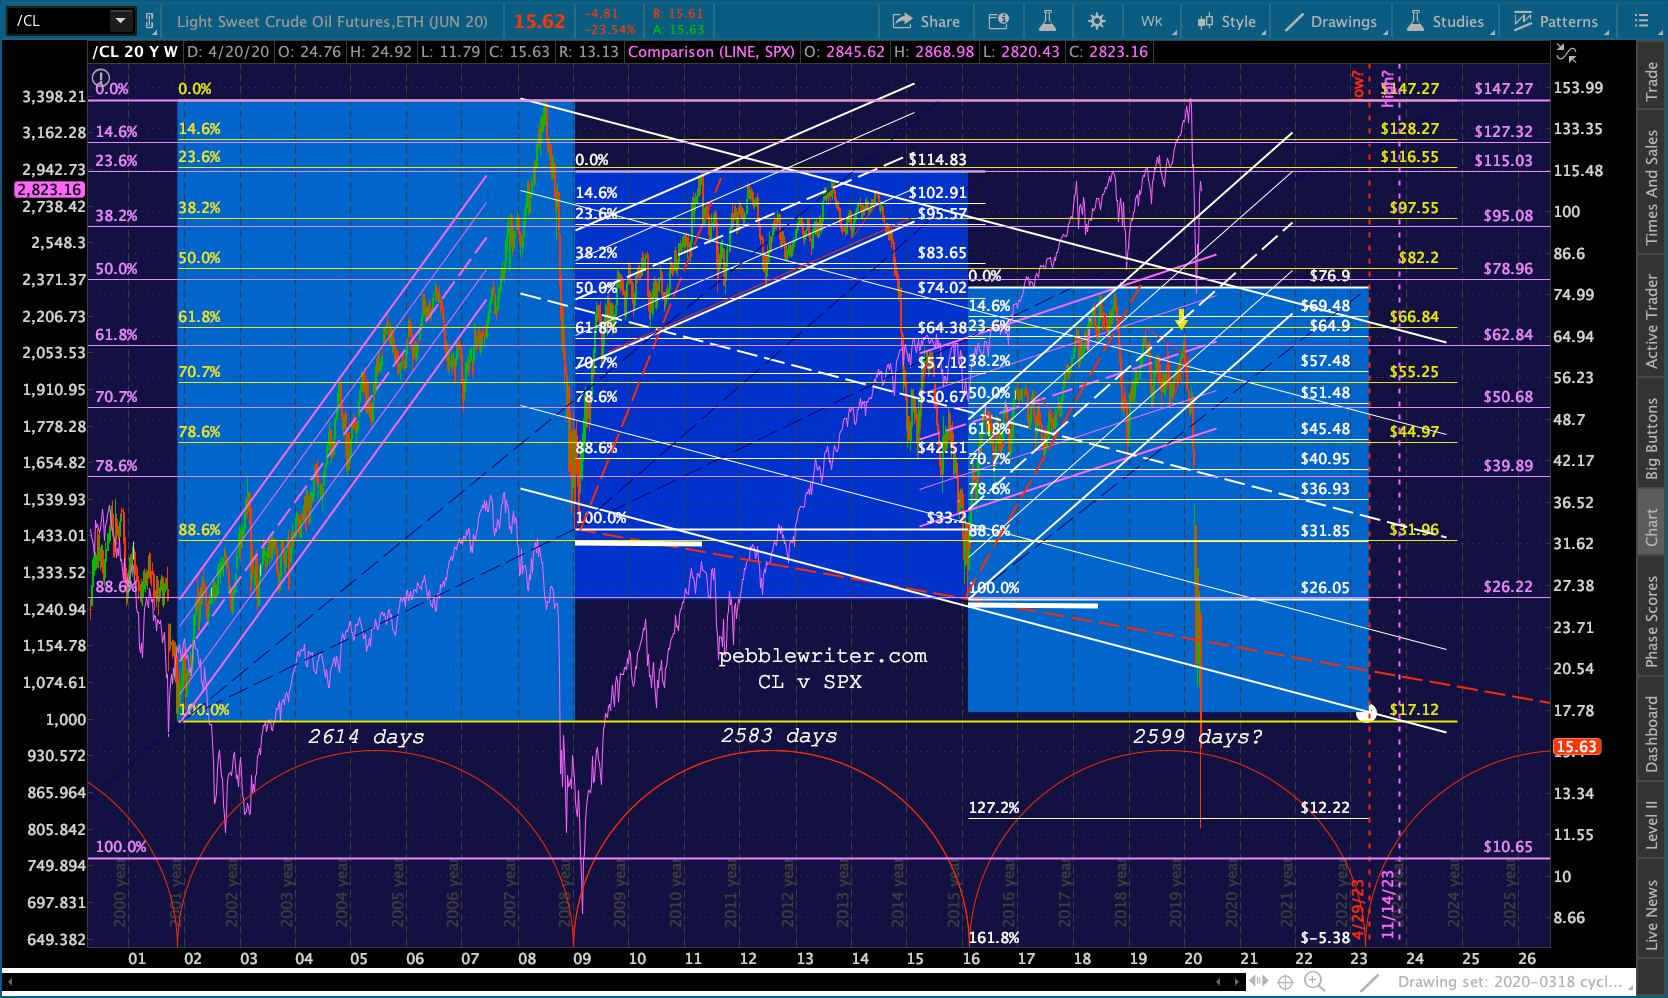 RB’s May contract has also finally broken down. Recall that we went short at .75. I would absolutely take profits in RB today just in case we get a relief rally after the May contract expires at 2:30. No idea whether we’ll get another flush like CL did yesterday. But, anything below .55 is a nice gain. Maybe set that as a stop as RB drops through it. The Mar 23 low was .4605.
UPDATE: 10:00 AM
SPX dropped through its SMA10 but is bouncing as USDJPY pushes up through a little TL (but, hasn’t broken out) and VIX backs off that resistance. ES dropped through its SMA10 and is still considering whether or not to stop at a backtest.


 In the hopes of getting some clues from TPTB, note that DJIA is back below its 2.24 extension and COMP should backtest its SMA200.
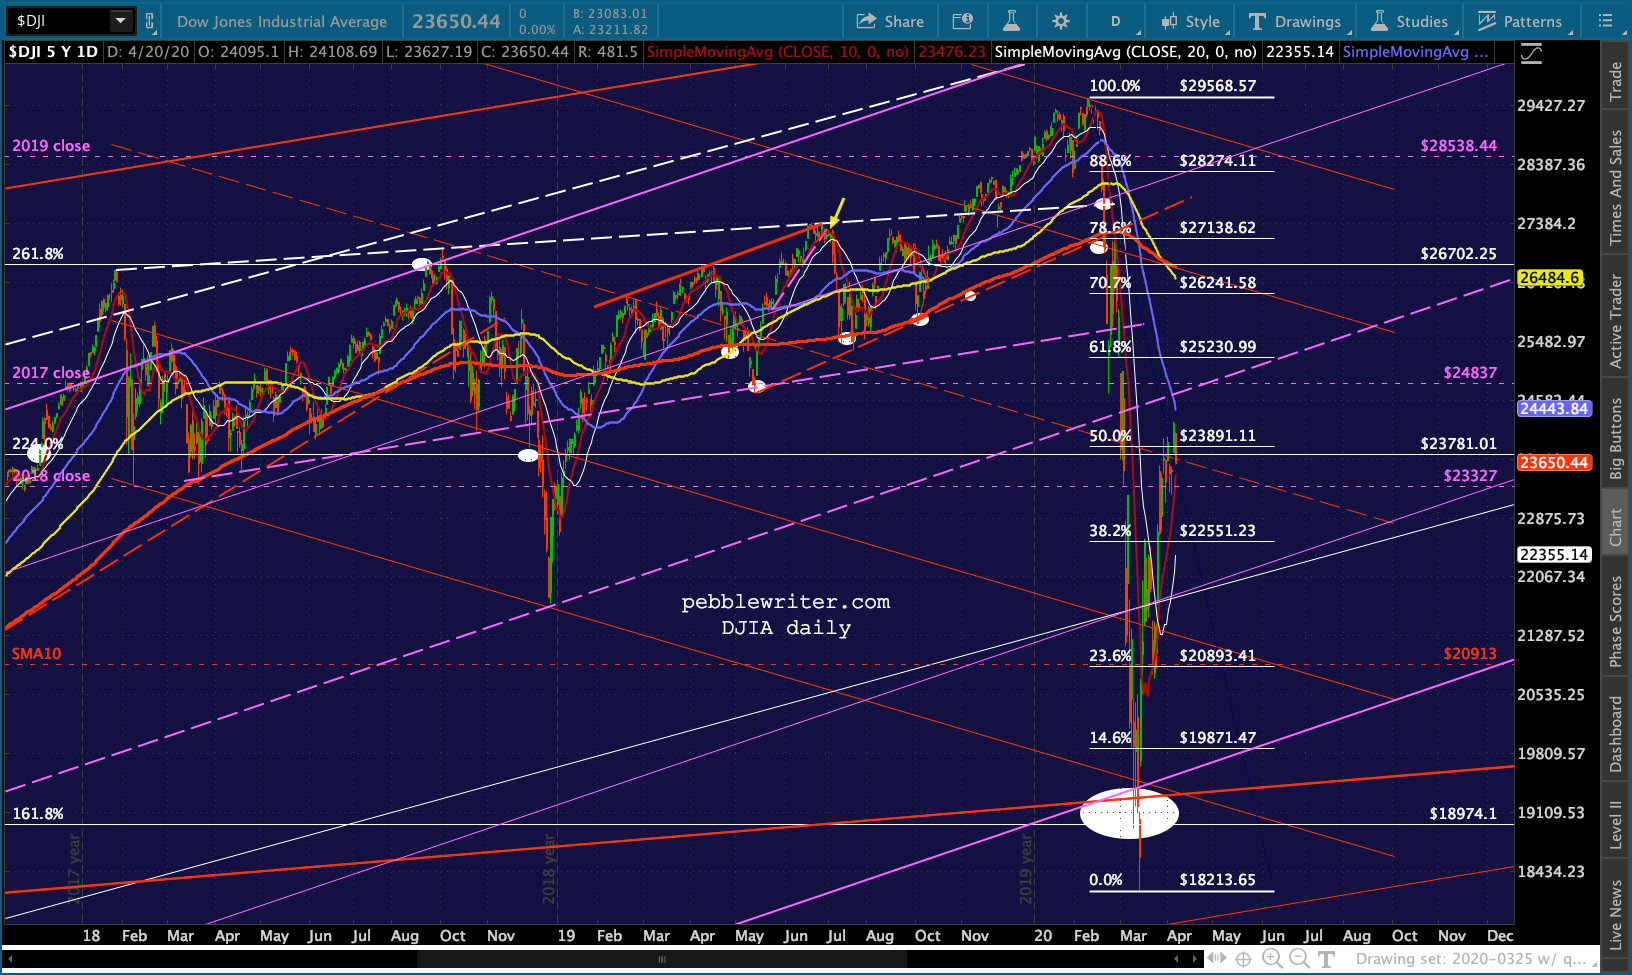
 RUT is an interesting case. After dropping to the yellow channel midline (so early that it exceeded the .886 at 1034) it has retraced only 38.2%. It has also stopped short of the December 2018 lows which has, for now at least, avoided a 1/4 cross.
  Of course, it also avoided new highs after that 2018 drop. It’s a very different picture than SPX and DJIA and is decidedly bearish.
UPDATE: 11:11 AM
ES is closing in on our 2728.79 target. Remember, a drop through it opens up SPX 2703.62.
 USDJPY tried to break out but failed.
 VIX, on the other hand, appears to be breaking out.
 COMP has dropped through its SMA200 and is testing its channel midline. A breakdown here would be very significant.
 At this point, all we have is a backtest. But, we are on the brink of a more serious drop that could produce new lows for SPX/ES. Once ES drops through 2728, the key becomes SPX 2703 – also the midline of its rising white channel.
 UPDATE: 12:45 PM
Quick note on RB…Note that the June (continuous) contract appears intent on reaching its .886 at .554. If so, this bodes well for the May contract doing the same – in this case at .4968.
  The bigger picture for RB shows it has broken down below the bottom of its falling white channel and the falling purple channel. It was the intersection of these two channels that served as our primary downside target before TSHTF, with a C=A target of .5765.
  The yellow 1.272 at .521 was already tagged, and the only thing lower than that is the white 1.272 at .0703 – i.e. a breakdown such as we saw yesterday in CL.
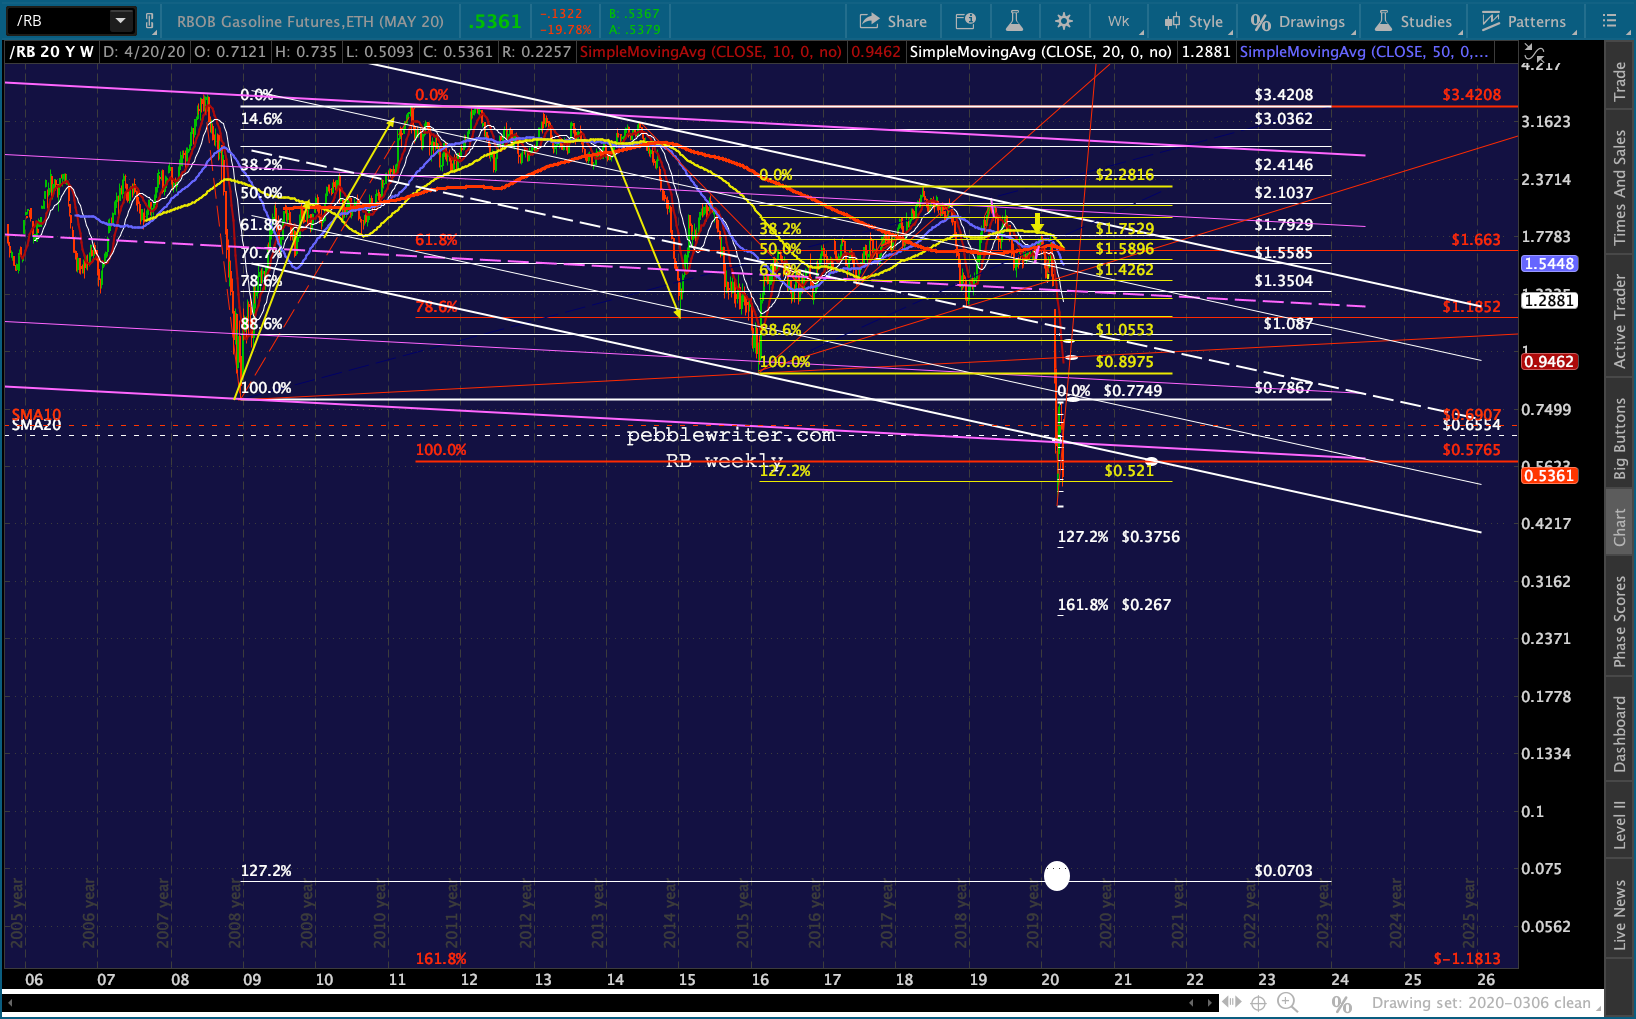 I don’t think RB has the same ETF exposure as CL, but never say never… I’d be rooting for .50 but be content with .55. Again, the best strategy might be holding short for a meltdown but ready to cover at .55 if we see any strength come back into the market.
 UPDATE: 2:19 PM
There’s the .886. Could still melt down from here, but probably not a bad time to take profits. I would imagine ES/SPX get a bounce as 2:30 comes around – only because some of the pressure will be off. VIX looks like it wants to break down, though USDJPY is backing off again.


 Goofy trade idea, but the roll should allow the June contracts to bounce at least a bit – maybe enough for a trade. CL is already on its way…
 Remember, if ES doesn’t bounce but breaks down below 2728 again, SPX 2703 is a very legit target.
UPDATE: 3:50 PM
Maybe…
