

Oil and gas futures have both tagged our next downside targets from June [see: Update on Oil & Gas, June 6, 2024.].

 We’ll take a look at the road ahead and what it means for the equity and bond markets.
continued for members… (more…)
Oil and gas futures have both tagged our next downside targets from June [see: Update on Oil & Gas, June 6, 2024.].
We’ll take a look at the road ahead and what it means for the equity and bond markets.
continued for members… (more…)
May WTI futures are off almost 35% since Friday’s close.  This drops it below the 17.12 target we first identified in March 2019 when, at 59.32, CL had completed a rising wedge and tagged multiple channel lines.
 Members might recall the 17.12 target was originally set for April 2023 in keeping with a March 2019 cycle study [see: Macro Factor Cycles and Regime Shifts.] The chart patterns and Fib levels fit nicely with the concept of a recurring 2600-day cycle for significant lows.
 We’ve reiterated the 17.12 target many times, including last December as CL finished on a high note after plunging 45% in the wake of Jamal Khashoggi’s Oct 2018 murder (when the US achieved maximum leverage over the Saudis – see: Coincidences and Consequences.) The last significant bounce accommodated both the Aramco IPO and the year-end equity ramp.
 Oil has been a favorite tool of not only the Saudis but also central bankers and politicians. In fact, understanding the relationship between oil/gas and inflation, interest rates and equity valuations has made it possible to accurately forecast most of its major moves over the years.
At times, this has meant ignoring the frequently misleading supply/demand data, OPEC deliberations, and presidential tweets and focusing instead on where central bankers needed oil/gas to go in order to achieve a particular inflation and interest rate goals.
As interest rates rose over the past few years, for instance, it became obvious that inflation would need to moderate to relieve the building budgetary pressure.
 One major theme on which we’ve focused since calling the top on interest rates in October 2018 [see: Suddenly Interest Rates Matter] has been the relationship between CPI and the YoY delta in gas prices. By “managing” the price of RBOB, CPI and, thus, interest rates could be managed higher or lower as needed.
 This was a very reliable theme for most of 2018, 2019, and early 2020 – when the focus shifted to oil’s strong correlation to stock prices.
Oil has long been a major factor in triggering algos to bid up stocks. So, when oil’s major channel from 2016 broke down in February, we knew stocks were in deep trouble.
With CL dropping through its 2001 lows and approaching its 1998 lows, what might we expect from oil and what are the implications for stocks? As we discussed last week:
A drop through 19.27 would be reason enough to revert to short with 17.12 and 10.65 the only support between here and zero.
continued for members… (more…)
The downside scenario triggered when S&P futures reached our upside target on Jan 22…
$ES_F just reached our next upside target.https://t.co/zTy3q8WSBd pic.twitter.com/CoRSemmDOk
— pebblewriter (@pebblewriter) January 22, 2020
…is playing out very nicely indeed.
 Credit VIX, which uncharacteristically didn’t collapse last night…
 …and CL which, having come close to our 51.62 target on Sunday, is taking another gander.
 Needless to say, our downside targets remain unchanged.
BTW, Boston folks, I’ll be downtown today and Friday. Drop me a line if you’d like to meet up.
continued for members… (more…)
We’ve been bearish on oil for quite a while, shorting it at 75.57 on October 3, 2018 after Jamal Khashoggi was dismembered and at each of the 3 subsequent peaks since then: just before the JCPOA breakup, the Abqaiq attack and the Aramco IPO — which should have been a peak, but resulted in a headfake “breakout” climaxing in the Al Asad attack.
Last night, CL dipped to within 0.41 and RB within 0.187 of our next downside targets.  As members know, these are critical support levels. A breakdown would be devastating to oil and gas and present stocks with very strong headwinds.
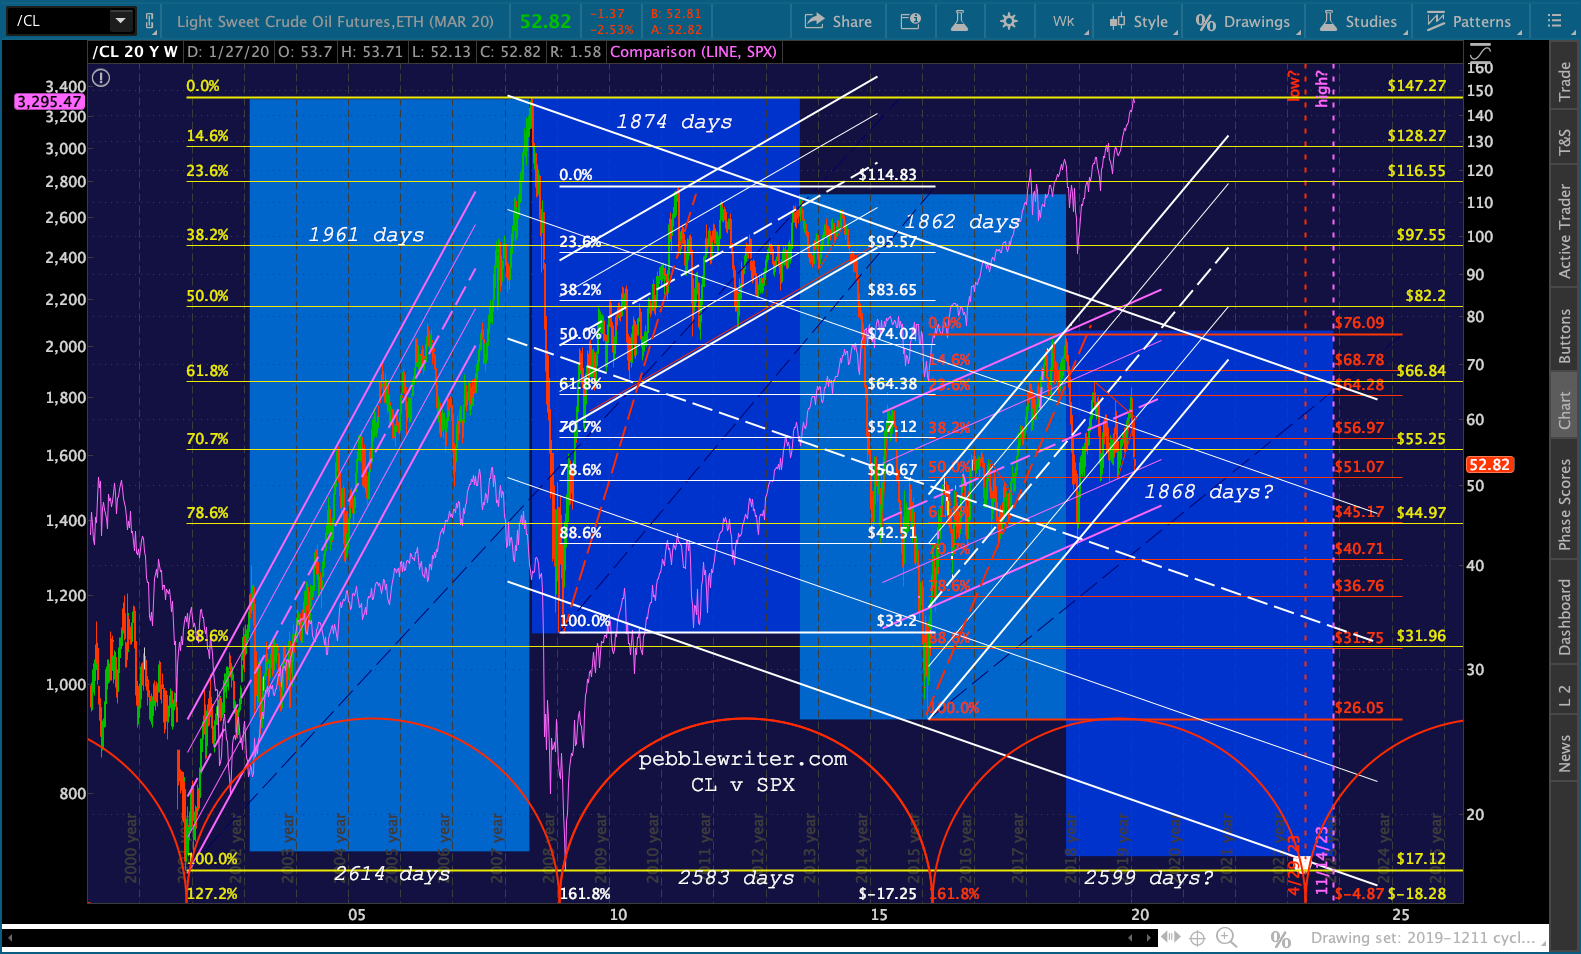 Futures, now at 3260, are headed straight for our next downside target at 3200.
 Yes, the coronavirus is potentially a very big deal. But, this decline in oil and gas was baked into the markets over a year ago and is a strong endorsement for our inflation model.
continued for members… (more…)
It’s interesting how Khashoggi’s murder top-ticked oil and gas prices…

 …and, so soon after Trump’s latest demand that OPEC lower oil prices.
 I’m certainly not insinuating that Trump had anything to do with Khashoggi’s murder.
But, OPEC ignored Trump’s Sep 20 demand. Two weeks later, oil prices had spiked 10% higher. Since Oct 3, the day of the murder, WTI has fallen 14.5% and RBOB has fallen 16.7%.
As Churchill famously said, “never let a good crisis go to waste.”
* * *
Sometimes it’s quite difficult to anticipate a major market move. You’ve got hundreds of companies, all with their own earnings, outlooks, and market-moving headlines. Then, there’s the economic news of the day, both domestic and foreign. And, of course, there are geopolitical developments such as who’s dismembering or cozying up to whom?
And, sometimes it’s not so difficult at all. It can be as simple as the VIX chart we’ve discussed all week. From Time to Panic on Tuesday:
Note that VIX need only break the purple TL [for SPX to bounce.] If VIX doesn’t break down, this should be the end of the line for this bounce.
It didn’t bounce. SPX plunged. Next?
 Or it can be slightly more complex, but still fairly straightforward — such as is the case with oil and gas.
As we all know, central bank support (low interest rates, among other accommodations) has been critical to stock prices since 2009. Low interest rates, of course, rely on low inflation. And, low inflation relies to a great extent on low oil and gas prices (more accurately, low MoM and YoY increases in those prices.
From last April in Oil & Gas, Inflation and Interest Rates: A Delicate Balance or Goal Seeking?
 The complicating factor, of course, is that oil and gas prices took over the job of stimulating algos (chief among the 90% of all trading activity which is conducted by machines) to drive stocks higher.
Most recently, oil, gas and SPX all bottomed on Feb 11, 2016 and oil and gas prices played an integral role in stimulating the subsequent rally. The most important nudge was in December 2017, when oil and gas prices broke out of an already rising channel.
To chartists, and to algos, this is a very bullish maneuver. It also has the effect of driving inflation and interest rates higher. CPI rose from 2.11% in December 2017 to 2.95 in July 2018. The 10Y rose from 2.31% in December to 3.24% just a few weeks ago.
The Fed told us they were okay with this, that they were going to let the economy and inflation “run hot.” I was among the many doubters, citing the damage that higher rates would inflict on our already alarming budget deficit, but darned if they didn’t do it anyway.  I suppose that, at the end of the day, a temporary increase in the rate at which the debt and interest expense are expanding was less important than having a higher perch from which to crash rates during the next GFC.
Stocks ignored the implications for a while, happy to play follow the leader with oil and gas prices. The day that RBOB popped out of the rising purple channel was the day that SPX popped above its 2.24 Fibonacci extension at 2703 – a level which might otherwise have provided serious overhead resistance. It can be seen as the horizontal, purple trend line on the chart below.  In early February, though, RBOB’s breakout faltered. No surprise, but SPX followed along, suffering its biggest and sharpest decline in years. Like magic, RB quickly popped back above the purple channel top – rescuing SPX and helping it back above 2703.
Note that SPX went on to new all-time highs in September, only after RB backtested the purple channel and bounced higher.
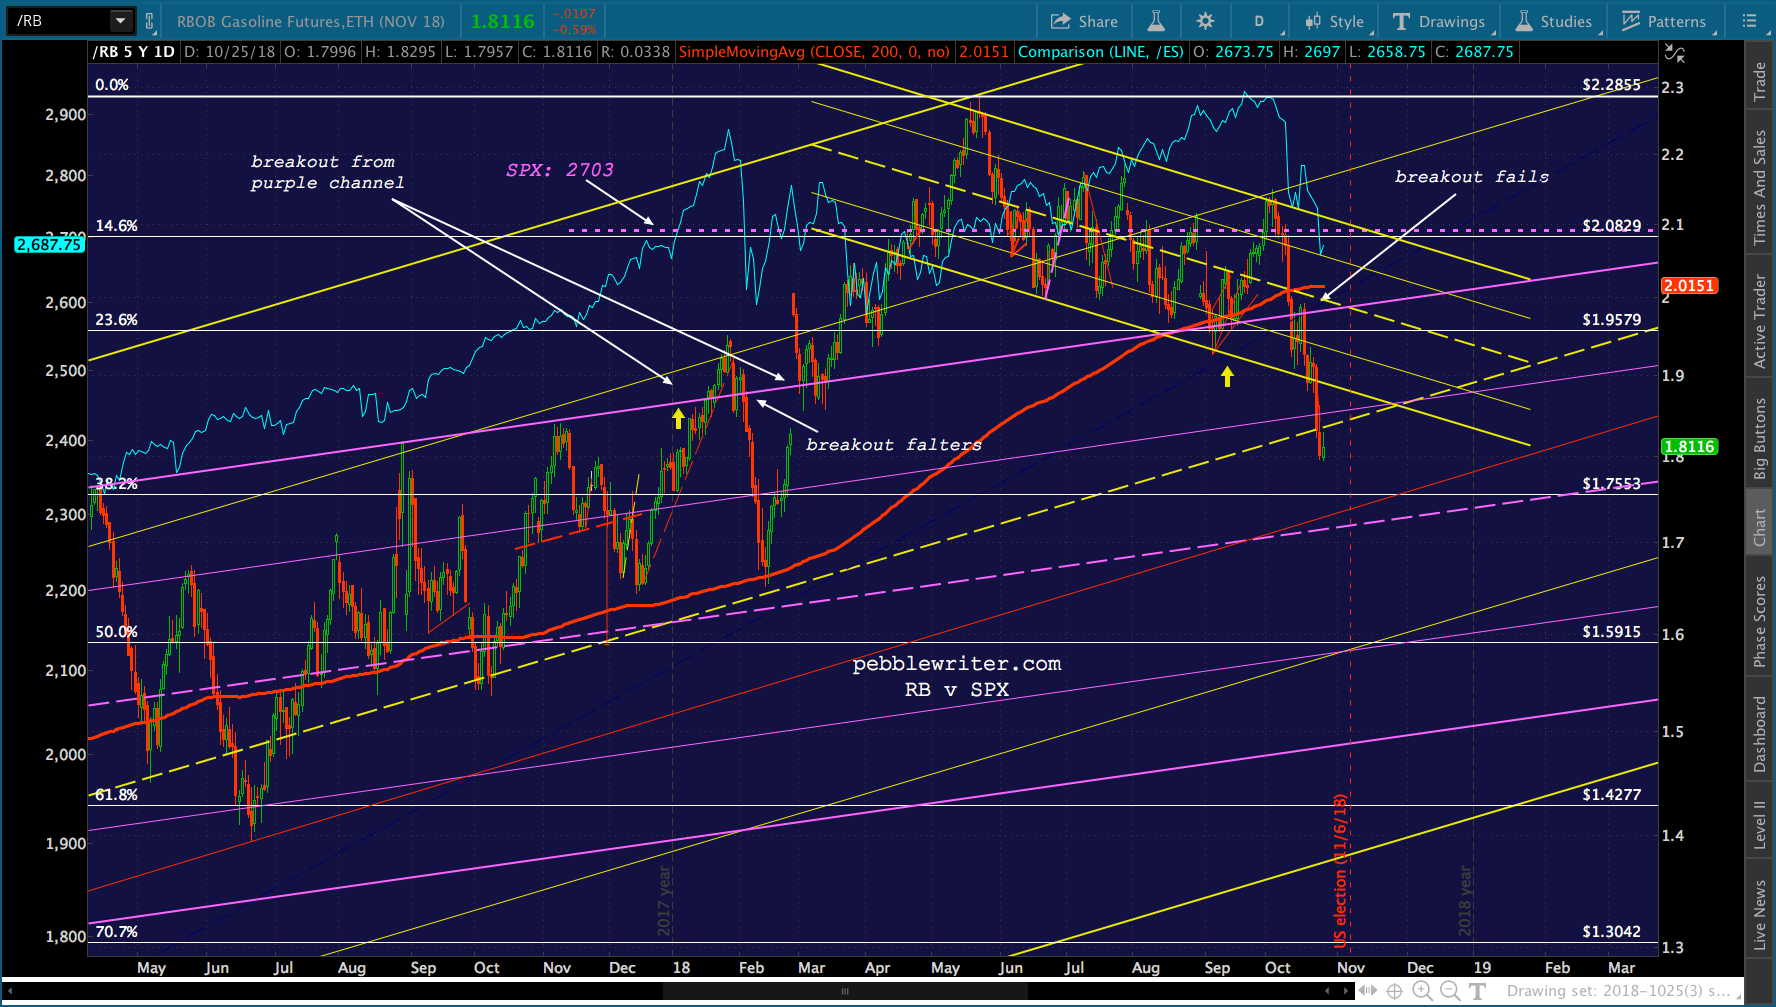 And this lovely little correction we’re enjoying? SPX topped the day that RB failed to break out of the falling yellow channel (also the day of Khashoggi’s murder.) SPX fell through its 200-day moving average on the day that RB plunged back below the purple channel top. And, SPX plunged below 2703 on the day that RB fell out of the falling yellow channel.
With the elections less than two weeks away, I’m not expecting a sharp rebound in oil and gas prices any time soon. So, the algos will have to rely on other tools — such as VIX, which has now shed 12.5% since tagged our 26 target yesterday.
So far, VIX’s decline has produced a pretty nifty bounce. Is it enough to offset weakness in oil and gas and a hawkish Fed which has been browbeaten by a “low-interest rate president?”
continued for members... (more…)
Over the last 20 years, we’ve seen two yield curve (2s10s) inversions: essentially all of 2000 and Dec 2005-May 2007. The inversions themselves posed no issues for equity markets. It was the dramatic unwinding of those inversions that produced crashes. Eight months ago, we almost had another. 2s10s had fallen to a trend line connecting those two previous curve lows. Instead of bouncing, however, 2s10s continued falling — reaching a low of .18 on Aug 27.
Unfortunately, the optics of this approach to an inversion are troublesome. It is commonly believed that inversions presage recessions. So, the brain trust in the Eccles Building has a little tightrope walking to do.
They need to increase the short end of the curve to stave off (understated) inflation and build some cushion for the next financial calamity. But, to avoid an inversion, they must scale back their intervention in the 10Y — at least enough so it can keep pace with the rapidly rising 2Y.
 Eagle-eyed observers might note that both recently out above the trend line connecting previous highs. Not so coincidentally, this occurred as the above-referenced trend line connecting the 2s10s lows was breached and equities began their Jan-Feb swoon.
 Can the Fed keep the plates spinning a little longer? Without question. Especially if Powell is successful in convincing
 investors algos that the economy is strong but there is no wage pressure and inflation poses no real threat.
Should that narrative fail, however, the spectre of higher rates alongside soaring debt levels might finally awaken equity and bond investors to the elephant in the room.
 * * *
* * *
So far, the damage resulting from Friday’s channel breakdown has been contained to the August highs. 
 But, still ahead, EIA inventory reports and the FOMC statement and press conference.
continued for members… (more…)
Catch this news flash yesterday? Trump, ironically at a White House meeting with the National Council for the American Worker:
You’re gonna see on China, today, right after close of business…we’ll be announcing something, uh, and it will be a lot of money coming into the coffers of the United States of America, a lot of money coming in, but you’ll be seeing what we’re doing uh right after close of business today, the markets closing. Thank you.
Note the repeated emphasis on the market’s closing. Was there something about the announcement that required a delay? To paraphrase…the after-hours markets are the devil’s playground.
The S&P 500 plunged 22 points from Friday’s highs, then recovered just in time for a well-engineered close: down only 16 points on the day. More importantly, it closed at 2888.80 – just above yesterday’s 10-DMA at 2888.70 (2888.80 today.)
After the close, of course, the futures tanked – shedding 14 points before being saved by the usual suspects: VIX, WTI and USDJPY. Trump’s announcement didn’t come right after the close. In fact, it didn’t come until after 3 1/2 hours had passed. Why? That’s how long it took to get the safety net properly positioned. USDJPY, which had just backtested its IH&S neckline, spiked sharply moments after the announcement.
VIX, which had just backtested the broken white channel, suddenly reversed and headed lower.


The overnight action was impressive, with the usual timely plunges when ES faced important tests. How much more of a smackdown will resurrect stocks’ rally? Whether the rebound will hold or not is anyone’s guess. China has already announced retaliation – which Trump insisted will lead to a $267 billion expansion of US tariffs.
Futures are under pressure again, and interest rates are threatening to break out on the obvious (to everyone except Trump, apparently) inflation threat that tariffs pose. Might investors care that the trade wars could, as Jack Ma theorized, last for 20 years?

continued for members… (more…)
Today should shape up as a battle between holding a much-cherished round number (SPX 2900) and backtesting solid support (the January highs.)
The futures are off about 5, with yesterday’s downside target of 2878.50-2881.95 still looking good — if SPX will relinquish 2900.
Much will depend on the yen, which is strengthening in the midst of the EM turmoil…

…and the 10Y, which has been in a holding pattern for months. It looks ripe for a breakdown, but that would almost certainly invert the curve and usher in more than a backtest.


continued for members… (more…)
