

Two steps forward…in order to accommodate a big step back.
We’ve seen it countless times in the lead-up to Fed meetings, GDP reports and, lately, jobs data. With May unemployment expected to top 20% (it’s unofficially already there) after another 7.5 million joined the jobless ranks… …the market’s caretakers put a 58-pt cushion into the market. ES’ 10-day moving average, for instance, is about 87 points below last night’s highs. Had ES instead fallen 87 points from yesterday’s lows, it would mean a risky test of its 200-DMA.
 It’s gratifying to see scores of analysts come to the realization that the markets are being heavily influenced (a more accurate word is manipulated) by massive Fed stimulus. But, as members know, this has been going on for years – particularly as stocks reach key levels of overhead resistance.
With the Dow finally joining SPX in reaching its 200-DMA on Wednesday and several key components (e.g. AAPL) taking great pains not to break out to new highs, it seemed as though we might get at least a pause in the meltup, maybe even a correction.
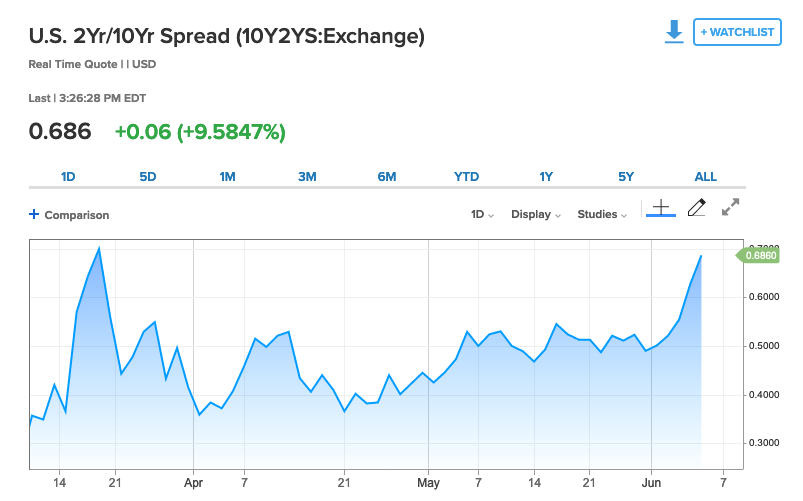
Our yield curve model confirmed it yesterday with the 2s10s breaking out above all recent highs except that seen in late March. Now, we’ll have to wait and see whether the algos, being directed this morning by USDJPY, VIX and CL, are intent on notching new highs or will, temporarily at least, reconcile with the real world.
continued for members…
More deets on the yield curve… The 10Y has spiked higher (risky enough in its own right as debt soars out of control)… …while the 2Y is only inching higher.
 This puts the 2s10s up at almost its March highs.
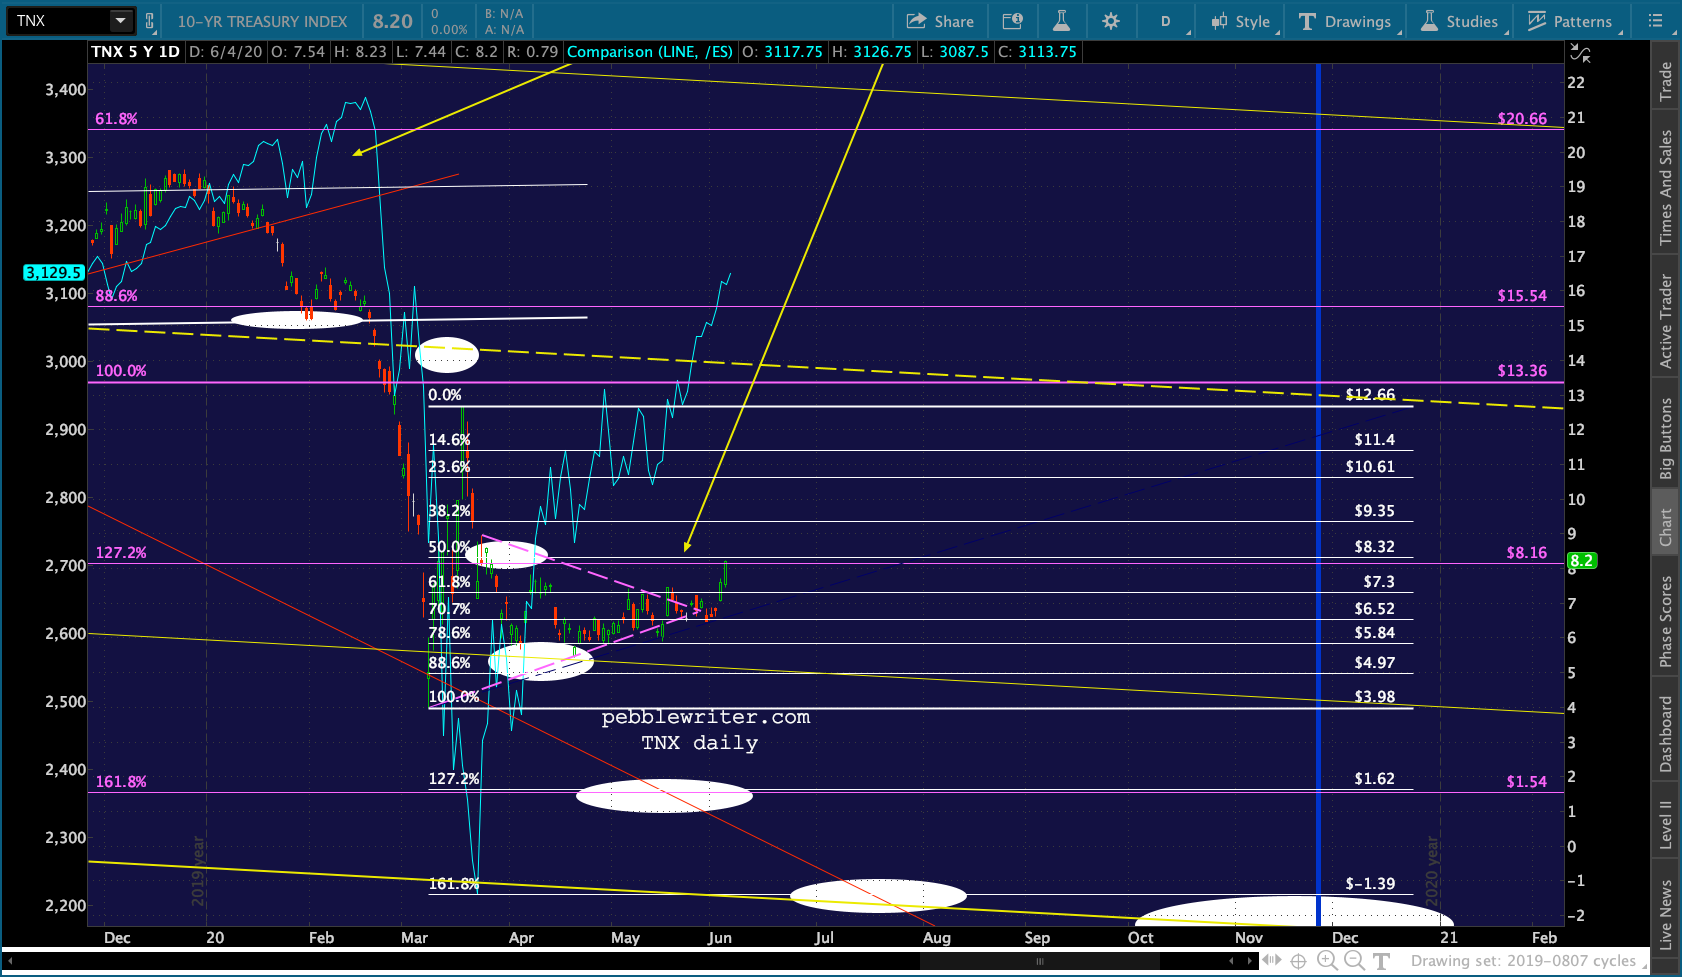 TNX is backtesting its purple 1.272. A push above it will widen the 2s10s and a broad equity selloff would likely usher in another plunge in rates.
Aside from preventing big drops in SPX and DJIA, TPTB are no doubt focused on NKD, which needed this little breakout in USDJPY… …in order for NKD – up 47% from its March lows (and channel breakdown) – to reach its .886 and channel midline. The BoJ knows about V-shaped recoveries.
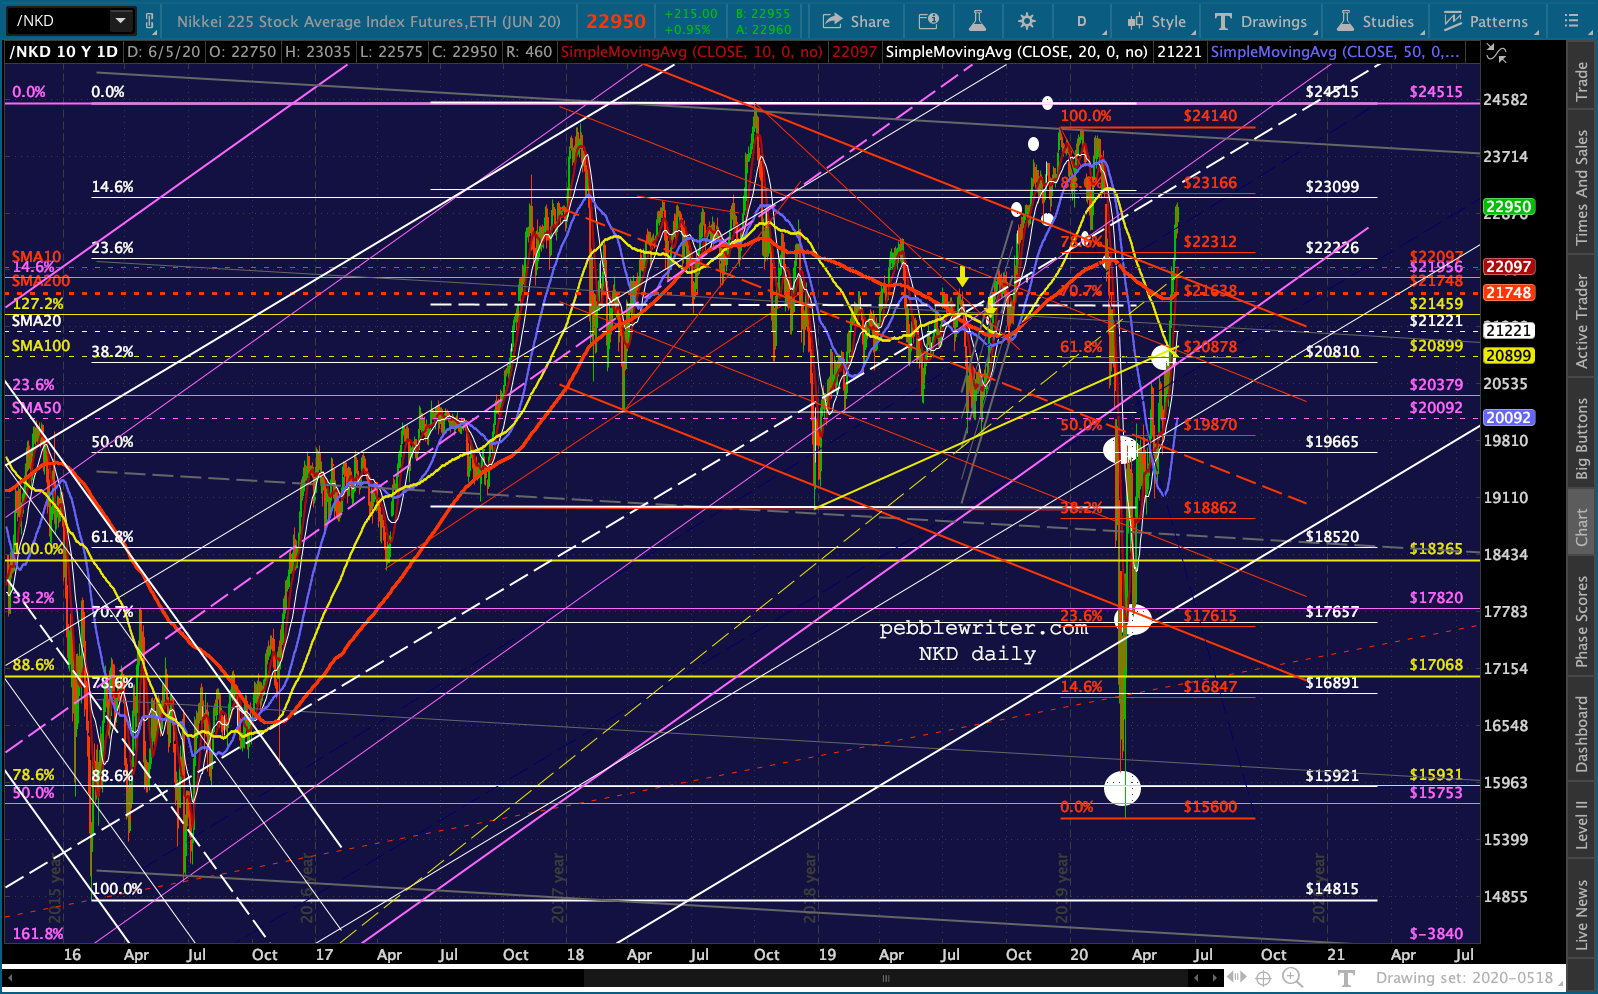
 Elsewhere in the currency world, we’re seeing a bit more of a reversal in EURUSD. This might finally be the top of the meltup.
  Though, it’s important to note that DXY has downside potential to 94.2 if the latest red TL (and, obviously, the Mar lows) doesn’t hold.
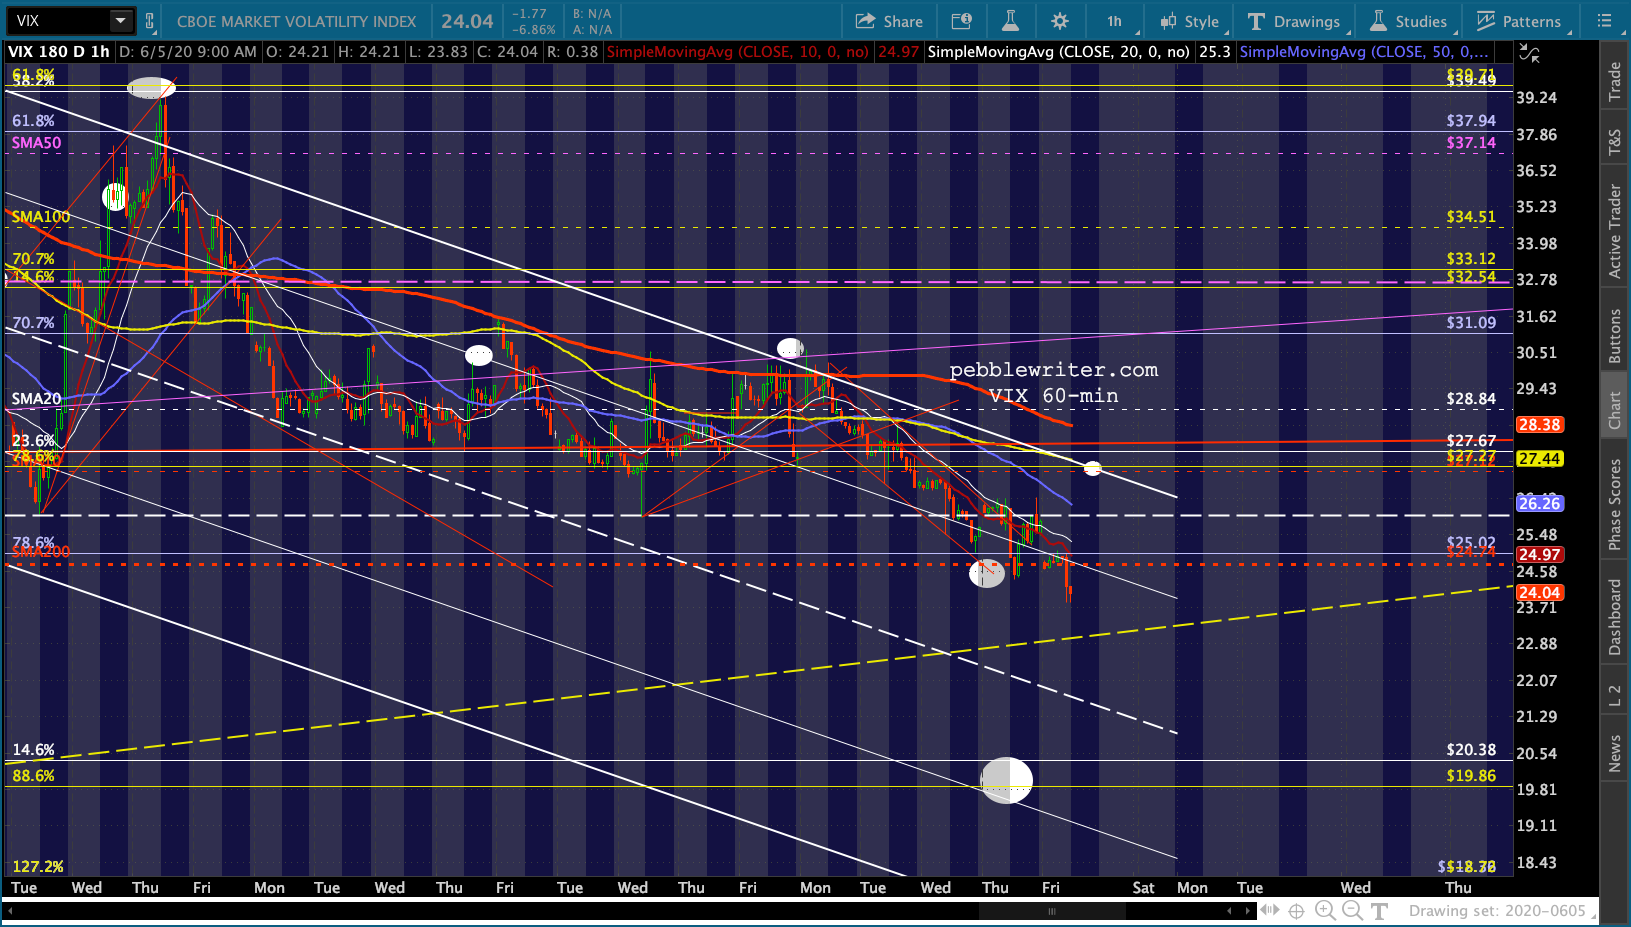
 VIX’s re-tag of its SMA200 is easing up somewhat, with the SMA10 now in alignment with the white channel top.
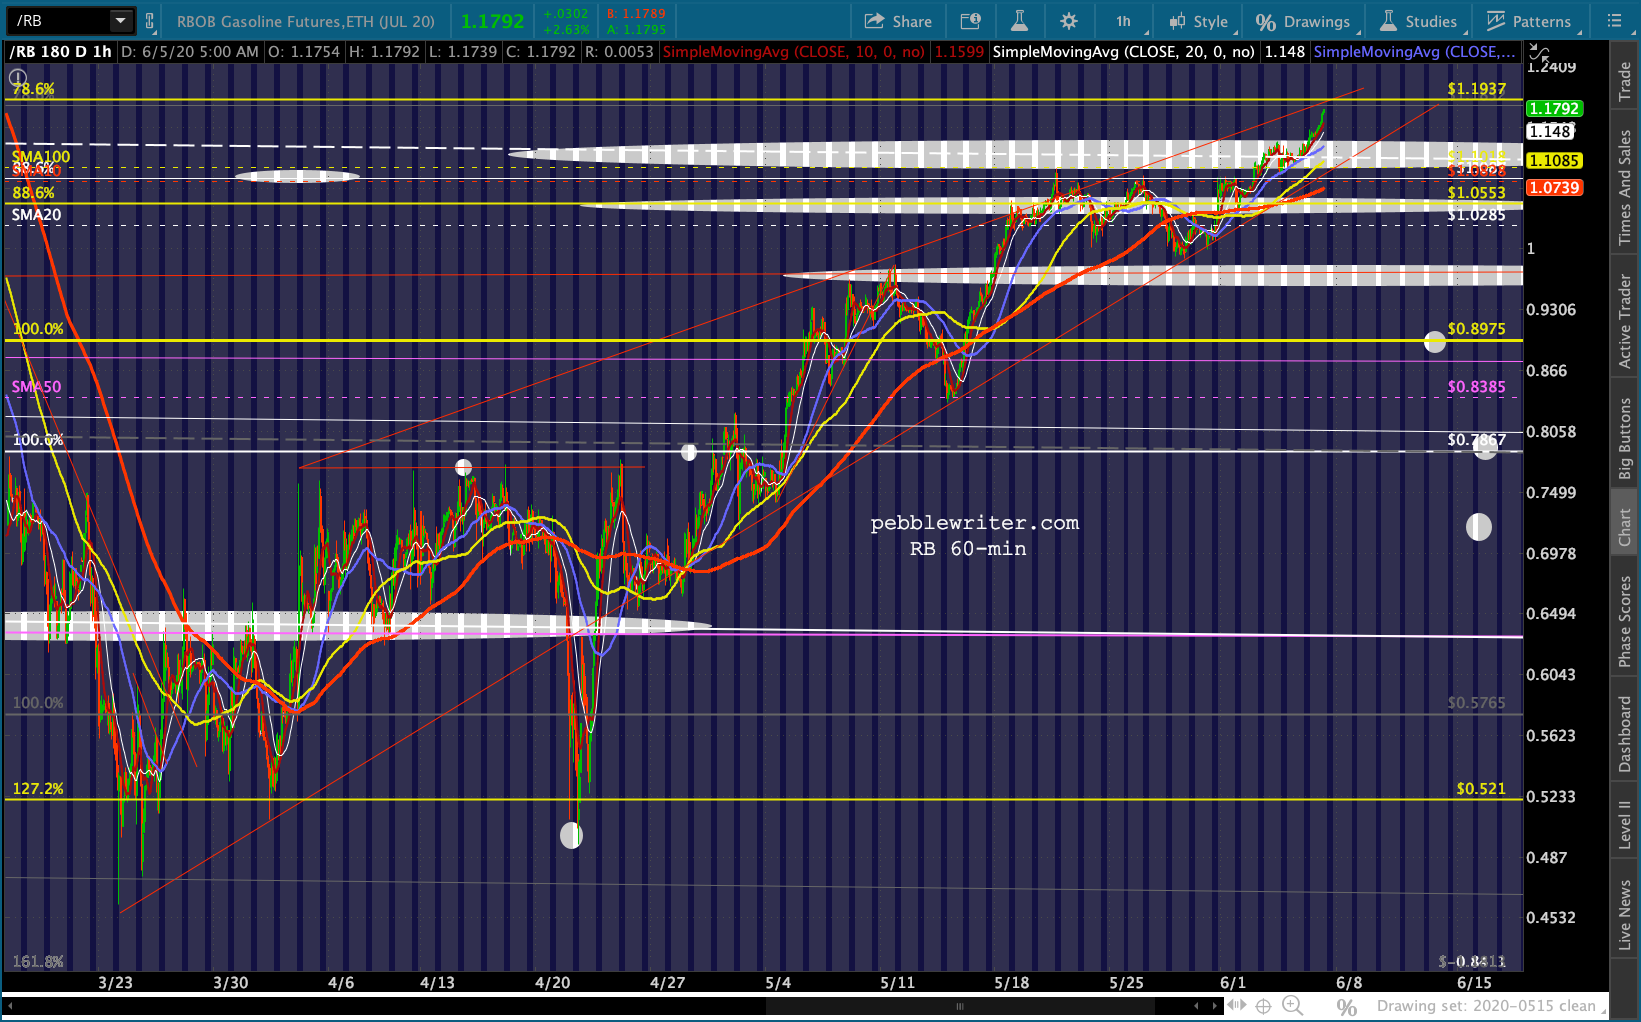
 While oil and gas are spiking higher on rumors of an OPEC+ agreement on Saturday, they are drawing still nearer to the most important upside targets. RB has a gap to fill at 1.245 and a channel midline and SMA200 at 1.3661.

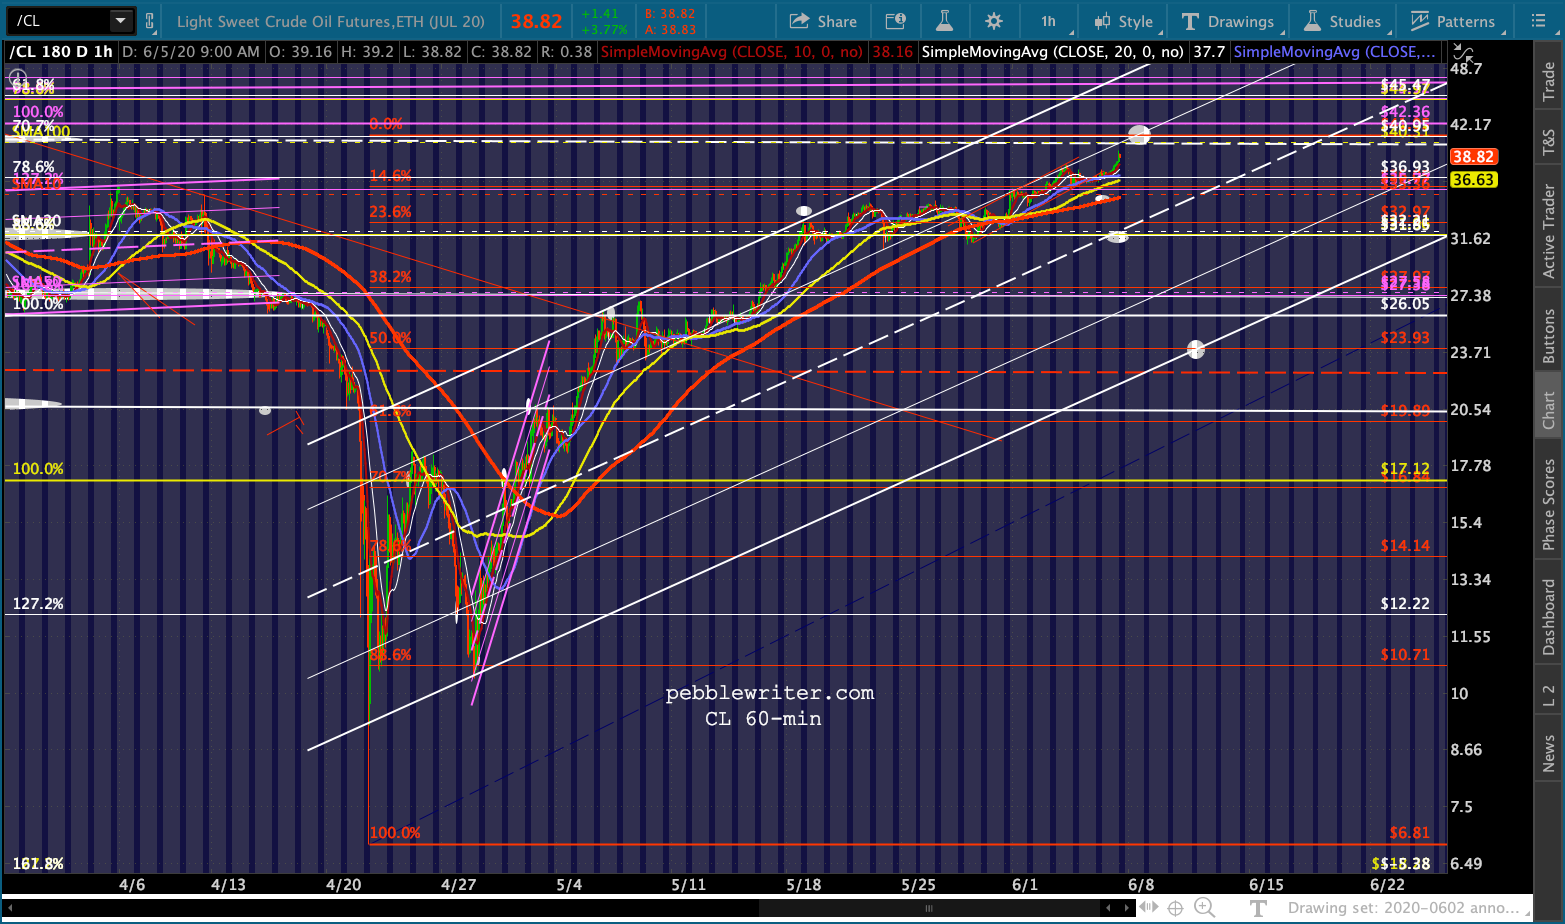
 While, CL has a major gap to fill and a channel midline at 41.05.
 If the ramp can fall to 18 points or less post the jobs report, we need not worry about immediate new highs for SPX. Again, AAPL passed up an opportunity to make new highs, coming within 0.5%.
  For COMP, it whiffed by about 1.3%.
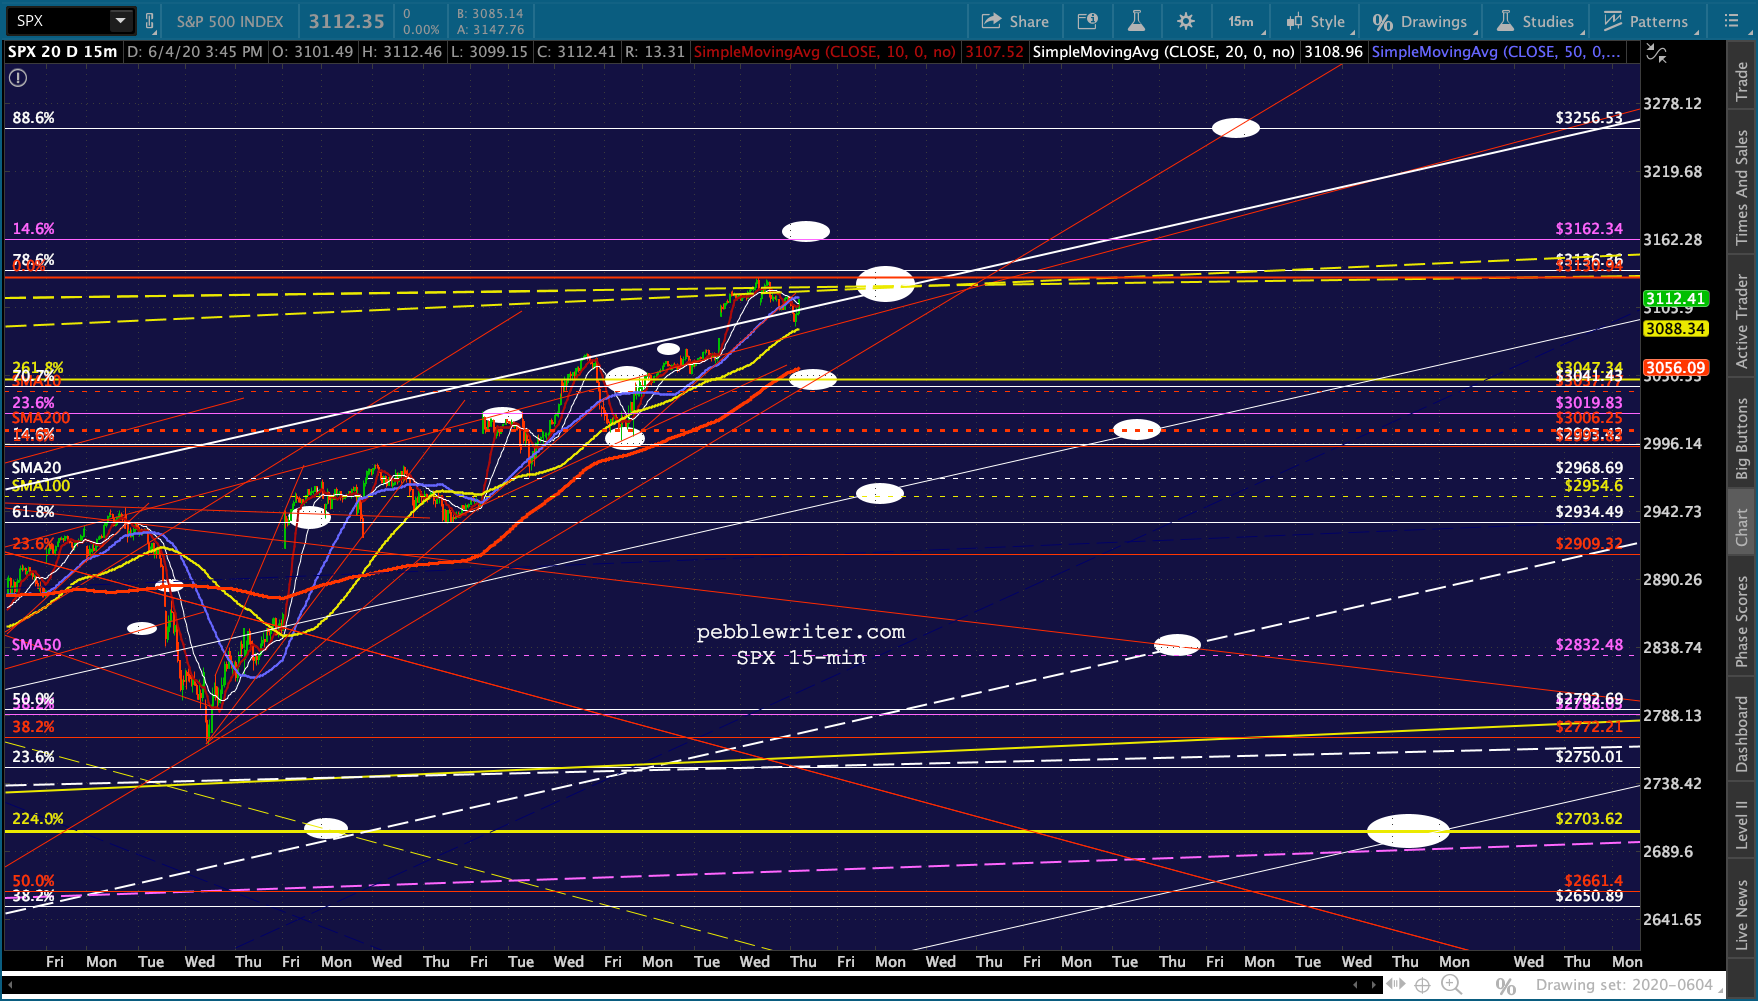
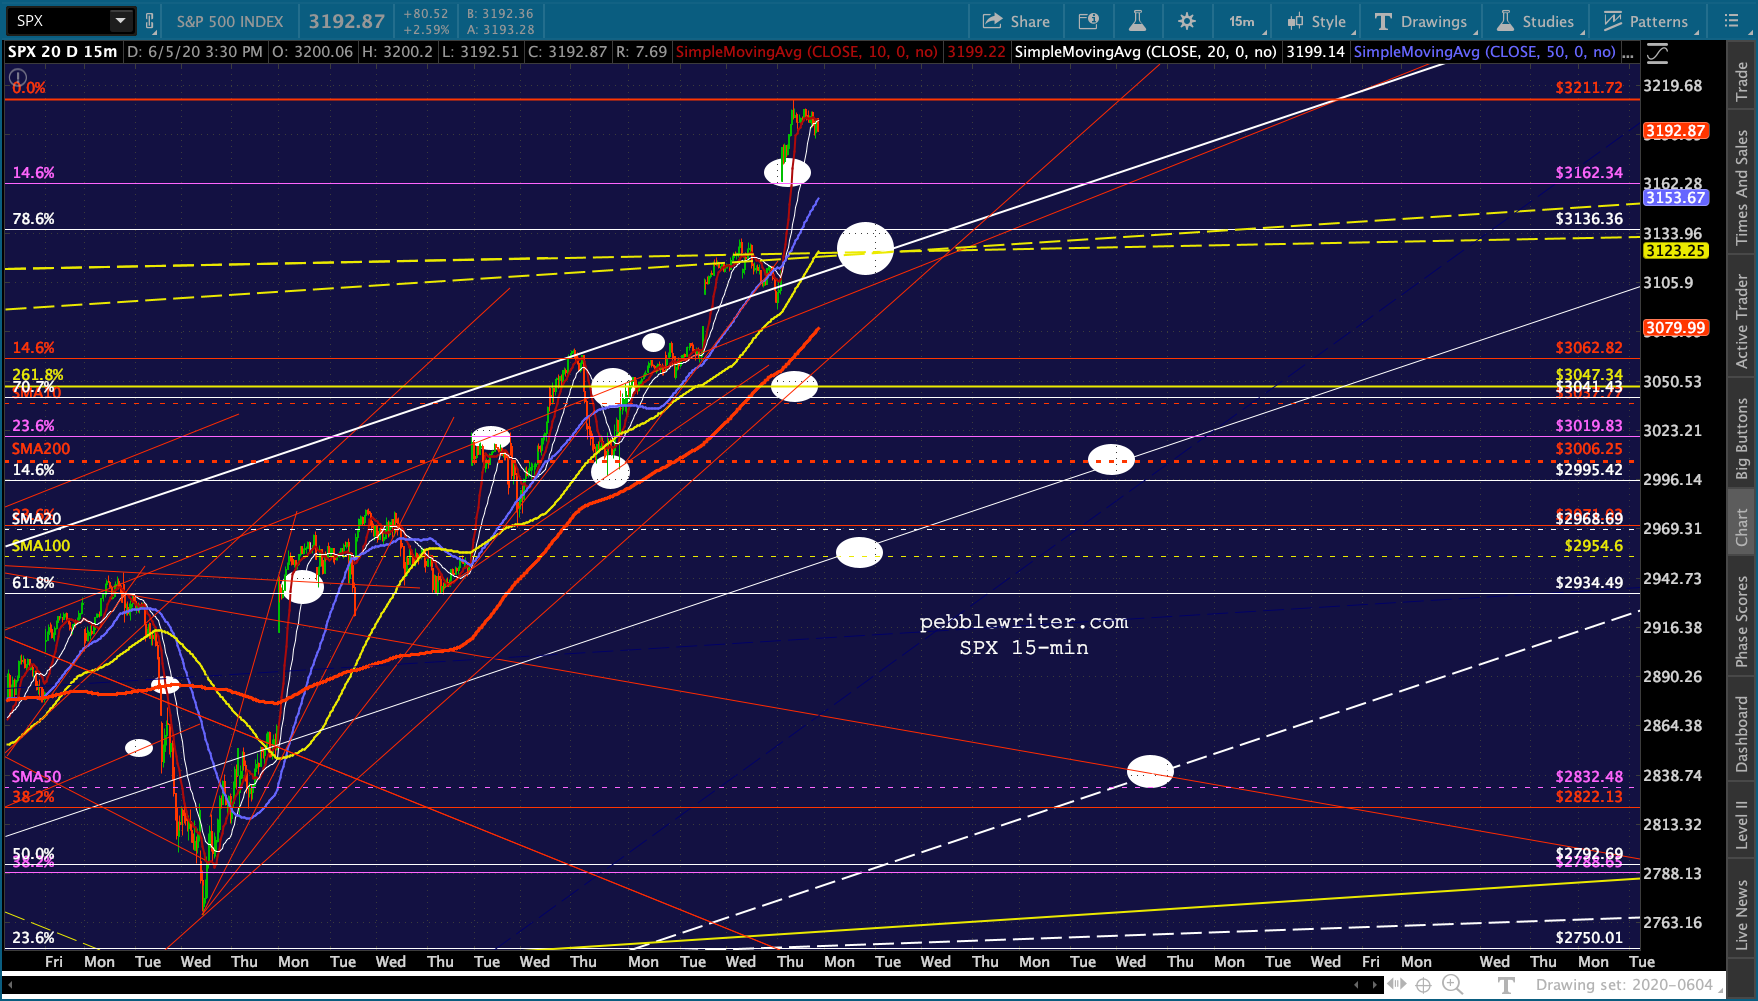
 Assuming this was purposeful, we’ll focus for now on downside targets for SPX. If only a slight increase plays out, we have the .786 target at 3136.36.
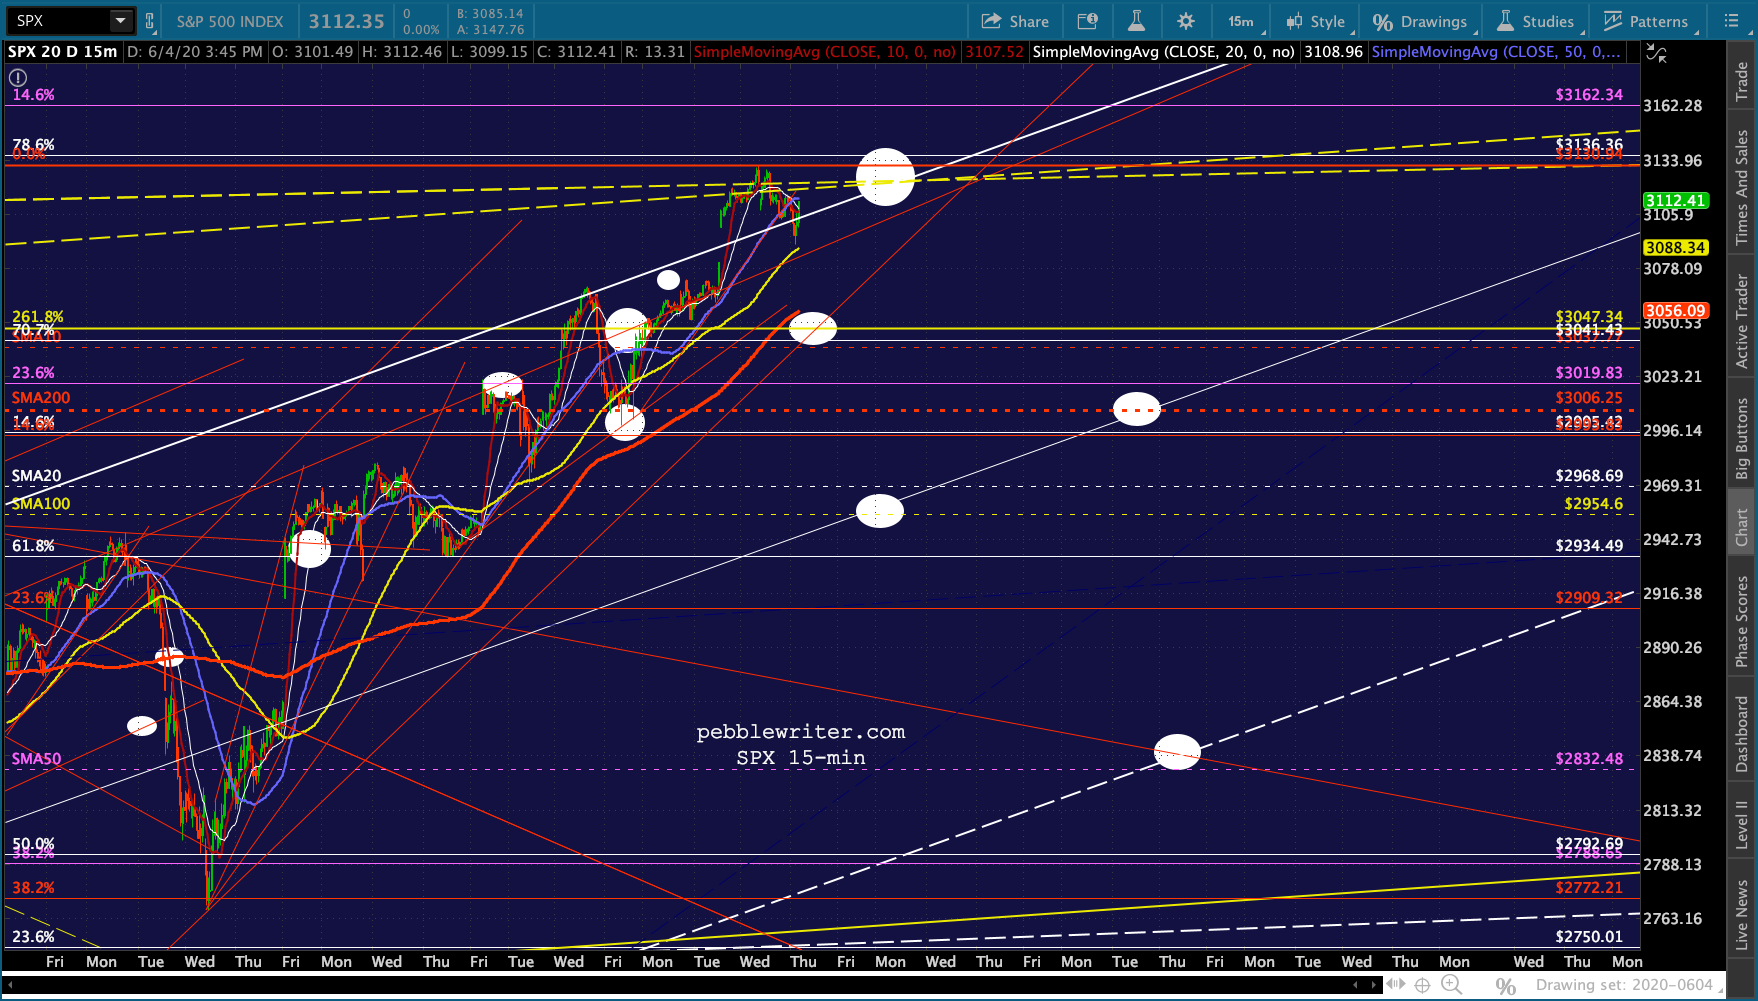 The ES version:
 One other stock we’ve watched from time to time is DB – which is demonstrating the determination of the ECB to keep it alive. We’re seeing a breakout of the rising channel…
 …following another break back into the previously broken large white channel.
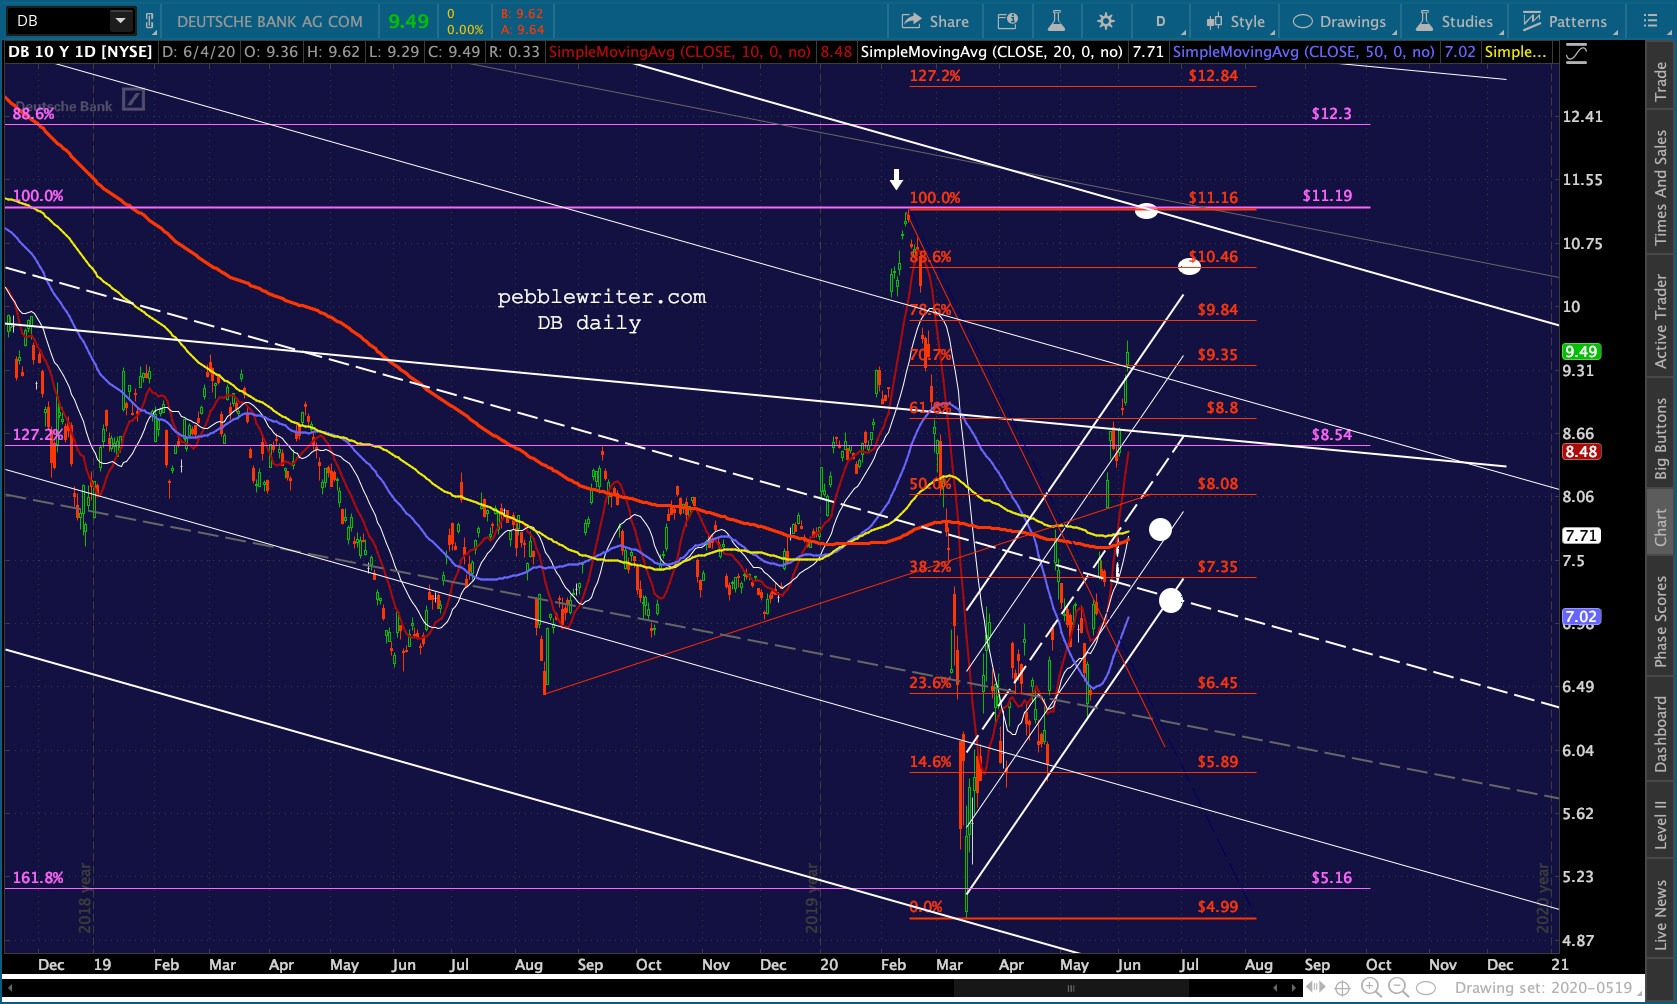
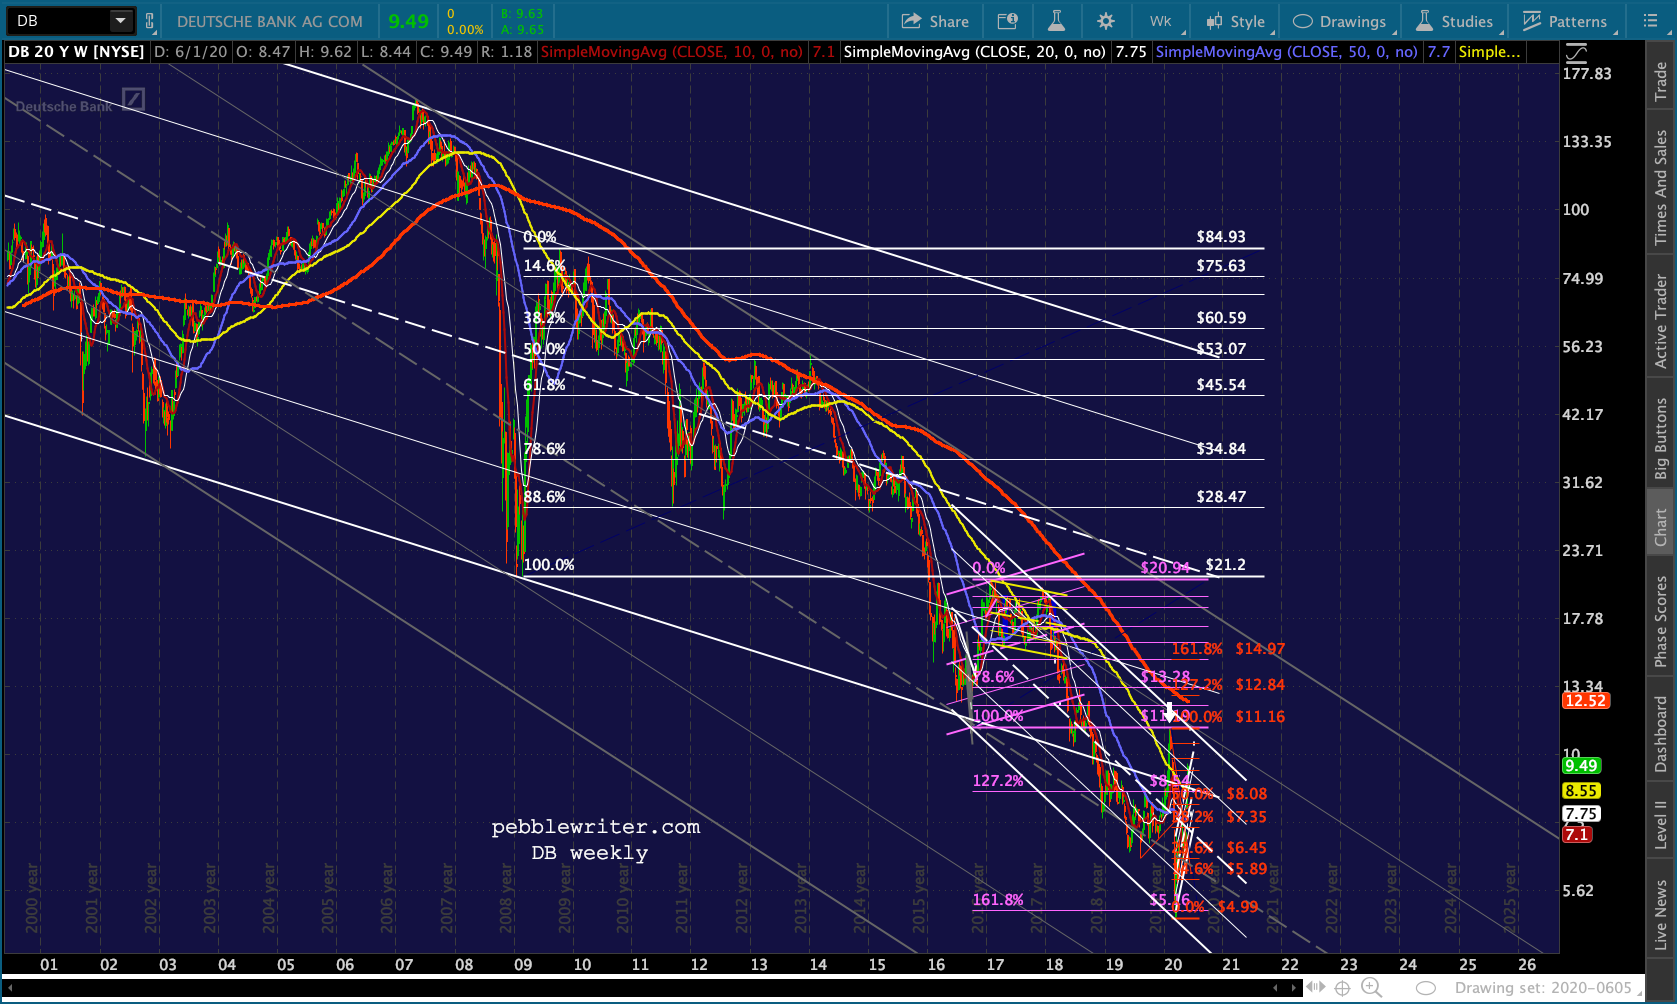 This, as the bank is struggling to even survive.
I have to step out for a while, should be back around the open. GLTA.
UPDATE: 9:15 AM
Huge beat on employment – more on that in a minute. In the meantime, breakouts and new highs all around – except for AAPL.


 I’m skeptical about the employment numbers. IMO, adding 2.5MM jobs when the consensus was an 8MM loss is such a huge miss that it demands skepticism. And, I’m skeptical by nature.
I think there is little doubt that many politicians will do what it takes, within bounds, to get reelected. Whether or not you’re a Trump fan, we’ve all seen him apply pressure to other governmental officials (e.g. Fed chairmen.) So, why not the commissioner of the BLS in the face of jobs data that could sink the market and his reelection?
I know nothing about BLS Commissioner William Beach except what I find online. He was nominated to the job in Oct 2017. Since 1991, he has been employed by various conservative/right-wing think tanks such as the Institute of Humane Studies at George Mason, the Heritage Foundation, and the Mercatus Center, also at George Mason. All have been funded by the Koch brothers among others.
Would such an individual be beyond political pressure? It’s worth considering. His boss, Secretary of Labor Eugene Scalia, is the second secretary to be hired by Trump. The first, of course, was Alexander Acosta (of Jeffrey Epstein plea deal fame.) Scalia is the son of the late Supreme Court justice Antonin Scalia, a hard-line opponent of abortion and affirmative action.
Scalia, the son, spent 20 years with Gibson, Dunn and Crutcher, defending corporations against labor-related lawsuits, and is a member of the conservative Federalist Society. Food for thought.
UPDATE: 3:35 PM
The 2s10s has backed off slightly, but is still broken out – signalling trouble ahead for equities unless it drops back to .52-.56.
 ES is slipping back toward the white channel top, which would allow that channel to continue to guide prices, treating today as an intraday overshoot. If it closes above 3192.75ish, though, it suggests a breakout of the rising channel – a very bullish signal, even if it is completely bogus.
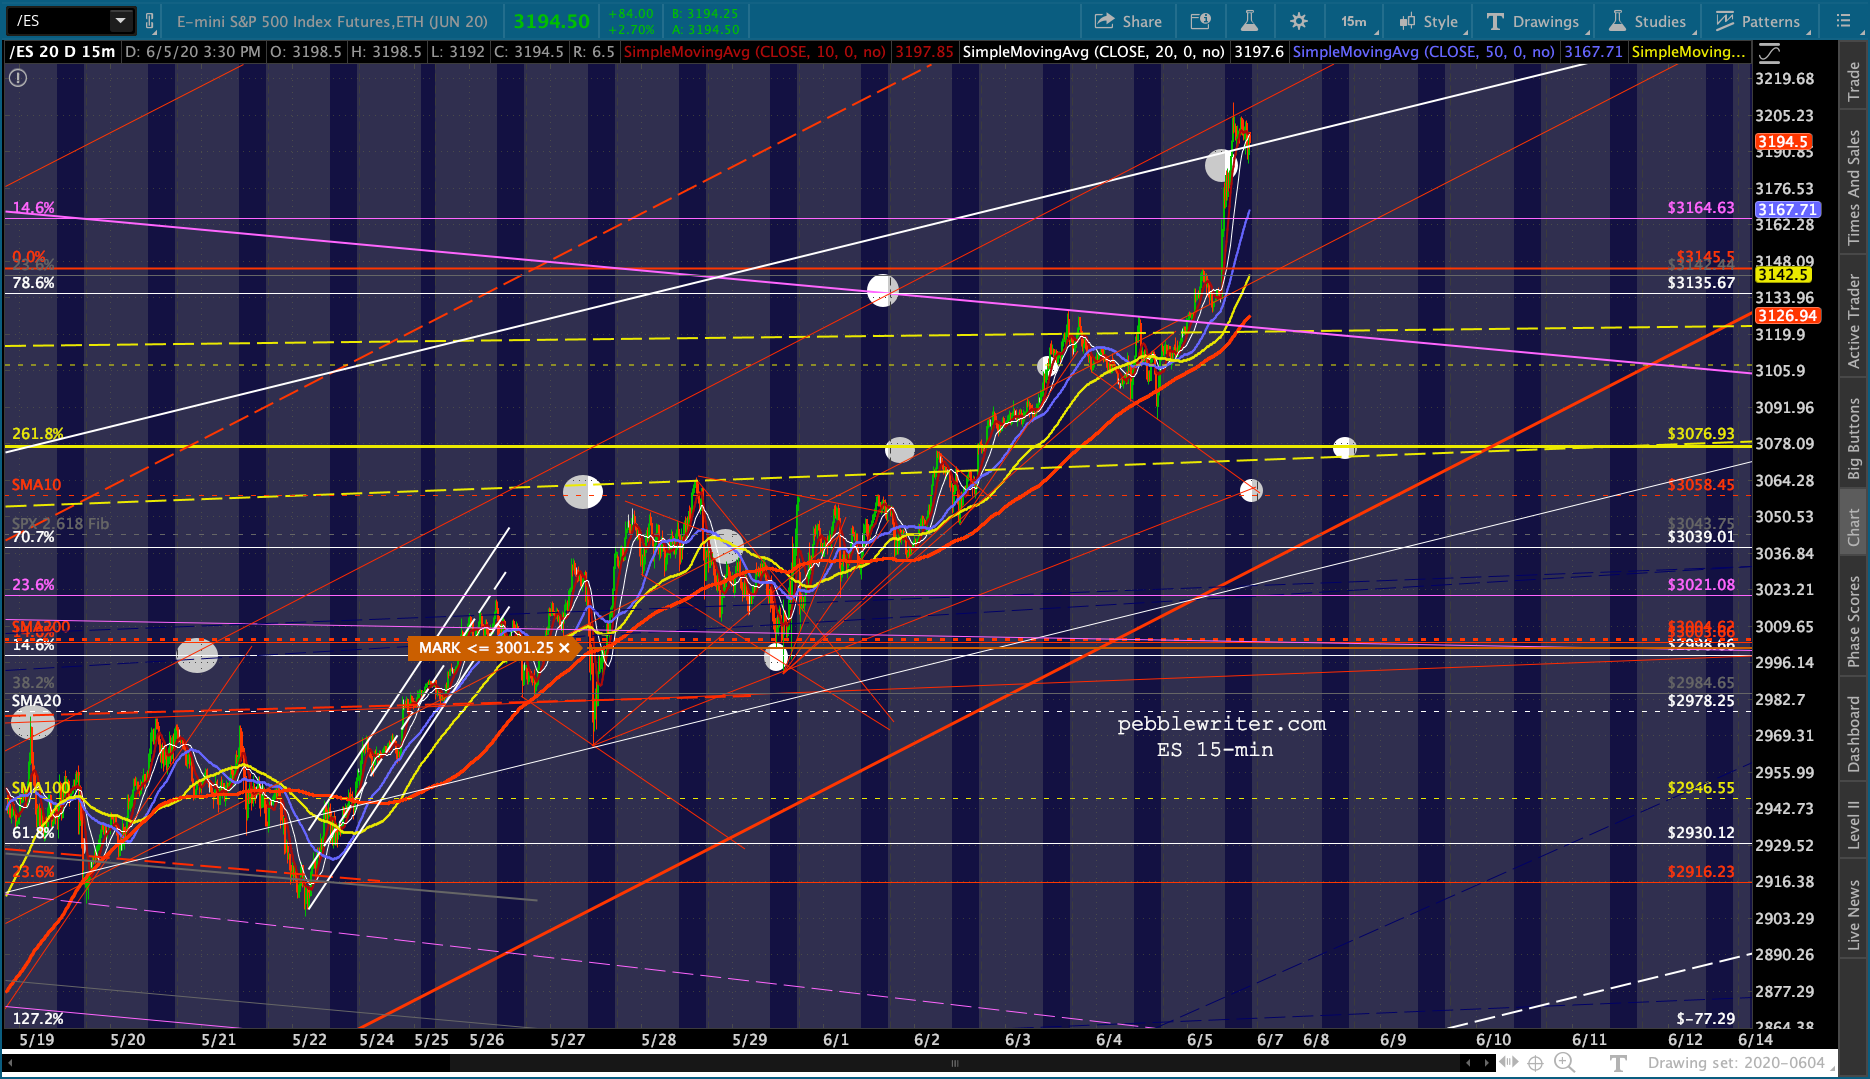
 SPX faces a similar situation, though the breakout is at 3130-3135ish. So, it’s unlikely to get back there before the close.

 Oil got pretty close to its gap close at 41.05, reaching 39.68.
 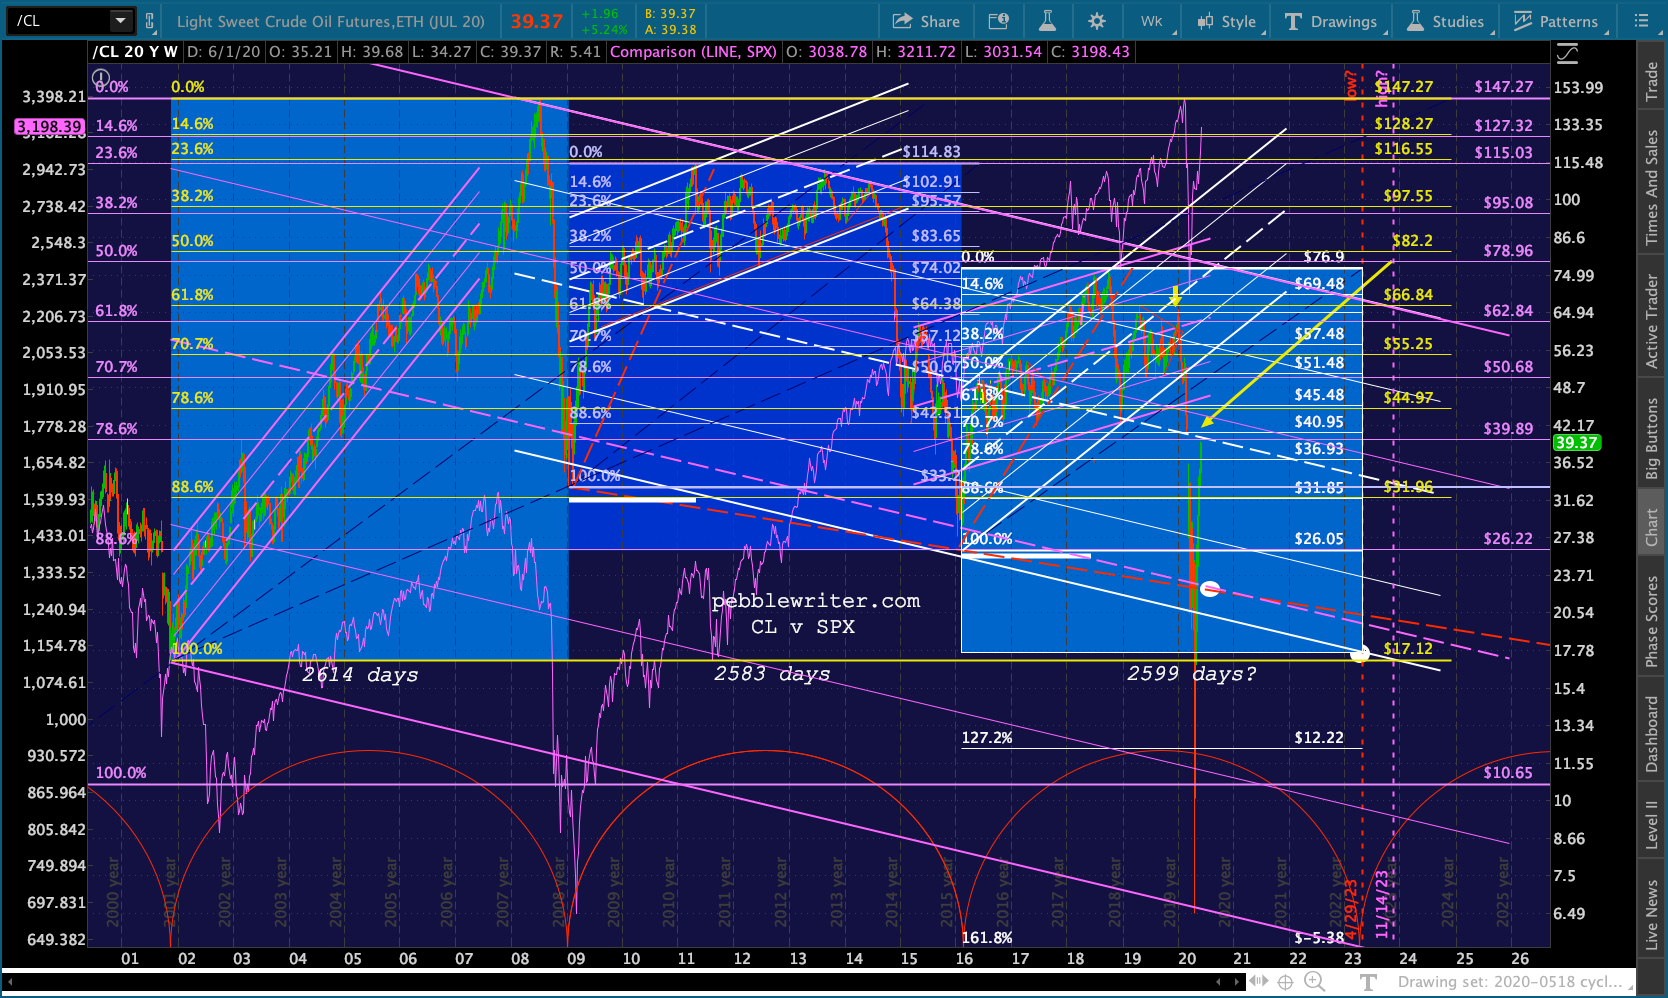 For RB, it was 1.217 vs 1.245 (the Dec 2018 lows) and 1.366 (the SMA200) or 1.384 (Mar 6 gap.)
 By making new all-time highs, AAPL no longer argues for an imminent reversal.
 Nor does COMP, which beat its former highs by about 7 points.
 And, USDJPY is in an odd spot that doesn’t really make a whole lot of sense. It got NKD to its .886, where it should be shorted (though not without risk.)
 It would take a lot of nerve to short ahead of the weekend after such an awesome display of manipulation. Yet, FWIW. the yield curve still suggests lower prices lie ahead. It has rarely been wrong, but it can always snap back into neutral territory if need be.
And, if VIX doesn’t bounce at its yellow TL, it has easy downside potential to the .886 at 19.86. Bottom line, unless we get a strong sell-off in the next 30 minutes, this might be one of those weekends where you’re better off sitting things out (and, I will spend wishing I’d gone to medical school.)
GLTA.
Comments
2 responses to “Another Yield Curve Warning for Stocks”
For historical reference the SPX rallied 500% from the lows made in 1921 to the 1929 high. SPX crashed 45% in 1929 and rallied 50% off the lows over the next five months. The 1930 rally convinced most investors that the economy was quickly recovering even though unemployment went from 3.4% to 13%. The SPX rallied 510% from the 2009 lows when it topped at 3393 in Feb. SPX crashed 36% from the Feb high and if it rallies 50% similar to the 1930 rally it will target the gap at 3300.
Interesting observation, Tim. Will be fascinating to see how it plays out.