Beware the Fee-scal Cliff
Today’s post concludes a week of publicly available intra-day posts, my little gift to those considering a pebblewriter membership. Sorry, but the forecast is for members only.
As announced on Monday, subscription prices will increase on January 1. In keeping with the concept of paying for performance, the annual rate will be about $10 for each percentage point of return since the new site’s inception on Mar 22, 2012.
We’re up about 95% over those first nine months [SEE DETAILS HERE] so the new rates will be as follows:
- Annual: $950
- Semi-Annual: $550
- Quarterly: $375
The first fifteen to sign up for an annual membership at the current rate of $800, however, will be granted Charter Member status. Charter Member rates are locked in for the life of the site, so you’ll never pay more — no matter where annual rates end up.
If we are fortunate enough to continue averaging a little over 10% per month, annual memberships would be $1,200+ in March. So, locking in current prices is a no-brainer.
Sign up HERE.
* * * * * * * *
ORIGINAL POST: 9:30 AM EST
I remain short from 1447 on Dec 18. Time is running out for our heroes on The Hill. Market corrections don’t require that everyone turn bearish — just the handful in the middle whose selling turns the tide. Those investors who have been wondering, waiting hopefully for a fiscal cliff deal to emerge from Washington… might at least a few of them decide to rein in their equity exposure today?
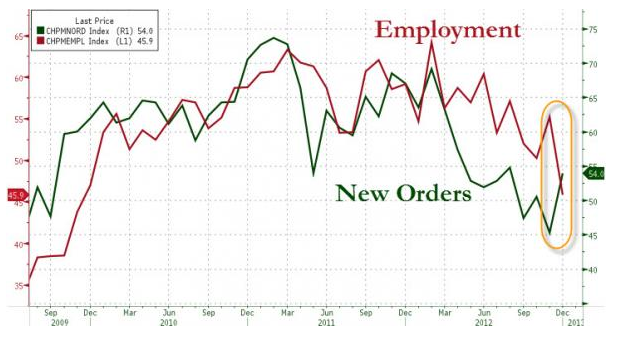
Watch this morning for the Chicago PMI — due out at 9:45 EST. Last month, it turned up slightly, but was considered bearish due to the decline in new orders. From Briefing.com:
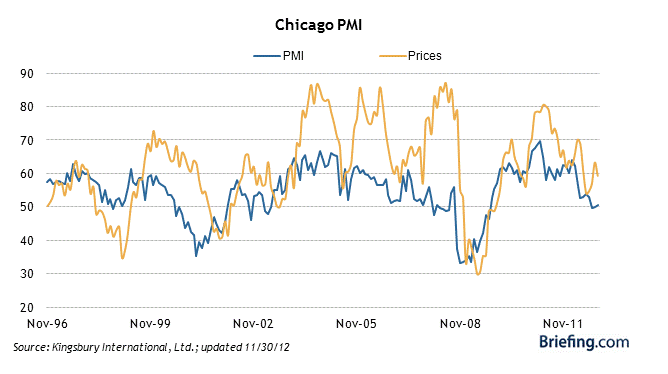
Briefing.com puts out great graphs, such as this one on the relationship between pricing and the PMI itself. Not a terribly bullish looking chart.
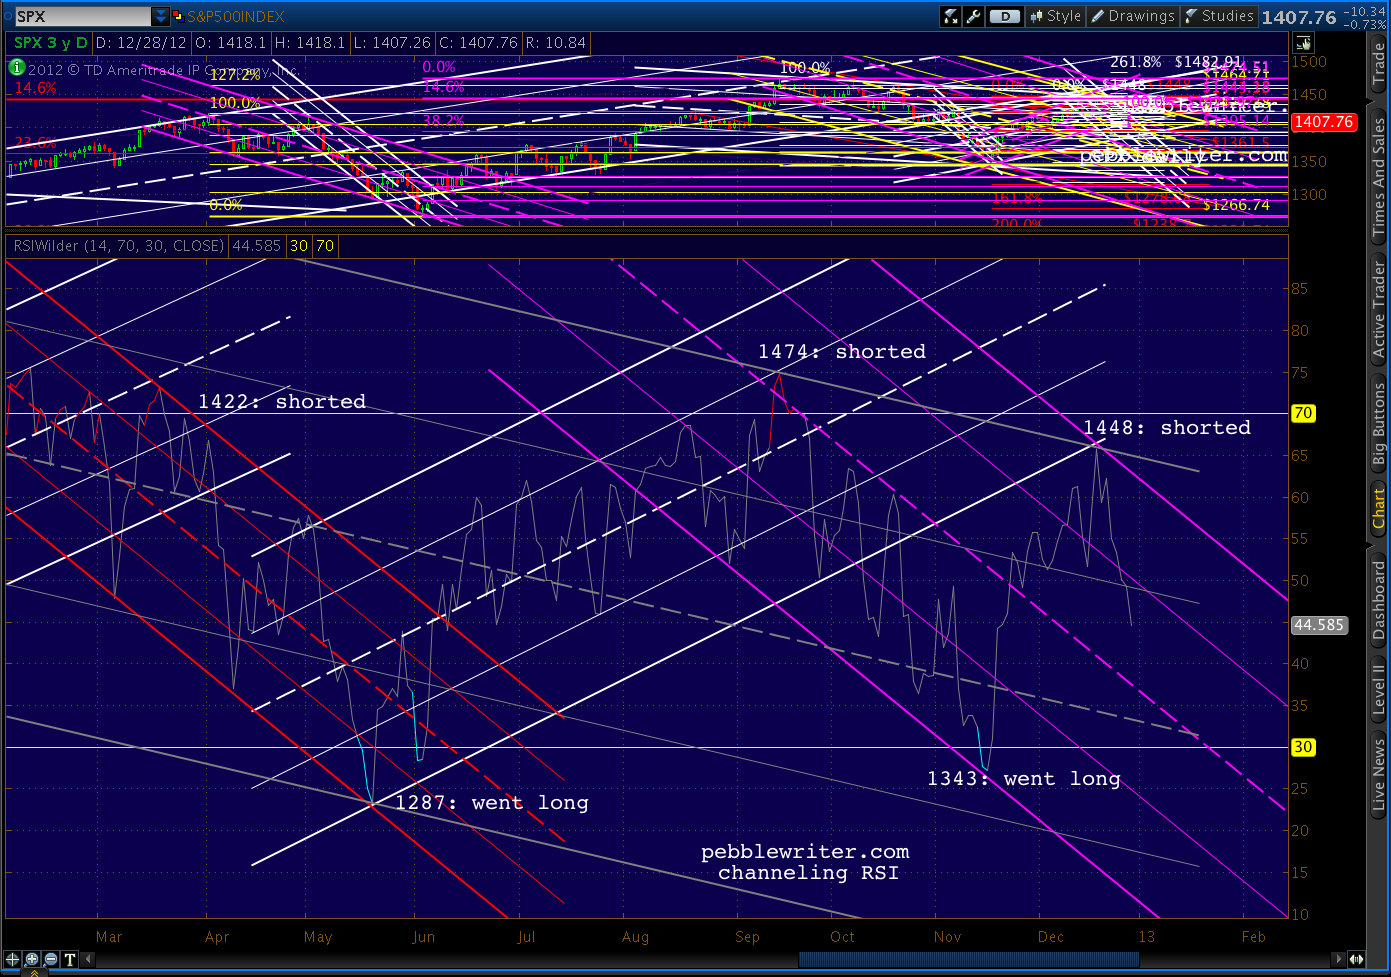
RSI has a long ways to go before finding any channel support…
 Why am I always talking about RSI? It might be the fact that it’s helped me call almost every major turn the past couple of years. As regular readers know, I employ a deceptively simple-looking practice of channeling RSI values in different time frames.
Combined with Harmonics and other chart patterns, it has been very effective in forecasting. Consider the past six months alone…
April 2 — Shorted: SPX completed a Butterfly Pattern at a channel top at 1421.05. It was also the third lower RSI value in a row on higher prices (negative divergence) after RSI tagged a channel midline. See: All the Pretty Butterflies.
June 1 — Went Long: SPX reached the bottom of an RSI channel, back-tested a falling wedge and found harmonic support — all at the price levels forecast by an analog that had been going gangbusters since April 9. See: Why I’m Buying.
September 14 — Shorted: SPX had completed a Bat Pattern that dated back to October 2007, tagged RSI and price channel lines. VIX and DX RSI channels also indicated impending reversals. See: The World According to Ben.
November 16 — Went Long: SPX had reached three important harmonic targets, reached a H&S Pattern target, tagged RSI and price channel bottoms — all at a price level forecast on October 31. See: CIW Nov 16.
December 18 — Shorted: Prices overshot our forecast target by 6 days and 10 points, completing a Gartley Pattern set up by the 1474 – 1343 drop. But, in the process, daily RSI completed a perfect back-test of the recently broken channel that had governed the rally since June. See: CIW Dec 18.
Together, these major moves accounted for returns of about 40% since the new site’s inception on March 22. The other 55% came from interim swings ranging from an hour to a few weeks. But, all of them were influenced by RSI channels, which frequently provided a signal quite contrary to popular thinking.
I don’t know of any analysts who use RSI channels. In fact, a Google search for the term “RSI channel” shows a whopping 3 hits in the past month — two of them from this site. Have folks tried them and failed, or are they just too complicated?
Though they’re almost always obvious in the rear-view mirror, RSI channels can be very difficult to use in forecasting. Charts drawn in different time frames can suggest very different results. They’re tough to use in choppy, directionless markets. And, divergence is always a challenge.
In short, RSI channels aren’t for everybody. It helps if you enjoy staring at charts for hours at a time, and can pick out patterns in a jumble of seemingly random lines. It also helps to understand higher math, as RSI is essentially a derivative of price movements (magnitude and velocity of price changes.)
If you’re thinking about using RSI channels, you might want to start with an aptitude test — available here. Or, just tune in each day and I’ll let you know what I think. After a year of practice and a few thousand charts, I view them as an indispensable secret weapon.
UPDATE: 12:20 PM
Chicago PMI [download here] actually increased from 50.4 to 51.6 this month — though it would still have been below 50 if not for the always handy “seasonal adjustment.”
The increase again conceals a troubling development: employment and capital spending are both sliding. New orders rebounded almost to October levels, but CapEx hit a new 28-month low, while employment plunged from 55.2 to 45.9 — the lowest level in three years.
 Lest my bearish leanings sway you, here’s how ISM itself assessed the report:
The Business Barometer was guided higher almost exclusively by a sizable advance in New Orders. In spite of the rise in the Chicago Business Barometer, five of the seven business activity indexes declined in December, most significantly the Employment Index.
In other words, any decline in New Orders — the big “winner” this month — and the whole index will head south for the winter.
UPDATE: 2:50 PM
The market continues the kind of slow-motion shuffle to the exits you might see in a crowded movie theater when that first whiff of smoke is noticed.
Note the impending H&S Pattern (in yellow) completion at 1402 — a scant 4 points below today’s low. It targets 1354 — right at the Fib .886 of the 1343 – 1488 rally. We’ve laid the proper groundwork for Bat, Butterfly and Crab patterns in the 1355-1368 range.
But, of course, this refers to the next leg down — not the entire move.
I don’t know whether the fiscal cliff will be deemed “solved” in the next hour or not. I think we can all agree that whatever deal the combatants strike (if any!) the MSM will herald it as the greatest thing since tranched bread.
If so, and if it gets the right spin, the market is bound to jump. That’s why we always, always use stops. Always. Stuff happens.
As regular readers know, however, I don’t think it’s going to happen. IMO, nothing has changed in the past two weeks since I posted:
…clearly we are slipping closer to the point where a budget deal can’t/won’t be done — assuming the dem’s were ever willing in the first place.
Given the current political climate, going over the cliff might be the only way possible to reduce spending and raise taxes. There are many in both parties who openly support the idea, and probably many more who secretly support it.
It makes sense. Politicians know we need to balance the budget. But, they also know their careers will be damaged if they vote for tax increases or spending cuts. Could be that all the negotiating back and forth is for show, so neither party can be blamed for the hit to the economy that a balanced budget will necessitate (or both will be blamed, depending on your POV.)
As I’ve posted ad nauseam, any deal means higher taxes, lower government spending, or (almost certainly) both. We can debate whether this might be good for the country’s economy in the long run. But, there’s no question that it will stymie growth in the here and now — at the very least.
Bottom line, I don’t believe there is a “good” outcome to this mess — regardless of what the talking heads report.
UPDATE: 3:55 PM
How about a close right at the neckline? Don’t be surprised. VIX is getting so very close to tagging that important 22.23 level. Five minutes left… where’s the Plunge Protection Team?
Sometimes — not often enough — Mr Market can be a little predictable…
Another 3.1% for the week since our 1447 short on the 18th. Not too shabby. If anyone’s interested, there are still a few of those Charter Memberships left. Click HERE.
I’ll post more later tonight. Have a great weekend everyone!


PW I’m looking at the Daily and 60 min.chart of the S&P and can’t
help but see a potential H&S forming. At about 1425-1430 would
form a nice right shoulder with about the same declining angle as
the neckline which was breached yesterday and appears to be where
the market is sitting right now. Any reason we shouldn’t expect this
right shoulder to form?
You and I were probably pushing our respective ENTER keys at about the same time. Check out the latest chart above – the 2:50 entry. I think this pattern should define the next leg down.
RSI – Pebble leads us to the essence of it. I am very busy right now. Skiing-day, and the kids crazy. In short what i wanted to post. – It was, on my search for harmonics i landed on his old blogspot, pebbles use of RSI that brought me home. RSI is much more than just an oscillator. Where the turns come in is very often – very telling. I use RSI since i got in touch with technical analysis. RSI is at least three-dimensional. And Pebble – a multiple of it.
PW Still can’t open your charts in a new tab to allow them to be
expanded and easier to read. My eyes aren’t as good as they once
where. Any suggestions?
In Chrome, right click the chart, look to the bottom of the right-click menu and use “Open image in new tab.” In Firefox, right click, then “View Image.” Hope the helps.
There is a similar function in Firefox and Safari as well. You may also choose “open image in new window” if you like to examine a chart whilst reading the notes that accompany it.
Please let me know if these solutions don’t work for some reason.
It used to work in IE as well PW, but over the last week or so, it hasn’t been working. Yes, I have IE9. Always opened in the past in a new tab, but just not recently. Not sure what changed, and it sounds like some of us may need to change our web browser to get full benefit from the site. Without the charts, it is difficult to plan the next move.
I wish I knew what might have changed. I’ve not updated anything on WordPress or related plugins. Did you upgrade to IE10, by any chance? I see it recently came out — maybe not fully compatible with WordPress.
WP has some new releases that might be better fits, but I don’t want to switch until all the kinks are worked out. Maybe use Firefox in the meantime? It’s gratis and virtually problem-free — not to mention more private than MS IE. I am also able to use Chrome and Safari w/o any problems.
I’ve experienced the same issues with IE 9 over the past week or so as well. Have since switched to Firefox, but when using Firefox, you have to right click and select “view image” (as opposed to “open link in new tab”) to obtain the same chart view I used to get by simply clicking on the image in IE.
Thank you B_J