

In our last formal update on gold in January [see: Jan 2 Update on Gold] with GC trading at 1529, I noted that although DXY had held up well, gold should benefit from loose Fed policy – but could see a backtest of its SMA200 based on the oil/gas meltdown we expected.
I am partial, though, to the Fed putting the damper on inflation in January (reported in Feb) and setting up a backtest of the SMA200 or even the neckline which would set up another leg up to 1710-1735 in Oct 2021 or Jan 2022. Note that this would tie in nicely with the idea of an oil/gas meltdown in 2023.

We certainly got all those things, but the timing was just a tad off.
Long time members will remember I’ve been writing about gold’s potential Inverted Head & Shoulders Pattern for years. This post from September 2017 comes to mind.
As I stated in that last update, I think TPTB will do whatever it takes to keep that giant IH&S targeting 1721 from playing out. The only thing I can see outweighing their efforts would be a true black swan event such as open warfare on the Korean Peninsula.
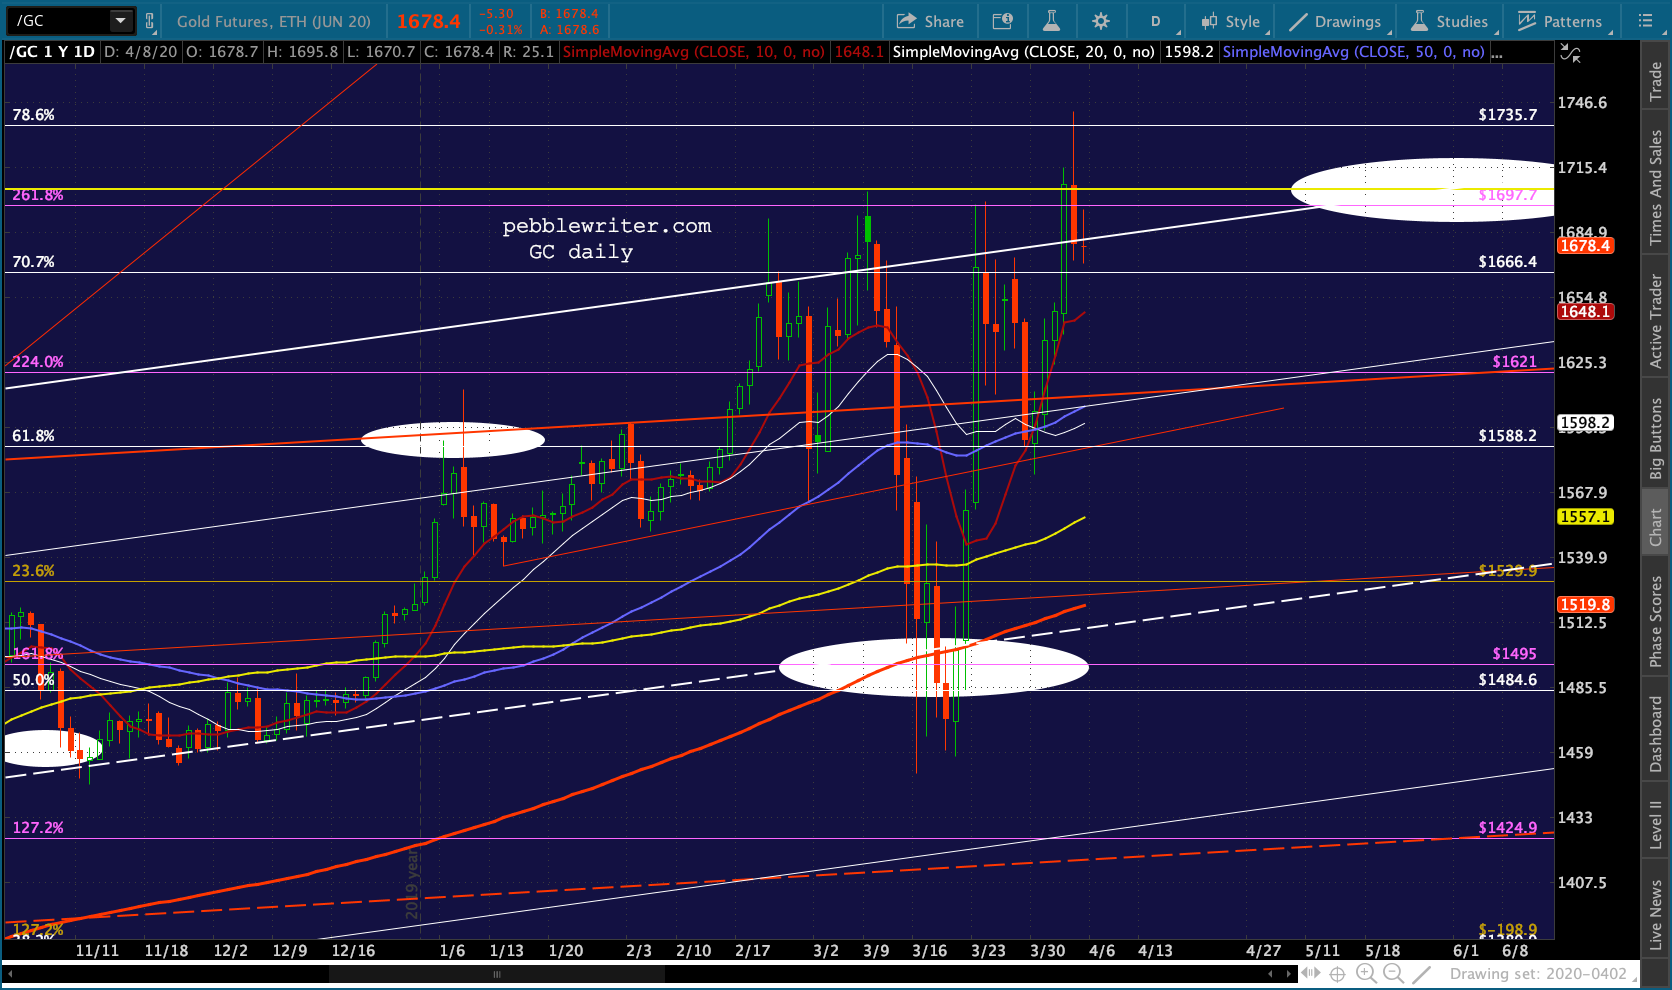
Sure enough, every time GC got close to that neckline (the dashed yellow line above), it was smacked down by as much as 18%. It has happened 9 times since July 2016. It was nice for trading purposes, but frustrating to the many gold bugs out there.
While rising oil and gas prices were helpful to Aramco’s share offering in 2019, they disrupted the delicate balance between inflation and interest rates and sent a clear signal that it was finally time for GC to break out — which it finally did last June.
Since then, it’s been a matter of waiting for the rising price channel to reach our upside targets. It might have been a long wait if not for the coronavirus. We managed to avoid war with North Korea, but this smaller, deadlier enemy was plenty Black Swan enough for the Fed.
 A few trillion in QE later, GC has reached our 1735 target — well ahead of schedule and after a very dramatic SMA200 backtest.
Is the run over, or is there more to come?
continued for members…
While the .786 is a very legit target and arrived months ahead of schedule, the .886 is just as legit. But, the white channel top doesn’t reach 1823.60 until January 2021.
 As before, much will depend on the US dollar’s strength – shown below in in the form of DXY. Like GC, it has to decide between two pretty good looking channels – the sharply rising purple one from 2011 or the less aggressive white one from 2003.
 From a philosophical standpoint, the current economy has much more to do with the post-2011 period than the post-2003 one – what with QE having blossomed in the past 12 years.
DXY already reached its red .886 two weeks ago, a sharp rise as stocks were melting down. But, this left it short of the obvious channel targets – the midline of the purple channel and top of the white channel. The rally was made possible by the euro’s and yen’s sudden plunge in value as stocks were reaching peak puke on Mar 23. The interesting thing about that move for both currency pairs, however, was that they didn’t go as far as they might have.
EURUSD came up short of our .886 target at 1.0592… …and USDJPY never managed to really break out – only produce a deep retrace. It was back below its channel top and SMA200 a few days later.
 Although I could make a great argument for more downside for both, it kind of depends on what TPTB have in mind for stocks. If they are determined to call off the crash and keep ramping things higher, USDJPY is almost certain to play a role with an actual breakout – which will obviously boost DXY and potentially take a bite out of GC.
If a lower low, say SPX 2138, is in store, then I can easily imagine USDJPY popping down to test the white channel bottom at 99ish.
EURUSD has had a much weaker correlation with stocks. Though the eurozone is arguably economically weaker than the US, it seems to be way ahead in terms of COVID-19. Many EZ countries have clearly turned the corner and could be back to normal, whatever that might end up being, before the US.
Maybe this will result in the euro showing some strength – hard to say. There’s a lot of dust in the air and we won’t really know until it all settles. But, the EURUSD has failed to push above its SMA200 quite often over the past year. It seems to me that it’s hinting at a drop to the .886 at 1.0592 for a next leg anywhere.
Even without a USDJPY rally, this could get DXY up to 103.82, which would theoretically produce a dip in GC. It could retest the SMA200, which is now slightly higher than the white channel midline at 1520. That’s a long-winded way of saying we’ll probably have to wait a while for GC to reach 1823.60.
Sure, it has pushed above the white channel top many times since Feb 24. But, it has always dropped back below within a day or two.
The fly in the ointment is that GC and DXY sometimes move in tandem as we saw between Dec 31, 2019 and Feb 2, 2020 (as both moved higher) and again from Feb 24 to Mar 2, 2020 (when both were dropping fast.)
GC shed 15% between Mar 9-16 as liquidity dried up and folks needed to sell something in order to meet margin calls. Since Mar 16, both have generally been rising as the Fed’s extreme actions boosted confidence in the economy’s survival and sent loose money inflationary fears through the roof. I don’t expect those fears will taper much anytime soon. Whether the Fed can continue to boost confidence or not is another matter.
If I had to guess, I’d say gold is fundamentally more suited to a rally. A rise favoring DXY would more likely be the result of additional central bank interference, though it will probably be quite some time before massive stimulus outweighs the economic damage wrought by the shutdown from an inflation standpoint.
Though, if Trump gets his way, oil and gas will spike higher when Russia and Saudi Arabia kiss and make up in Vienna tomorrow. It would do a number on inflation expectations, but wouldn’t change the fact that the Fed is pumping trillions of dollars into the markets.
Bottom line, while GC has good potential to reach 1835, I’d take profits either here or, for gamblers, on any weakness as evidence by a drop through the stop level of your choice (the channel top is around 1675.)
 Though, if it strengthens on a breakdown in DXY, hang on with tight stops.
BTW, I would be derelict in my duty if I didn’t at least mention the many articles which have been written lately about physical gold being in very short supply. I haven’t researched it myself, but I don’t doubt it. This has reportedly produced a large price differential between physical gold and ETFs/futures. These things come and go, but assuming the reports are true this could obviously support the bullish case in gold.
GLTA.