

 It was just last Tuesday we asked “where’s the bounce?” SPX had gapped lower and failed to rebound the way it
 always seems to has for the past year.
We had watched a trend line dating back to Dec 29 (below, in red) break down, and were wondering about the small, white channel. From Where’s the Bounce?
After that, it gets a little messy. ES has an important backtest at 2773, which would be 2730 on SPX — nothing all that important in the vicinity. Below that, however, the white 2.24 at 2703.62 remains very interesting. It would be a hell of a drop from here: 117 points or 4.1%.

The closer we got to 2703, the more plausible it seemed. When we reached it today, though, SPX leveled off for only about 10 minutes before plunging lower. Why?
There are two primary reasons. The first, of course, is VIX. Was there a single session this past year when I didn’t bitch about the degree to which timely beatdowns in VIX were triggering algos to bid up stocks? Doubtful.
After VIX broke out of the falling channel on Friday, Our charts suggested it would reach 16.29 and, if/when that broke, 25.65. 
When 25.65 broke, at approximately 11:48 this morning, it triggered an additional wave of selling from those very same algos which have learned so well to take their clues from VIX’s every twitch. Live by the sword…
The second reason was USDJPY and the ubiquitous yen carry trade. As we noted in our last update [see: Jan 24 Update on USDJPY], the pair reached a channel bottom which represented important support.
We’ve reached the bottom of the rising white channel which has held on four previous occasions since its origin in late 2012…Bottom line, USDJPY isn’t necessarily done until DXY is done. We had bounces at the .500 and .618, so an overshoot to the .786 at 108.90 or even the .886 at 108.16 is a distinct possibility.

As it so happens, the white channel bottom didn’t hold. Despite Kuroda’s desperate jawboning, USDJPY has continued to falter. It backtested trend line resistance yesterday — all well and good.
But, instead of catching support as it almost always does, it broke down. At 11:56, it dropped through a tiny trend line of support. Seconds later, when that TL broke down… …it broke down through a larger TL of support.
 Bottom line, VIX and USDJPY are the two most powerful drivers of algos there are (oil occasionally takes the lead.) When they were going strong…melt up. The slightest hint that they’re not…melt down.
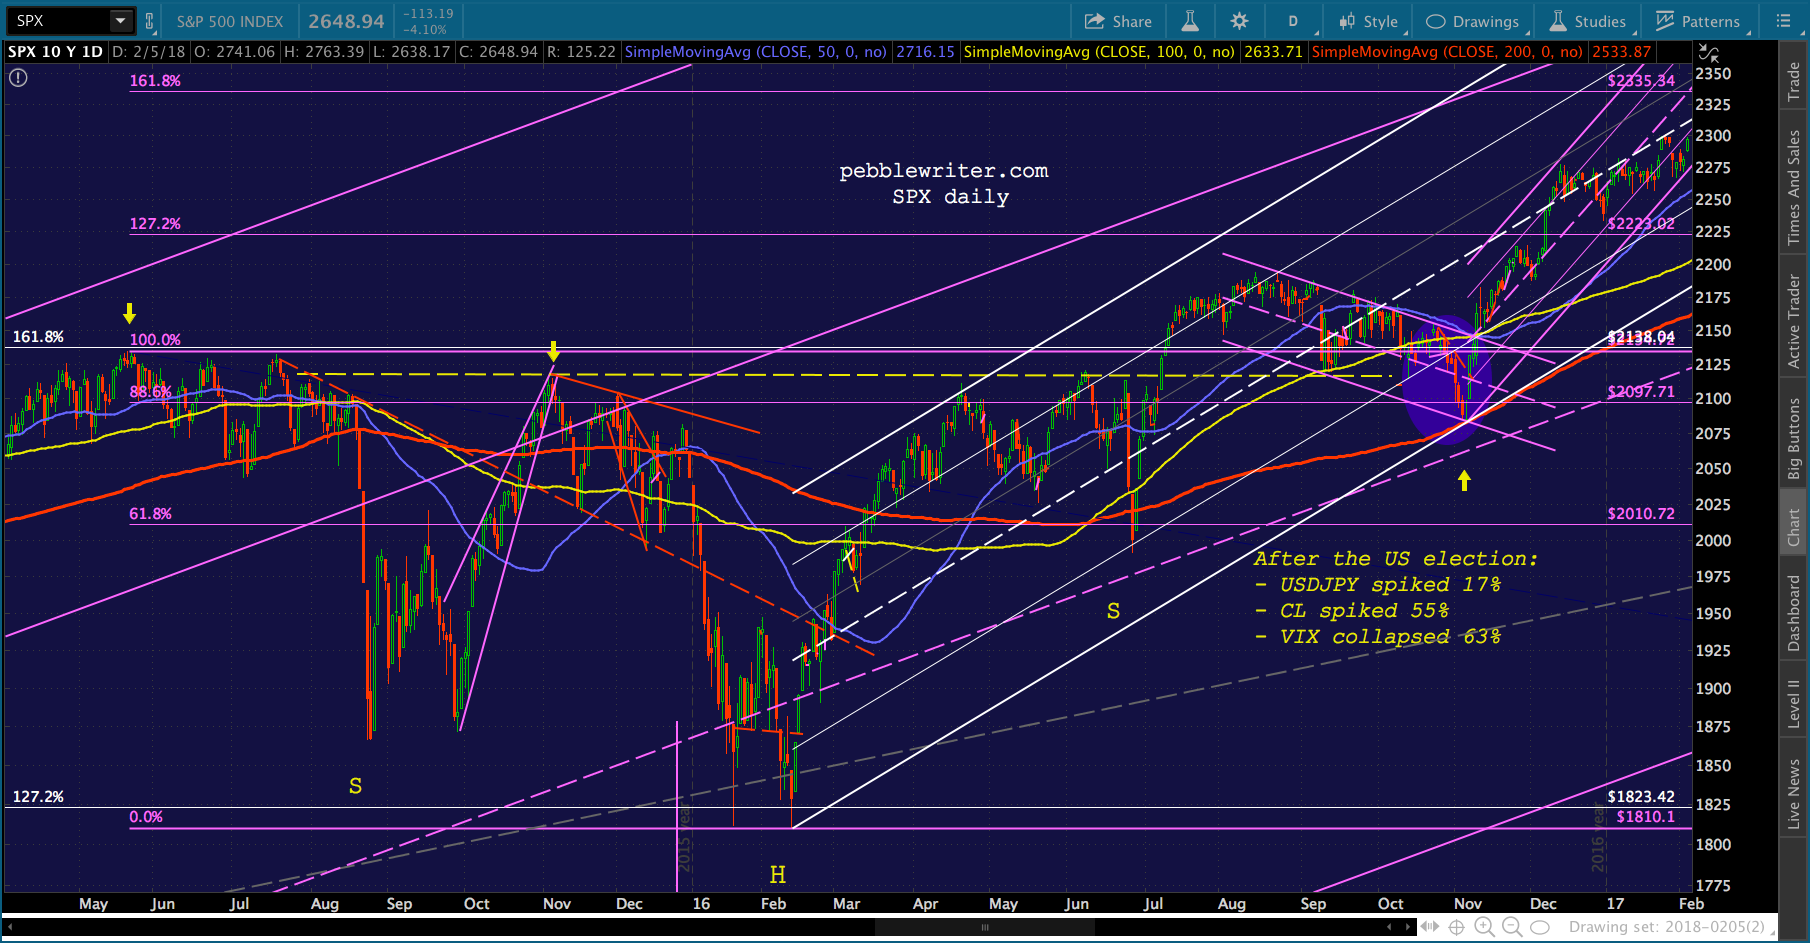
SPX bottomed out yesterday at 2638.17 and closed a good 55 points below the 2.24 Fib. While it’s always scary to see major Fibonacci support fail, there was an obvious effort to keep the uptrend alive. Note the SMA100 crosses the bottom of the rising channel which was established with the Feb 11, 2016 lows. In other words, it’s important.
Significantly, the channel bottom was defined by the Nov 9, 2016 lows. If that date sounds familiar, it was the election night in the US. And, it was the last time a major effort was made to salvage important Fibonacci support. [see: Why the Trump Rally Is a Fraud.]
It worked spectacularly, resulting in a 38% rally. All it took was a 17% spike in USDJPY, a 55% rally in oil, and a 63% collapse in VIX.
How about now? The algos are primed and conditioned to respond. I’m sure Jim Bullard still knows his way to Bloomberg’s studios. Can TPTB manufacture another recovery? For the answer, we need only to examine two similar, previous meltdowns: the night of the US election in Nov 2016, and August 16, 2007.
continued for members…
I come back to that Nov 2016 rebound because I think it’s very similar to today’s situation. A major Fib broken, VIX spiking above its SMA200, panic in the streets. That night, it lasted only a few hours.
 SPX had recently broken back below the neckline of a large IH&S Pattern. It dropped to its SMA200 where it suddenly rebounded. At the bottom of its dip, it reached 2083.79, 2.53% below the 1.618 Fib at 2138.04.
Today, SPX reached 2638.17, 2.42% below the 2.24 Fib at 2703.62. Throw in the fact that it’s nudging up against the SMA100 and the white channel bottom, and I think there’s an excellent chance it rebounds from 2633ish.
Now, it’s entirely possible we could get a little more follow-through tomorrow. As we discussed earlier, the drop through 2703 also put SPX below the purple channel’s .786 line. If it doesn’t rebound from here, it is likely to test the SMA200 (currently at 2533.87) or the purple channel midline (currently around 2385.)
Note also that ES’s candle the day/night of the election was 138 points — about 6.4% of that morning’s open. ES’ candle on the 5th was 167 points, about 6.1% — not all that far off. And, just the fact that ES reached its SMA200 should be enough to offer more than a little encouragement.
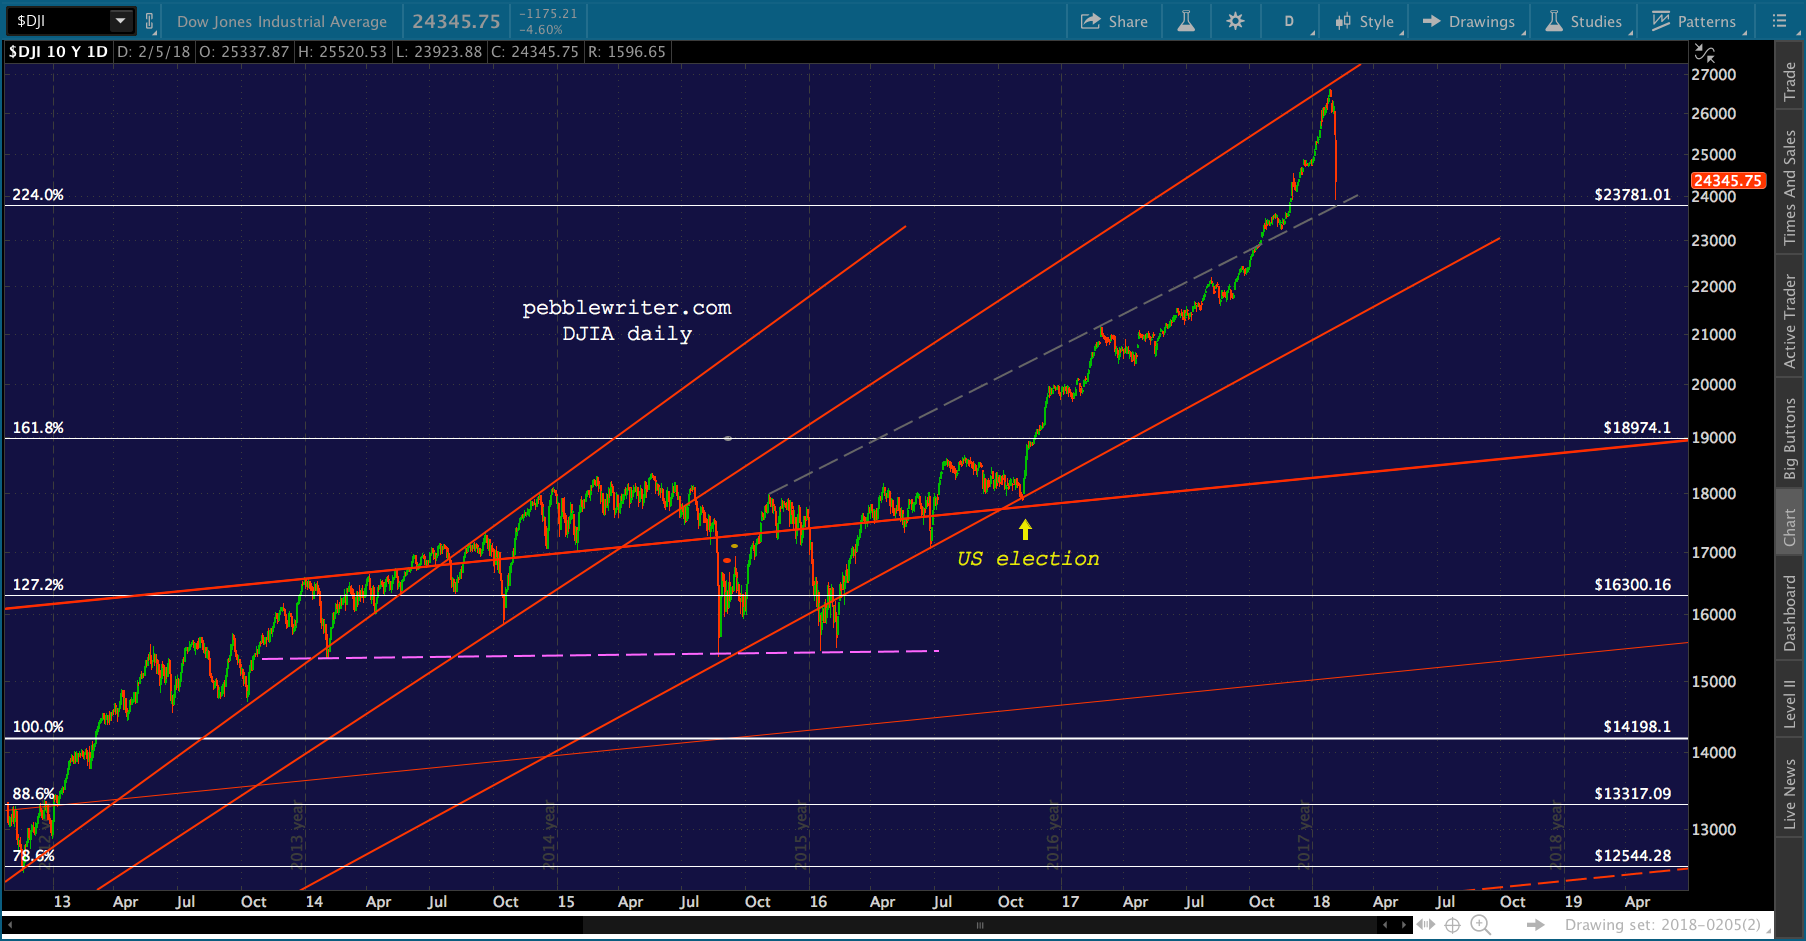
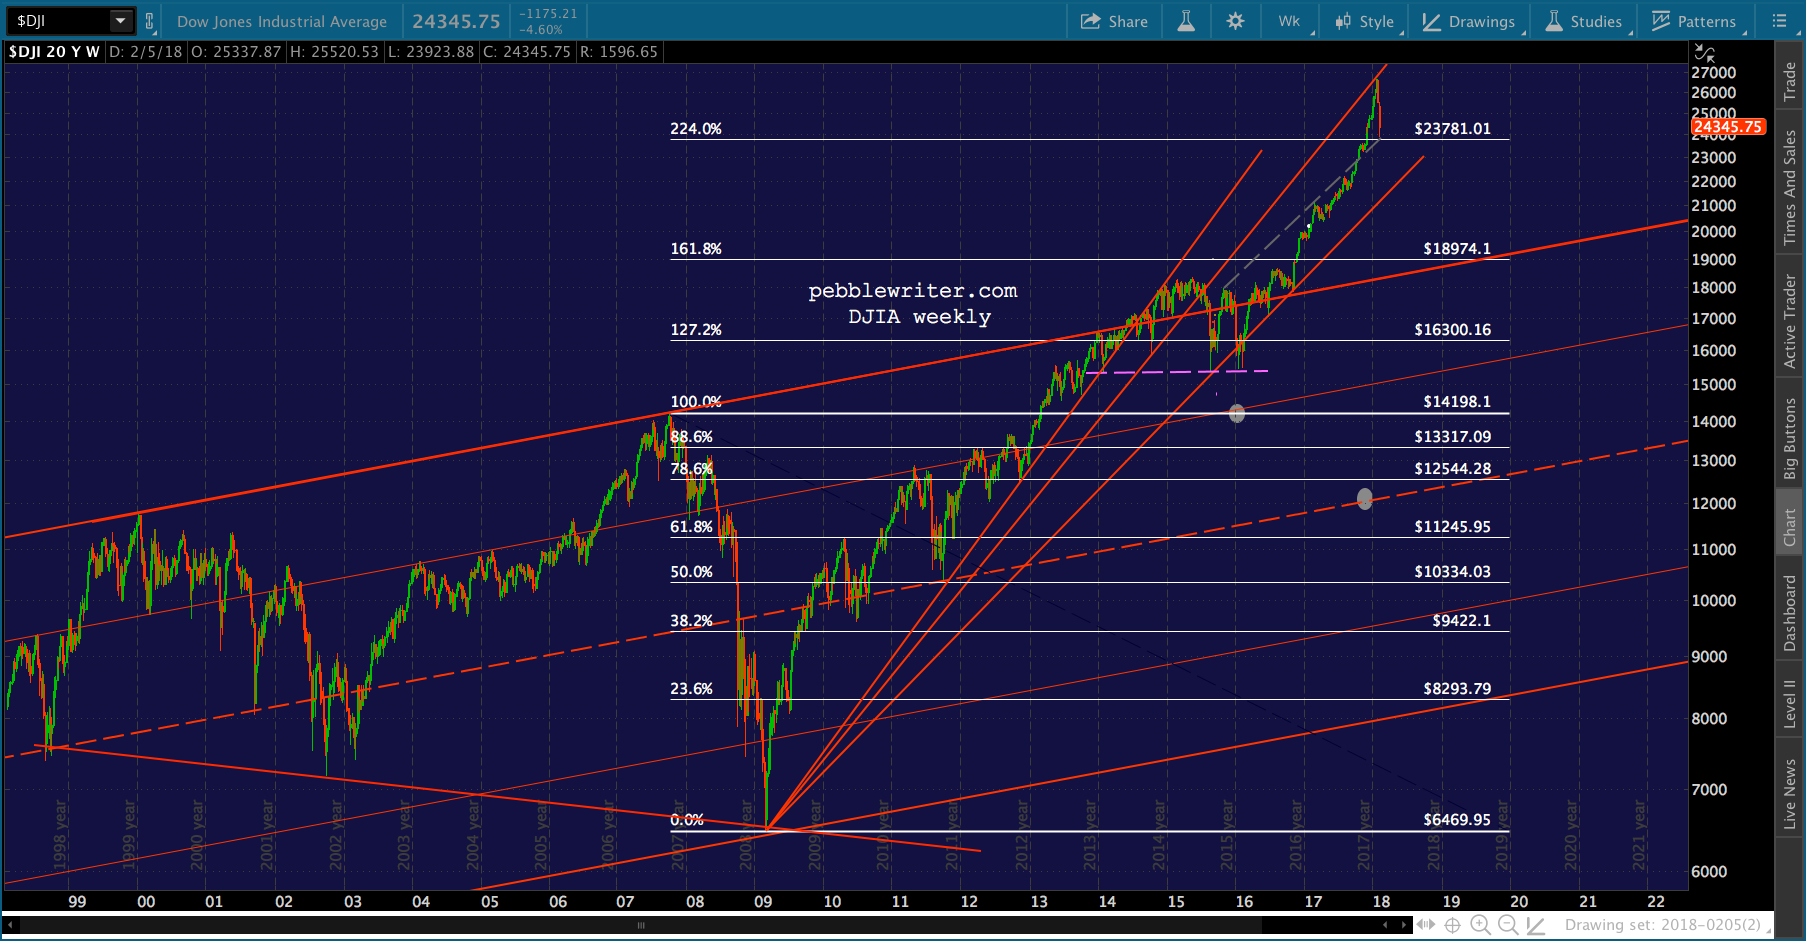
Last, I don’t like to chart DJIA, as it’s usually a total joke in terms of charting integrity. But, the old gal is also suggesting a rebound from this general area. It reached its SMA100 and came within a handful of points of its 2.24 Fib extension.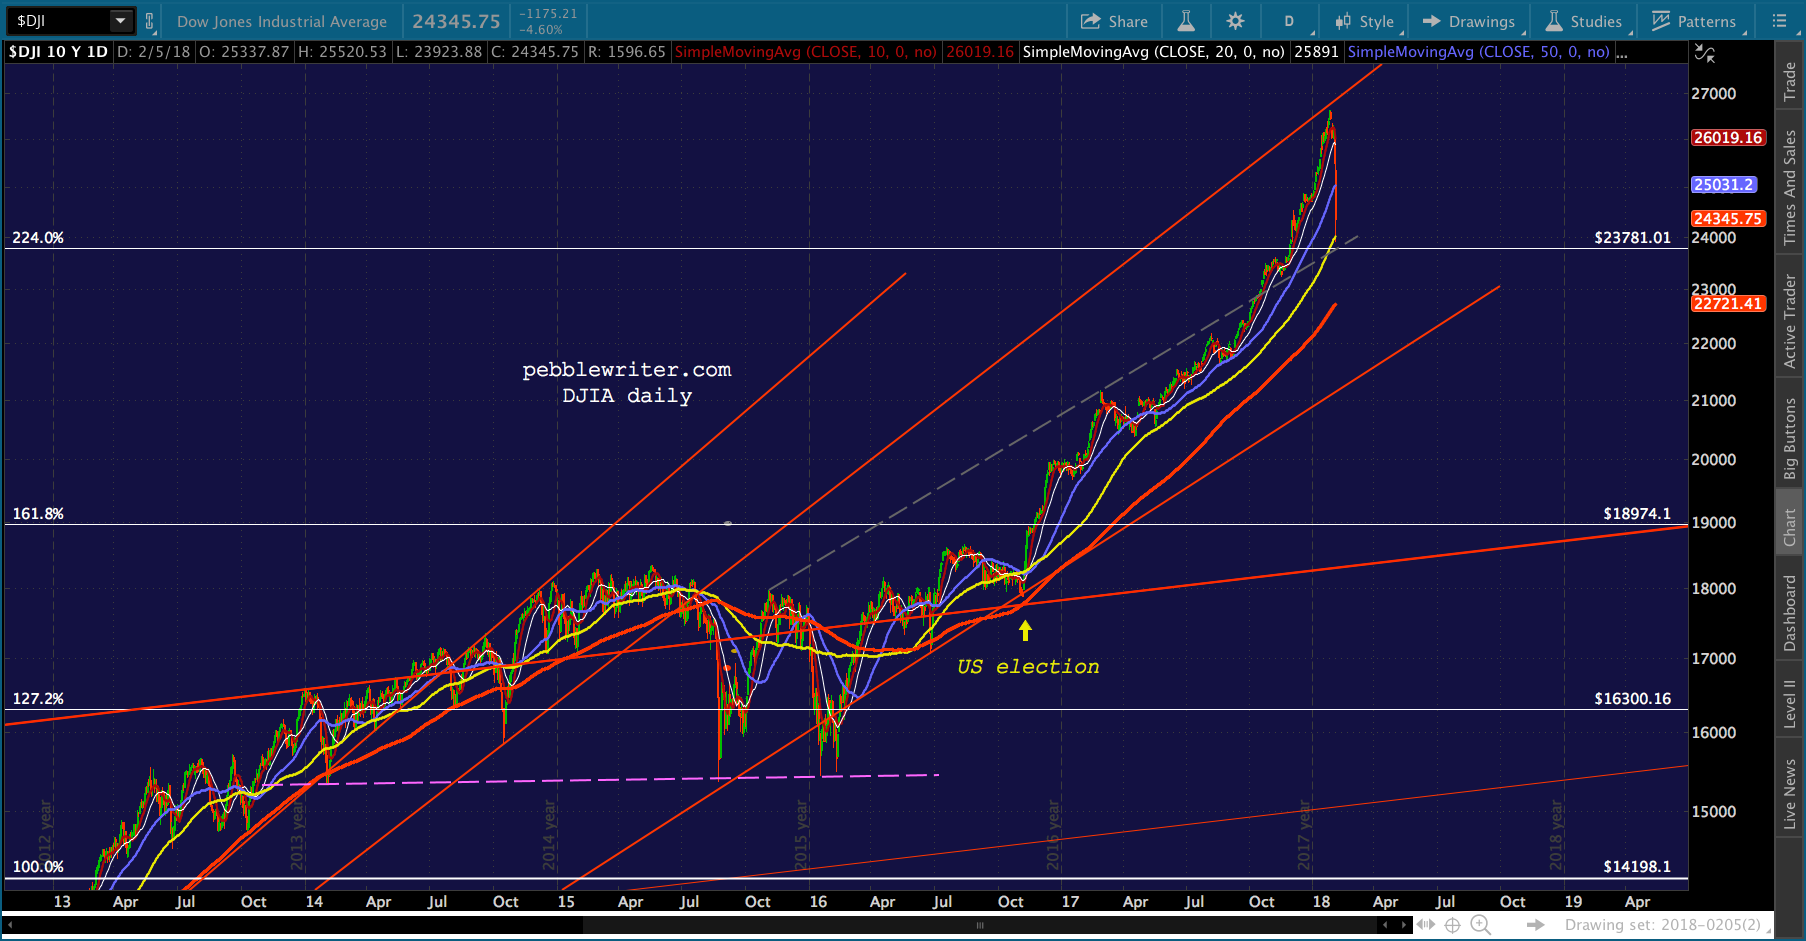
 UPDATE: 9:15 AM
Since tagging its SMA200 at 2533, ES has rallied as high as 2644 and is sitting now at 2605 — a 4-pt drop from yesterday’s close. They should try for 2645ish if they’re going to rescue this. But, it’s anyone’s guess, as the swings are still coming big and fast.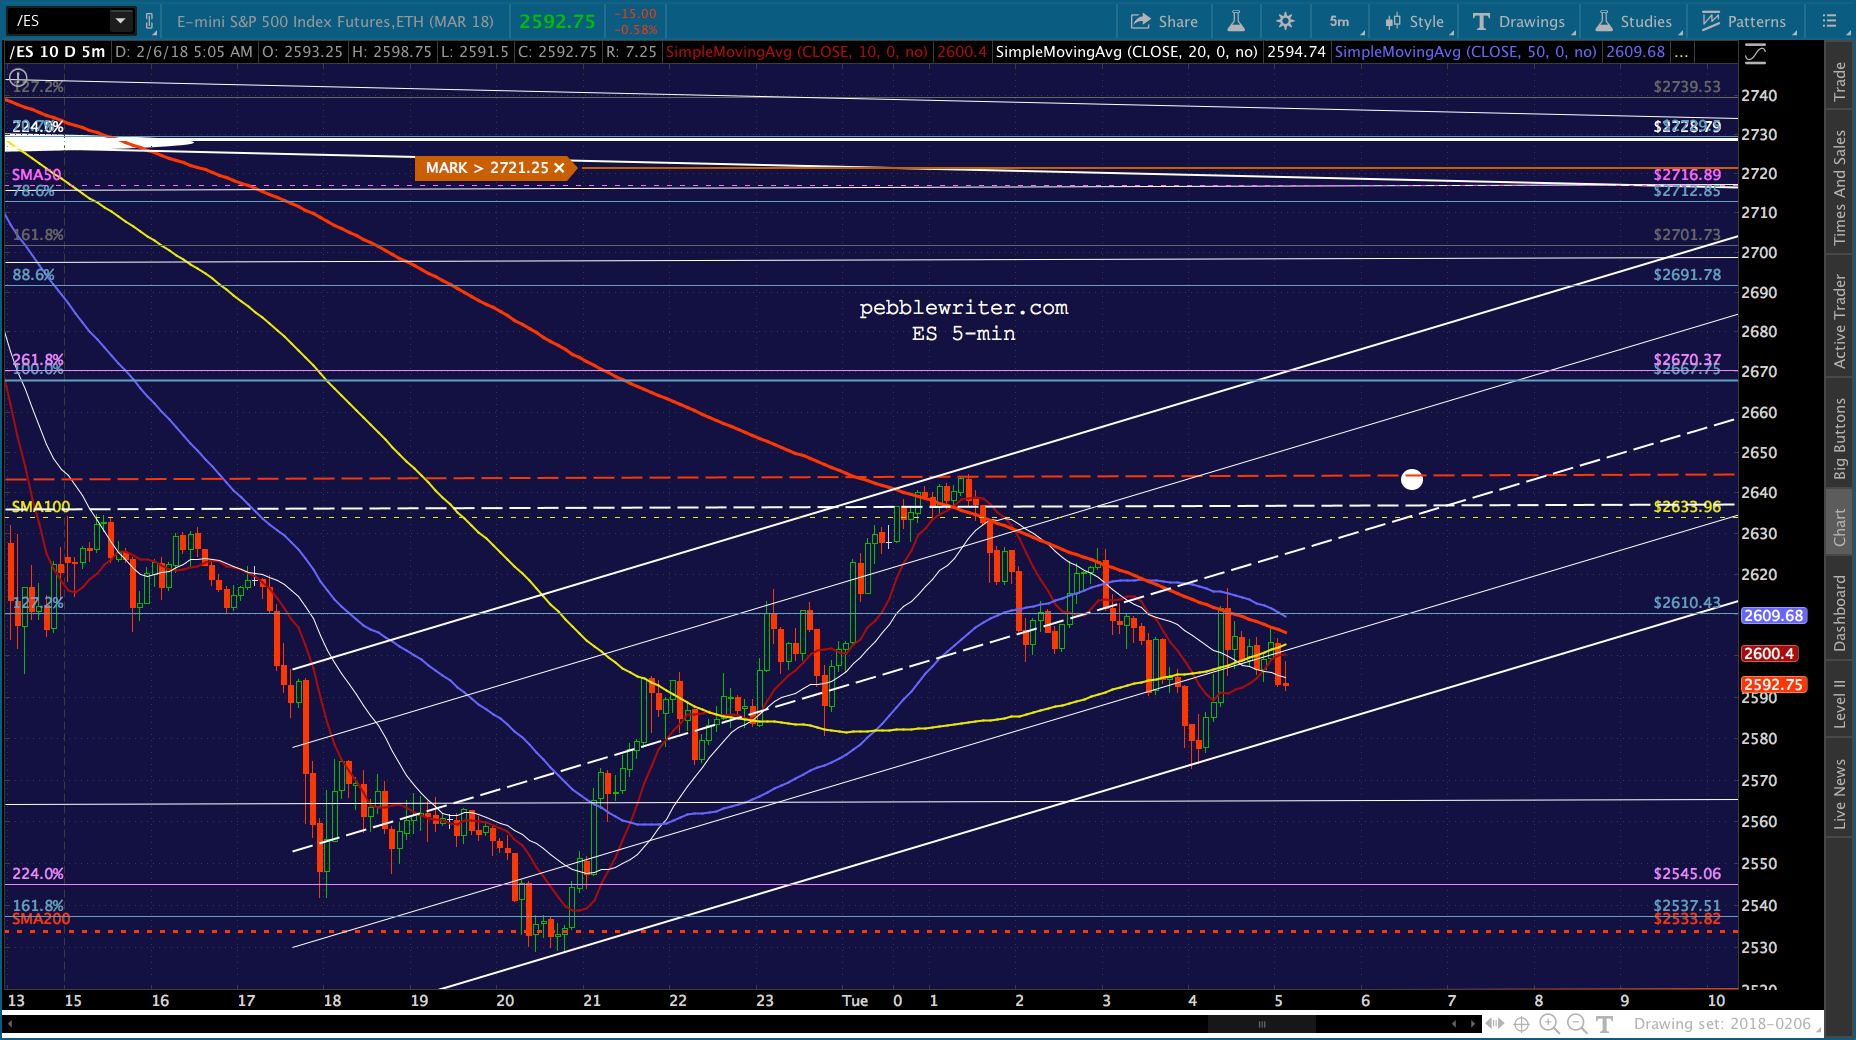 The critical issue is VIX, which is obviously very broken. If TPTB can somehow get it back below 43.72, everything should be fine. Here’s why.
At 43.72, it’s no longer headed for the moon, but back into the falling white channel shown below. It could push a little higher intraday, but it’s a solid short here.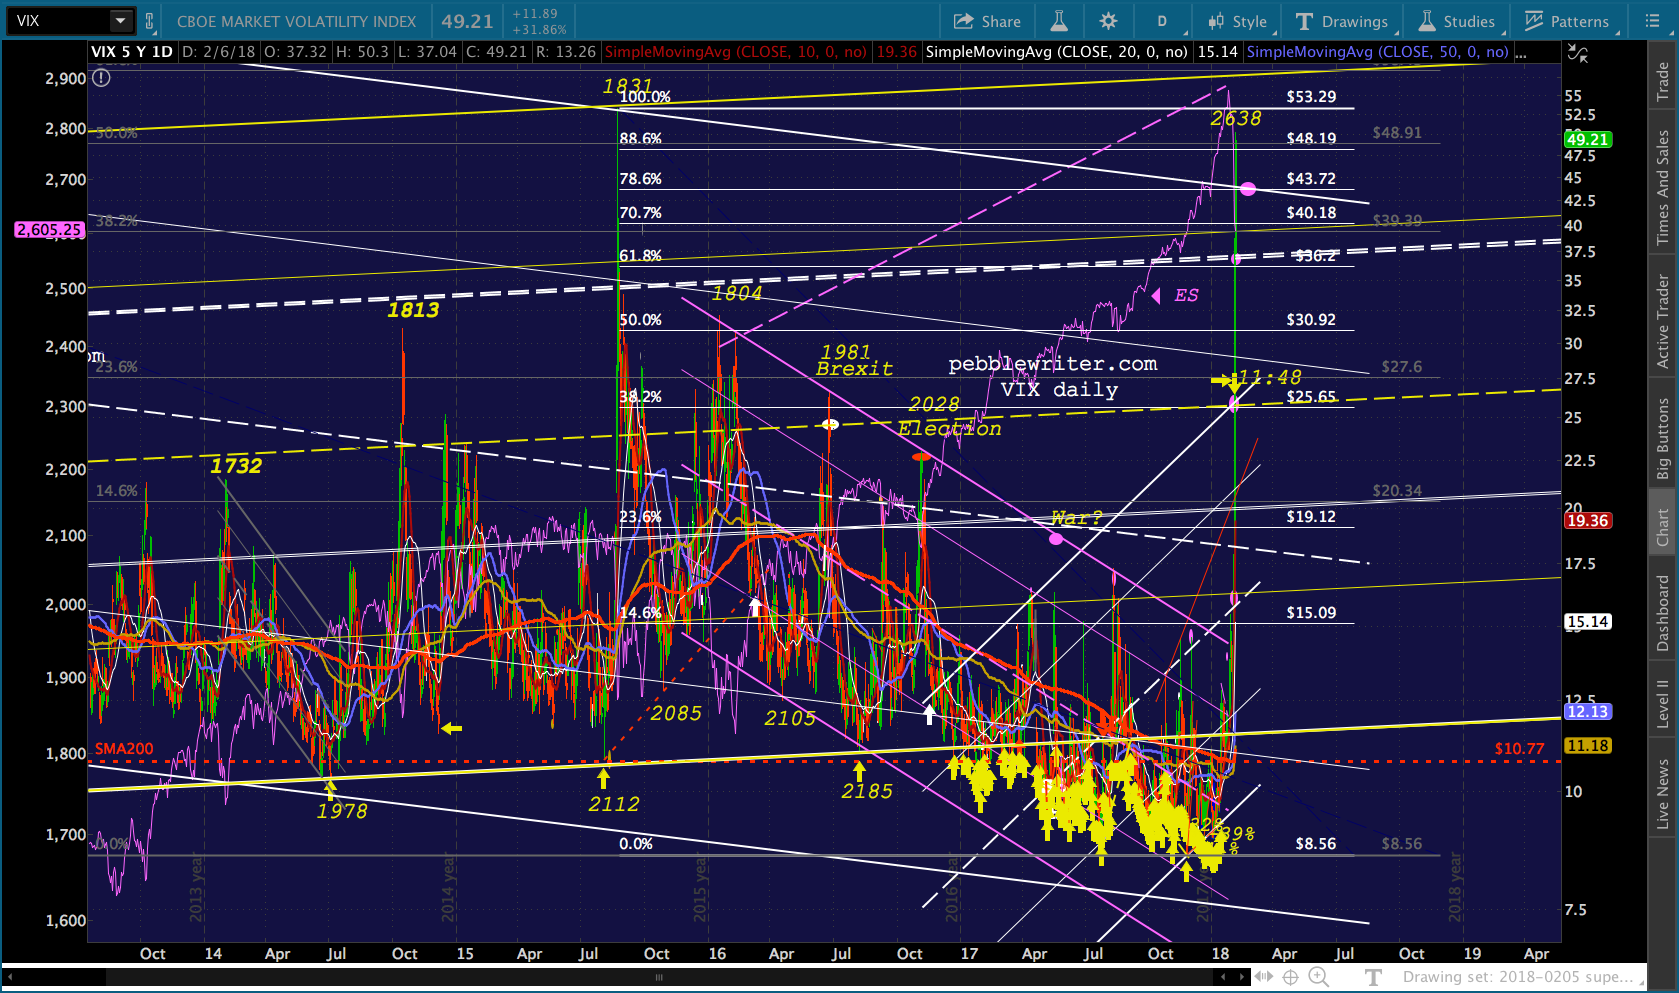
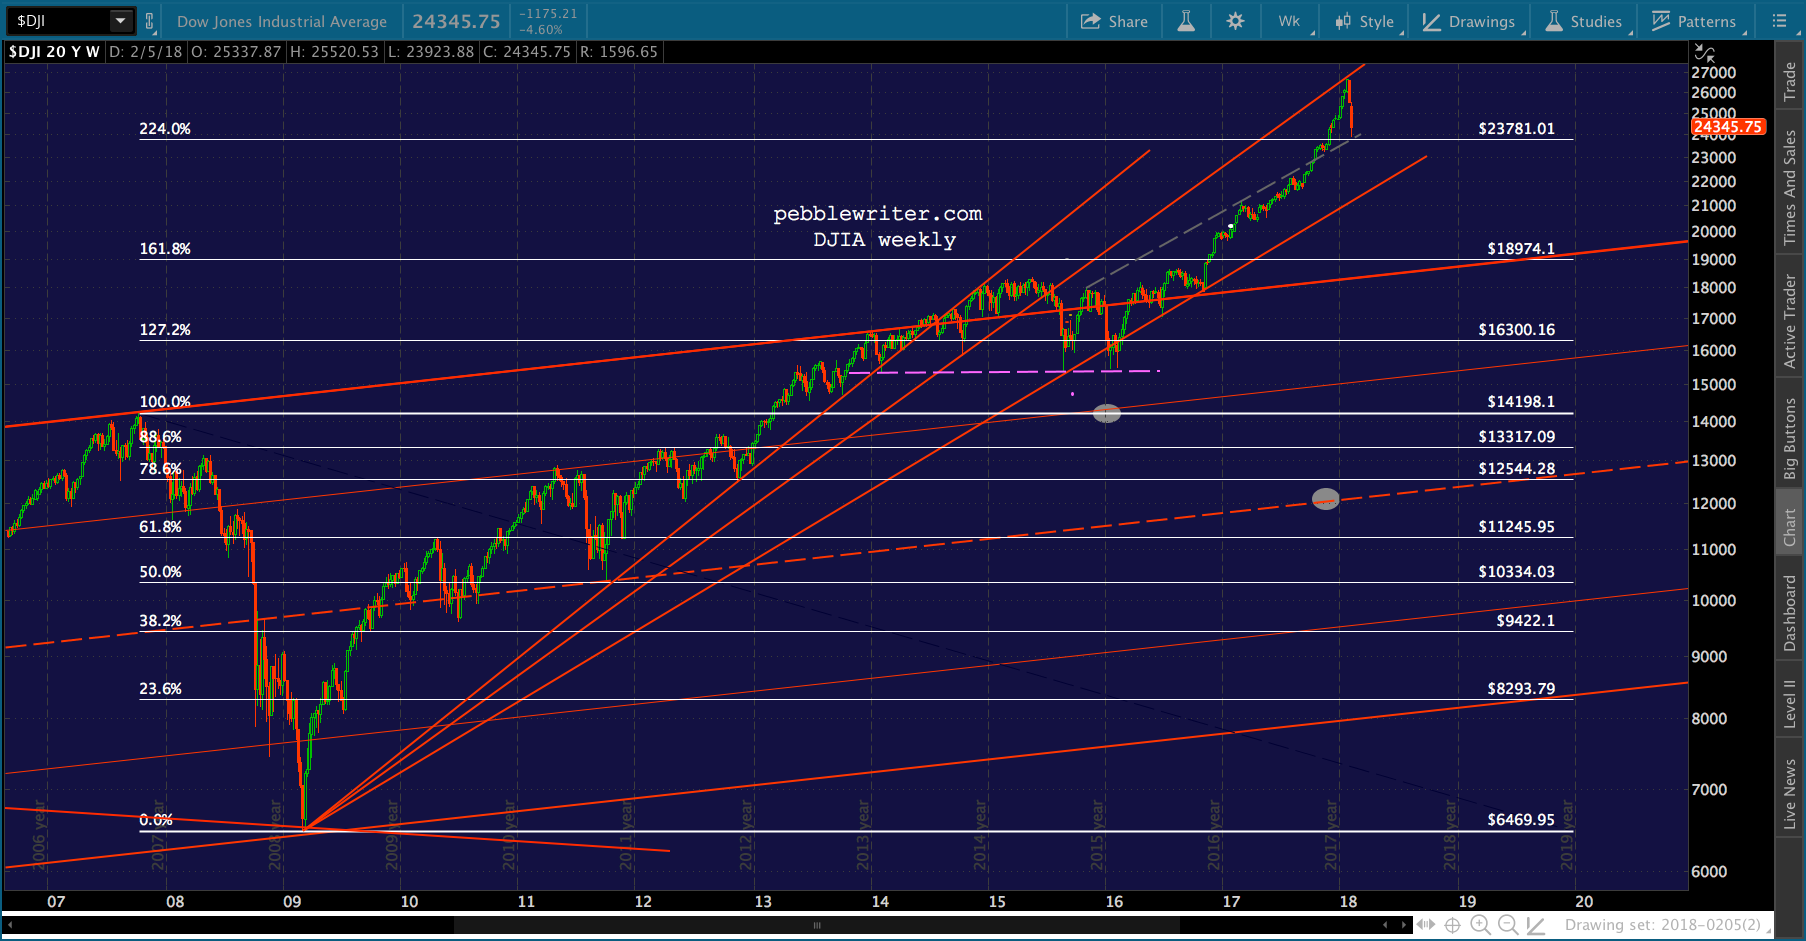
As the weekly chart shows, we’ve been here before — on Aug 16, 2007 to be precise. 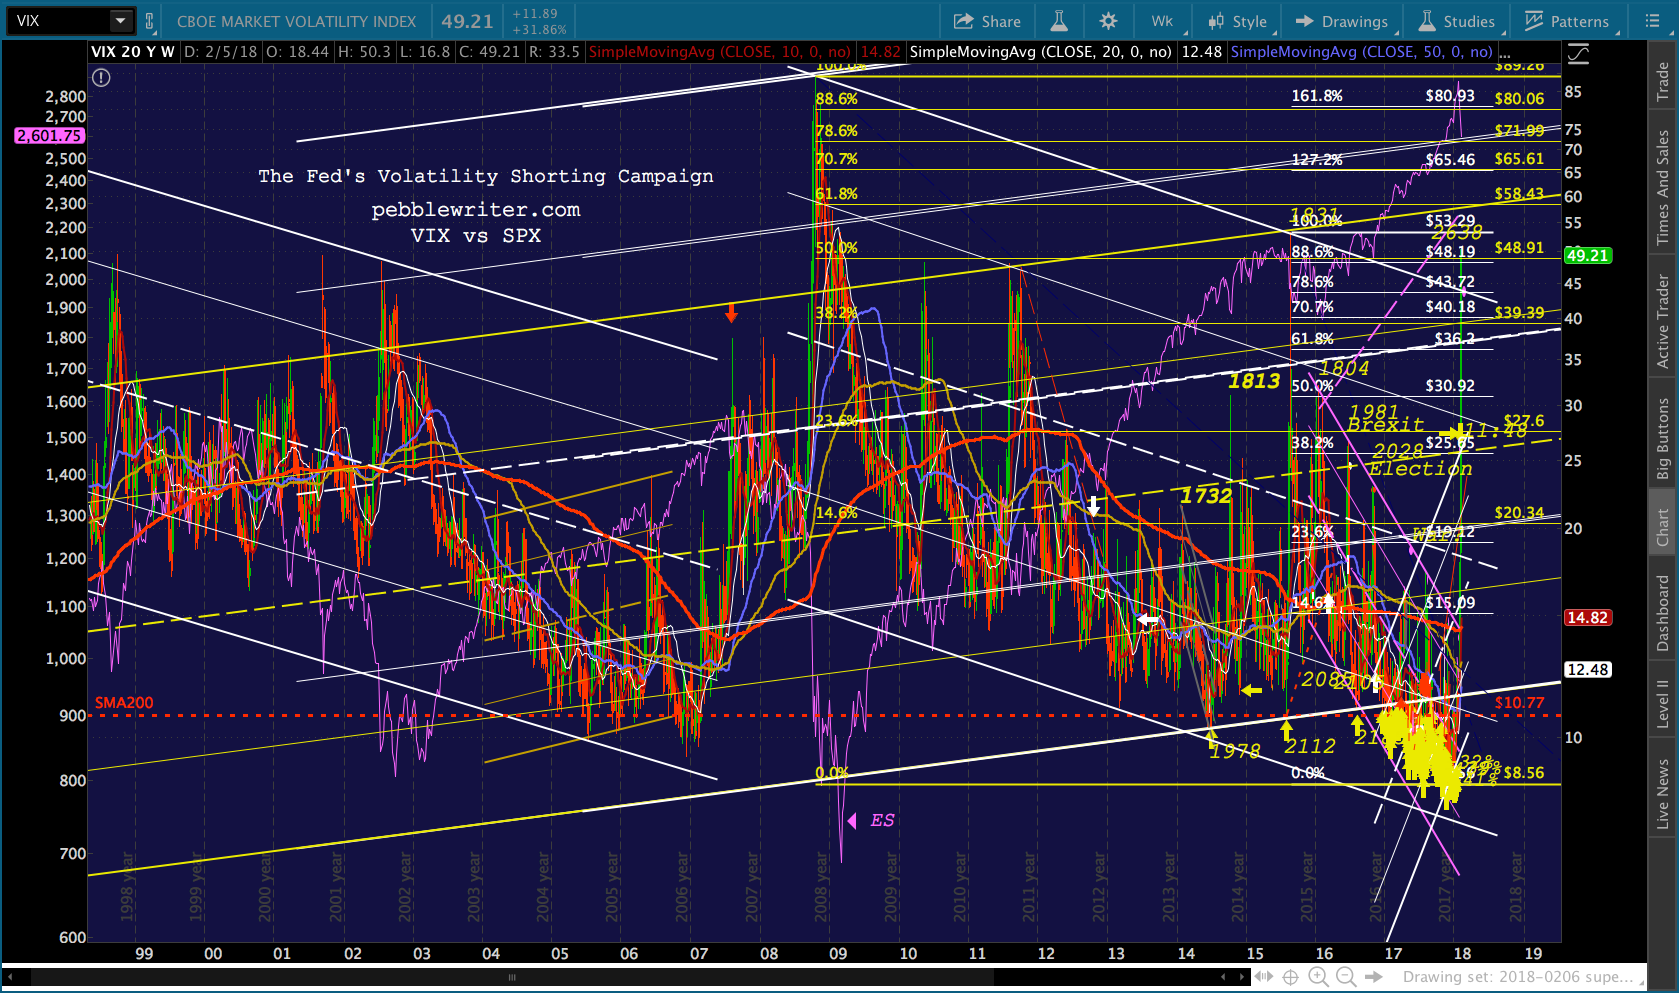 Here’s a close-up, showing VIX breaking out of the channel. Obviously, it was an intraday head fake.
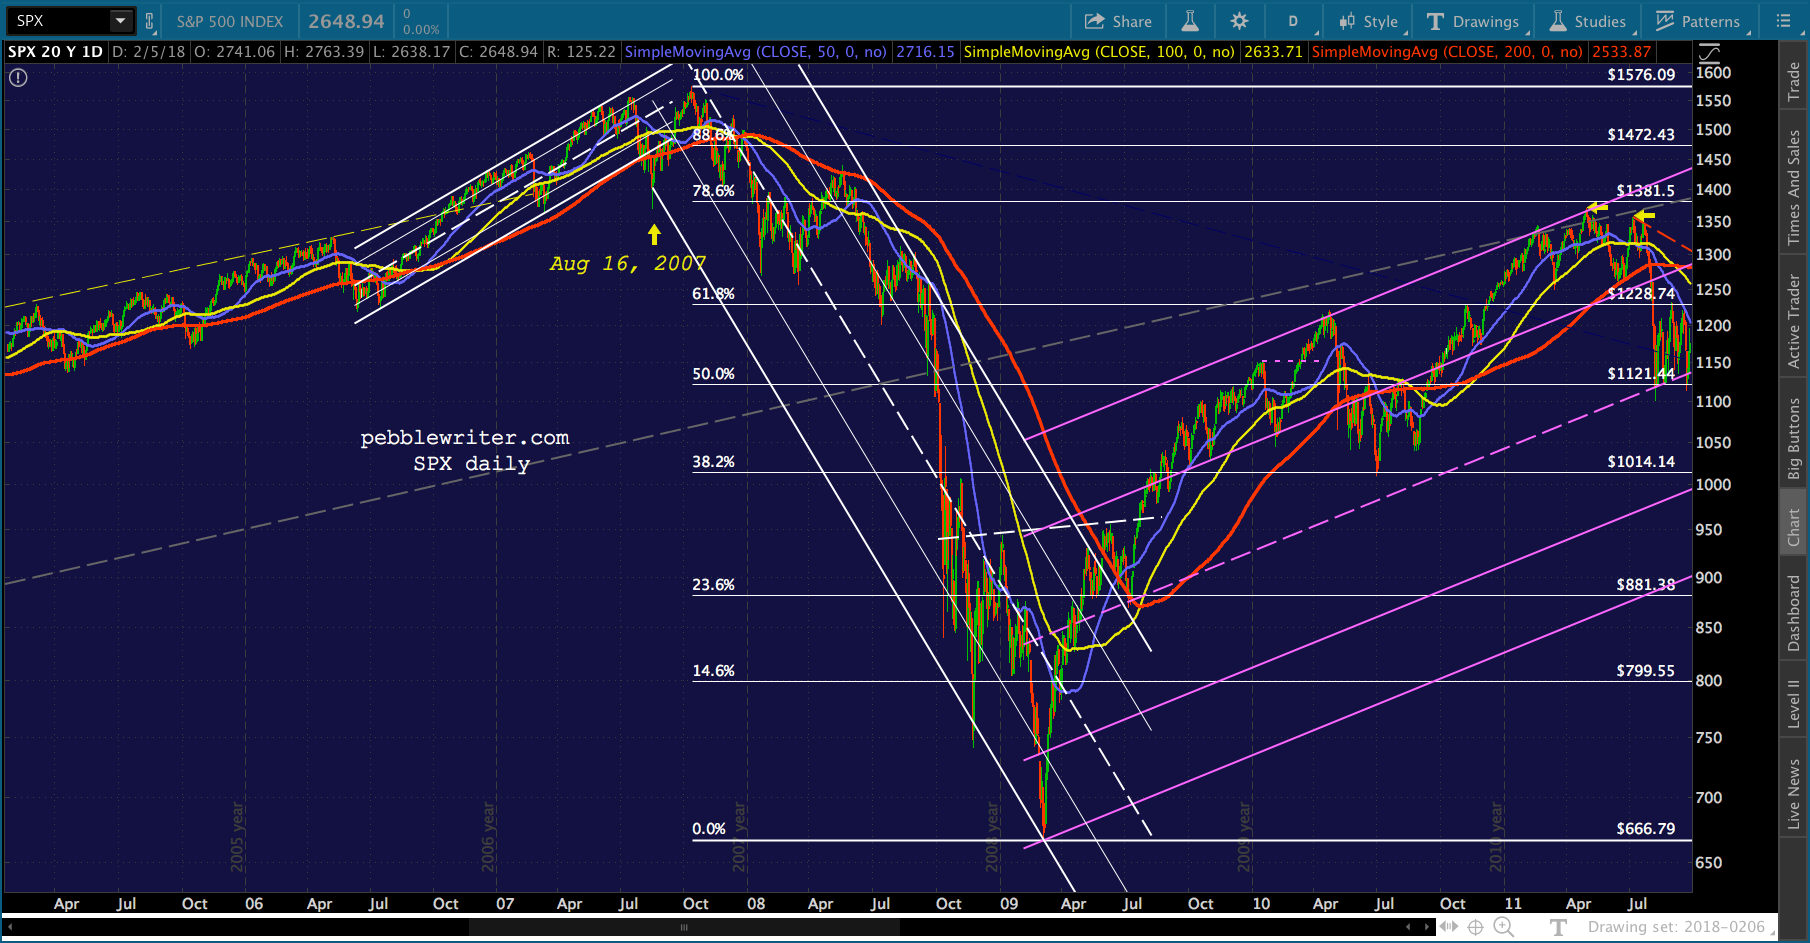
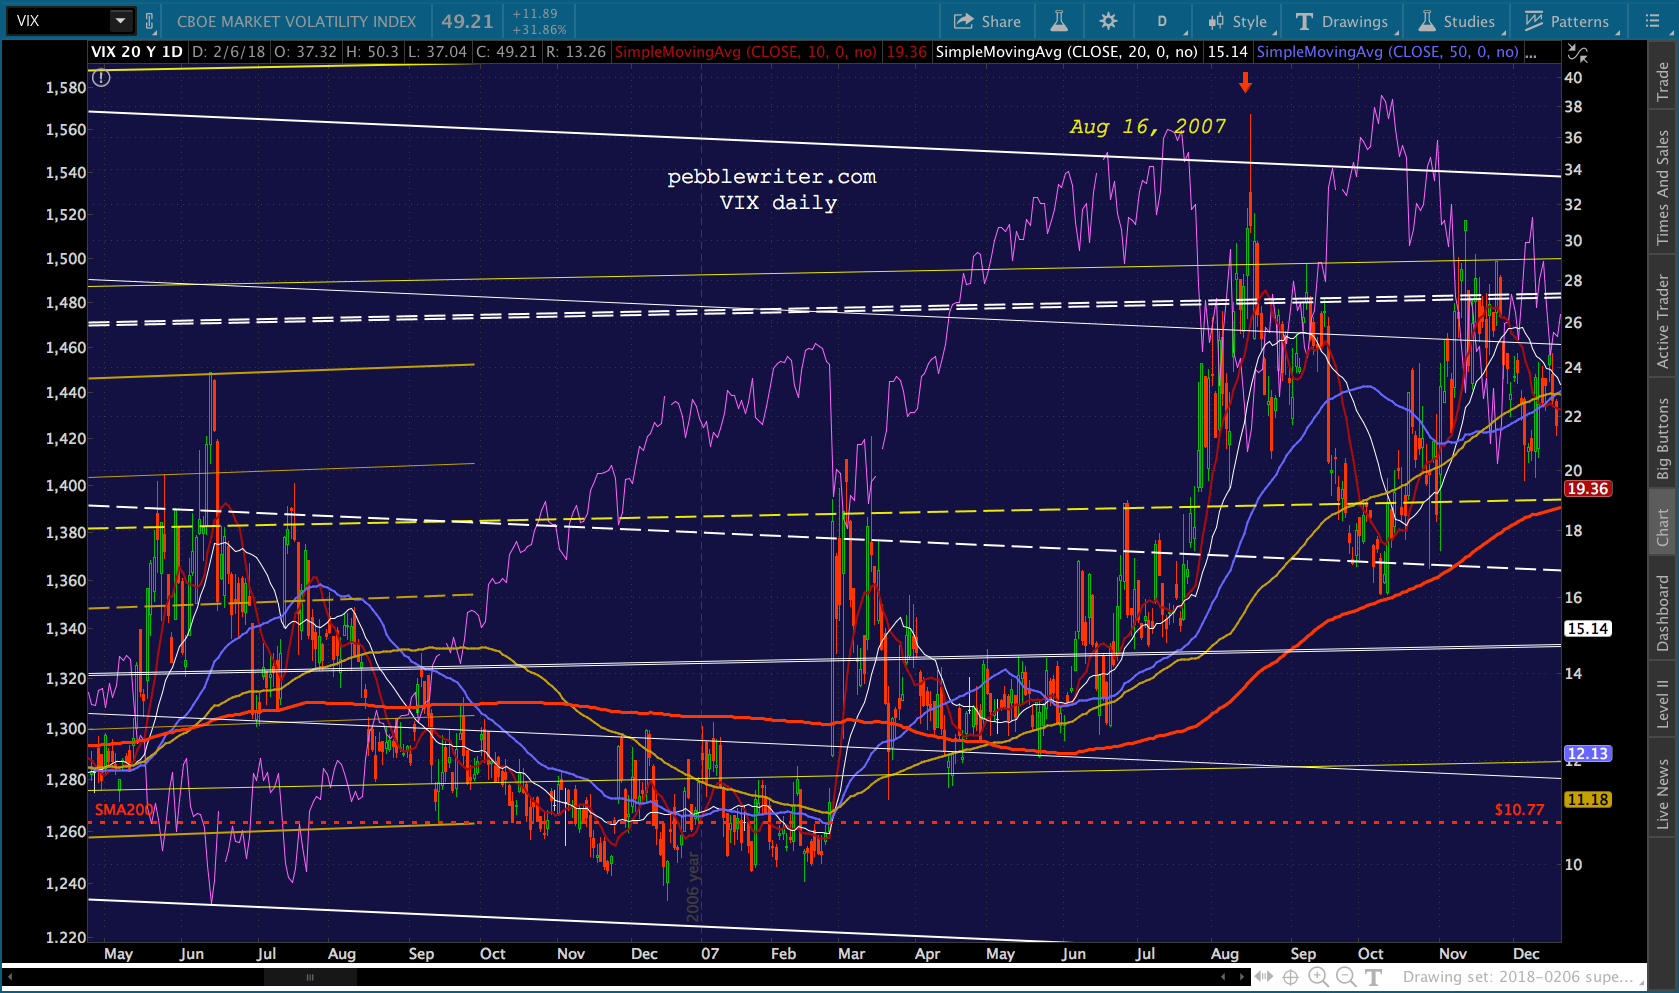 Here’s SPX during that same period. It had dropped 185 points, about 11.9%, from its recent highs (which barely eclipsed the 2000 highs.) It had dropped through the SMA200. It had broken down from a nice, rising channel not unlike the one SPX has been in lately. Yet, VIX collapsed back below its channel top and SPX went on to make new highs — climbing 15% by Oct 11.
 If I were working the books for the Fed, that’s exactly what I’d do this morning. I would figure out a way — no matter how many billions it took — to get VIX back below 36.20. I would ramp the crap out of USDJPY. And, I would make sure that CL — which tagged our 63.39 target last night — kept on bouncing.
I wouldn’t necessarily forget about the SMA200 down at 2535. I’d maybe come back for it after it reaches 2703. Or maybe not. It’s not terribly important. By the way, a 15% rally from today’s lows (if 2593 holds) would be 2981 — just a tad below the next major Fib line at 3047.
Would this “fix” things? Nope. But, it would buy time to sweep the VIX problem under the rug.
The above work got me thinking about a new analog, which I’m in the process of working through right now. As this post is getting a little long, I’ll continue it in another post I hope to complete this afternoon.
Comments
2 responses to “That Escalated Quickly!”
This post is timely and most applicable. I watched SPX after hours, at 11pm, it was down another 2%. At 3am (EST), it is actually up! So far, this is like the night Trump won the election which I also watched.
Old dogs and their tricks…