

I love analogs. Sometimes called fractals, they can provide an excellent road map for future price moves based on past ones [for details and a general explanation, CLICK HERE.]
The first one I ever discovered was the best I’ve ever seen — a repeat of the 2007 top in 2011. It forecast the summer of 2011 drop to the day and the dollar with very few head fakes along the way.
 My favorite analogs forecast big drops and provide an opportunity to score big gains by shorting or simply avoid big losses by hedging. But, I’m not picky. I’m a big fan of any opportunity to figure out where the market is going before it gets there.
Of course, I always post these with a little trepidation. Even though almost all of them have worked out, there have been a few notable exceptions over the past 7 years. Even those have value, though, as the failure for a move to takes place usually confirms the likelihood of the opposite move — also useful.
The drop since Jan 26 offers an intriguing possibility to repeat a previous pattern which, if it plays out, could produce a nice 15-20 gain over the next couple of months. More importantly, it could keep us on the right side of the ledger in the midst of heavy volatility.
continued for members…
The gist of the analog is that we’re following in the footsteps of that 2007 VIX overshoot discussed in this morning’s post. If so, VIX is a fantastic short here at 49.21.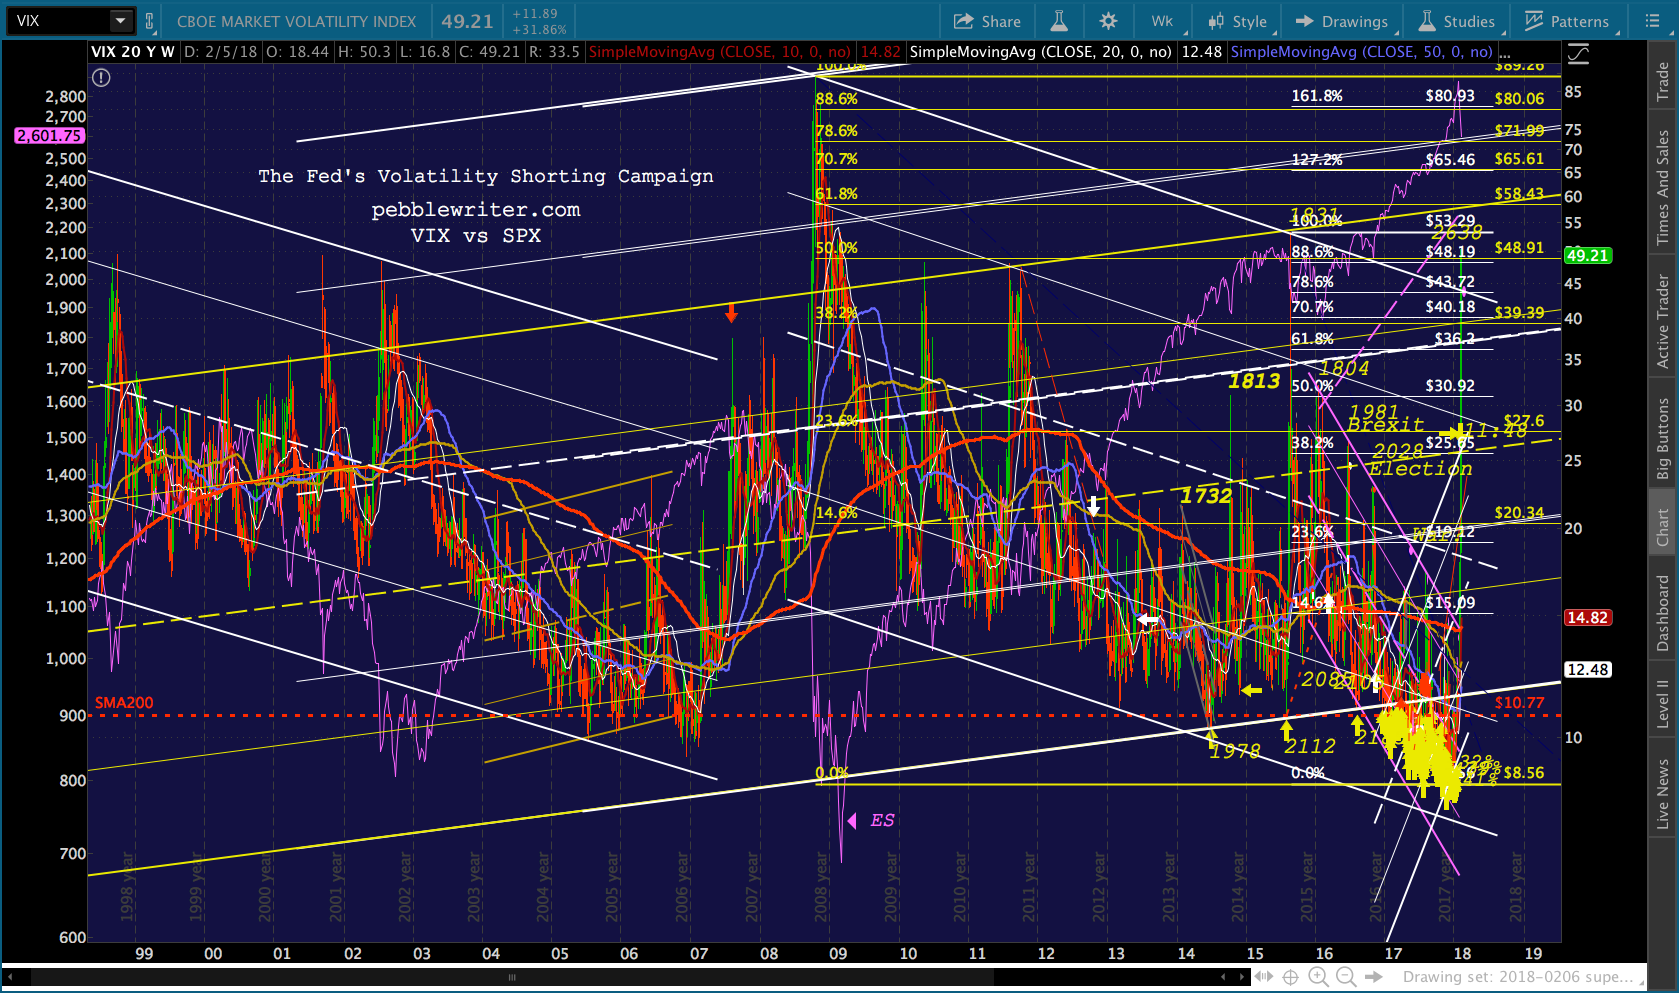
 That pop above the channel line was the same day that SPX bottomed out after its channel from June 2006 broke down and SPX fell below its SMA200.
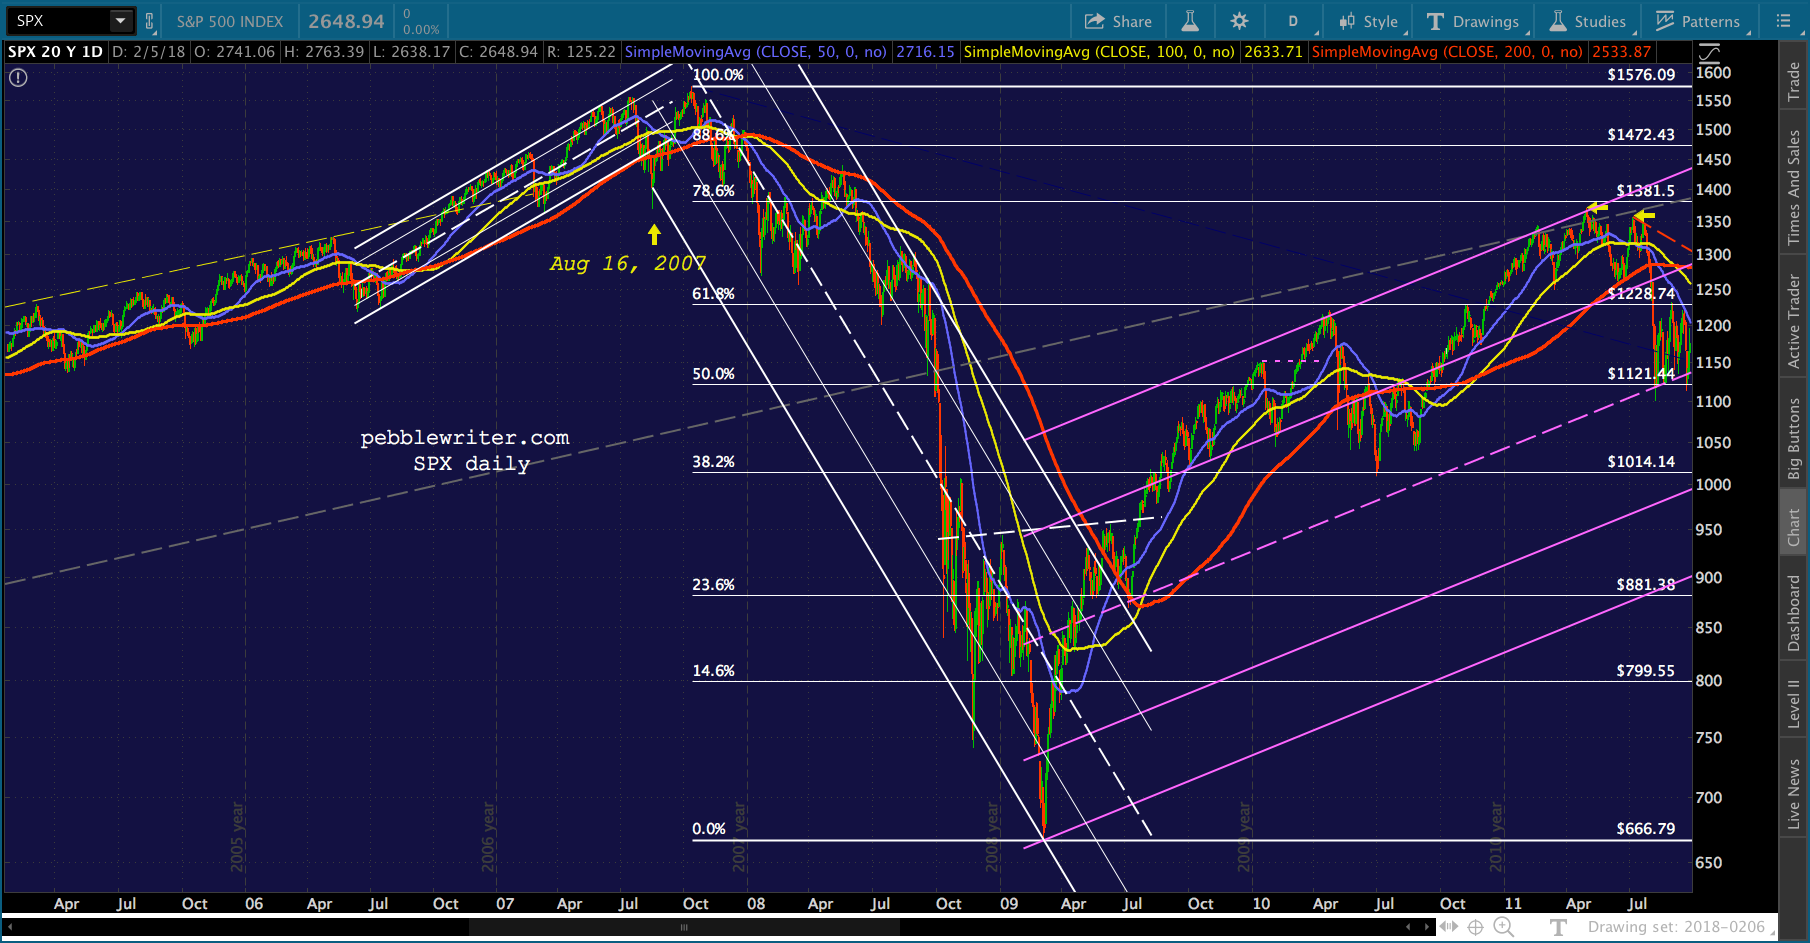 There are other similarities, as well. For instance, there were few reversals at key Fibs along the way. The .500 was the most significant, and it took six months to produce an 8% decline (never reached 10%.) Most of the Fibs were only acknowledged on backtests.
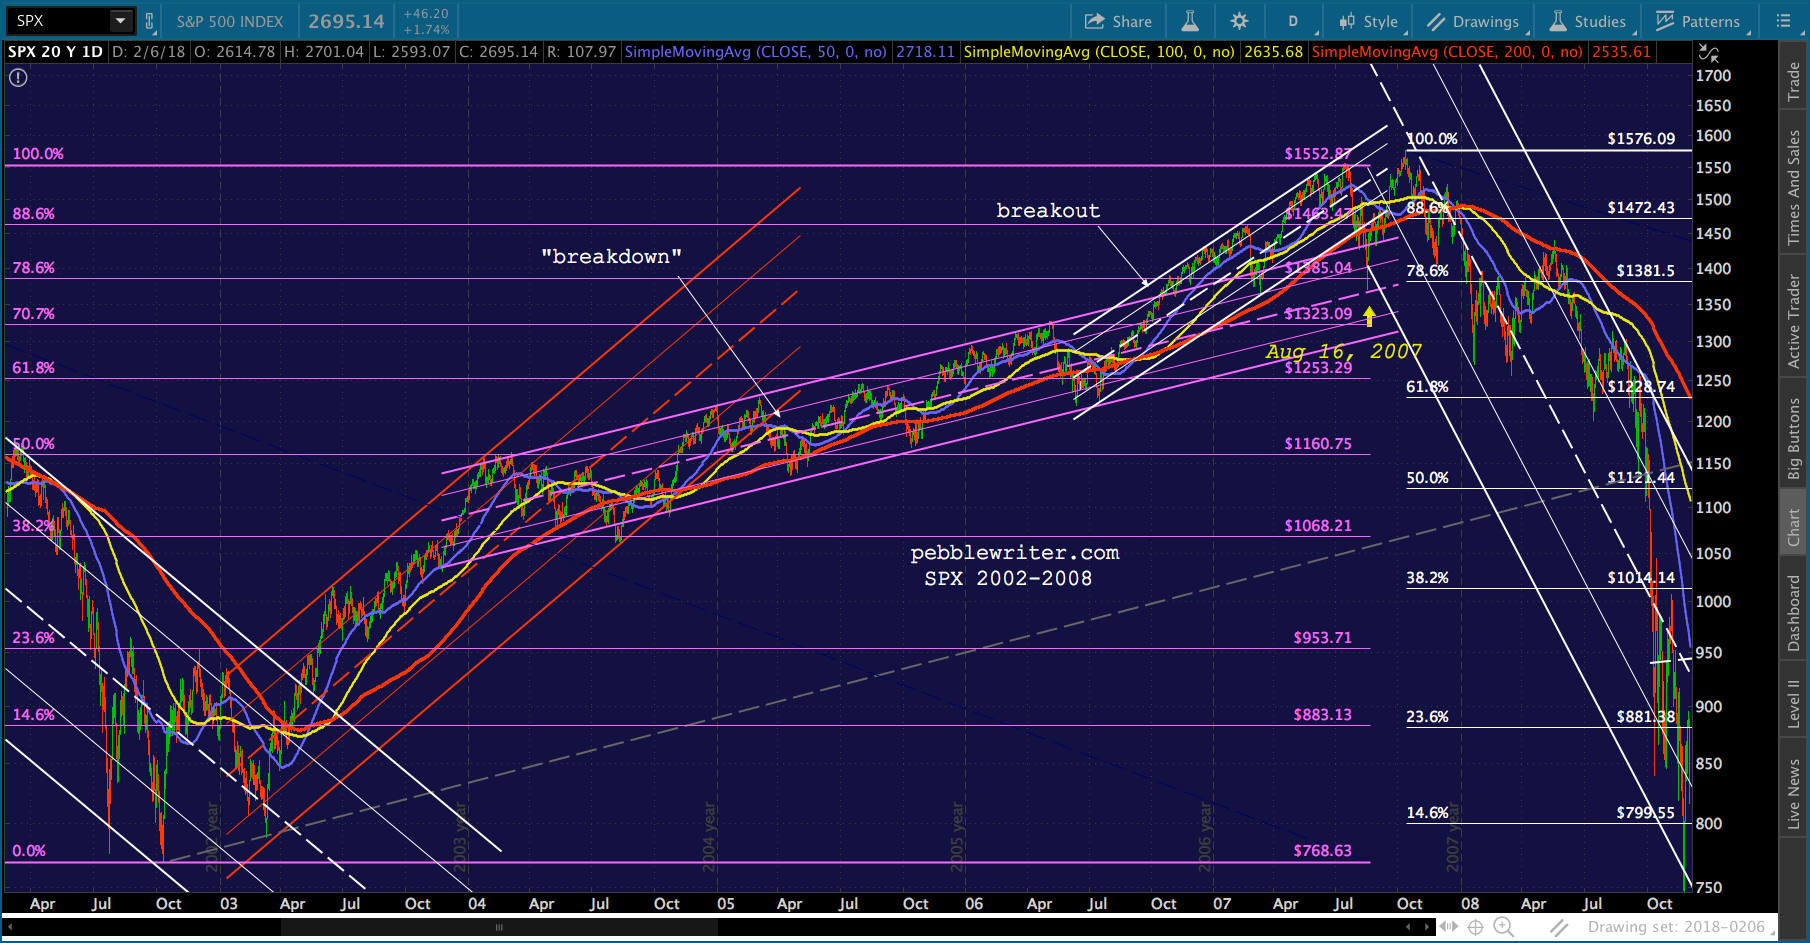 The breakdown of the rising red channel in Mar 05 produced a higher low and launched an alternative rising channel.
And, the channel from Oct 03 to Oct 06 looked a lot like SPX’s recent rising white channel. As SPX neared the .786 (where it might finally have put in an actual correction) it suddenly broke out of the purple channel and rose at an even steeper slope.
The August drop was the second of two backtests of the rising purple channel it had broken out of, and rebounded as soon as it reached the .786 Fib. The strong rebound from that date through Oct 11 is the one I suspect could be the example for the our current situation.
Here’s the current SPX chart, again.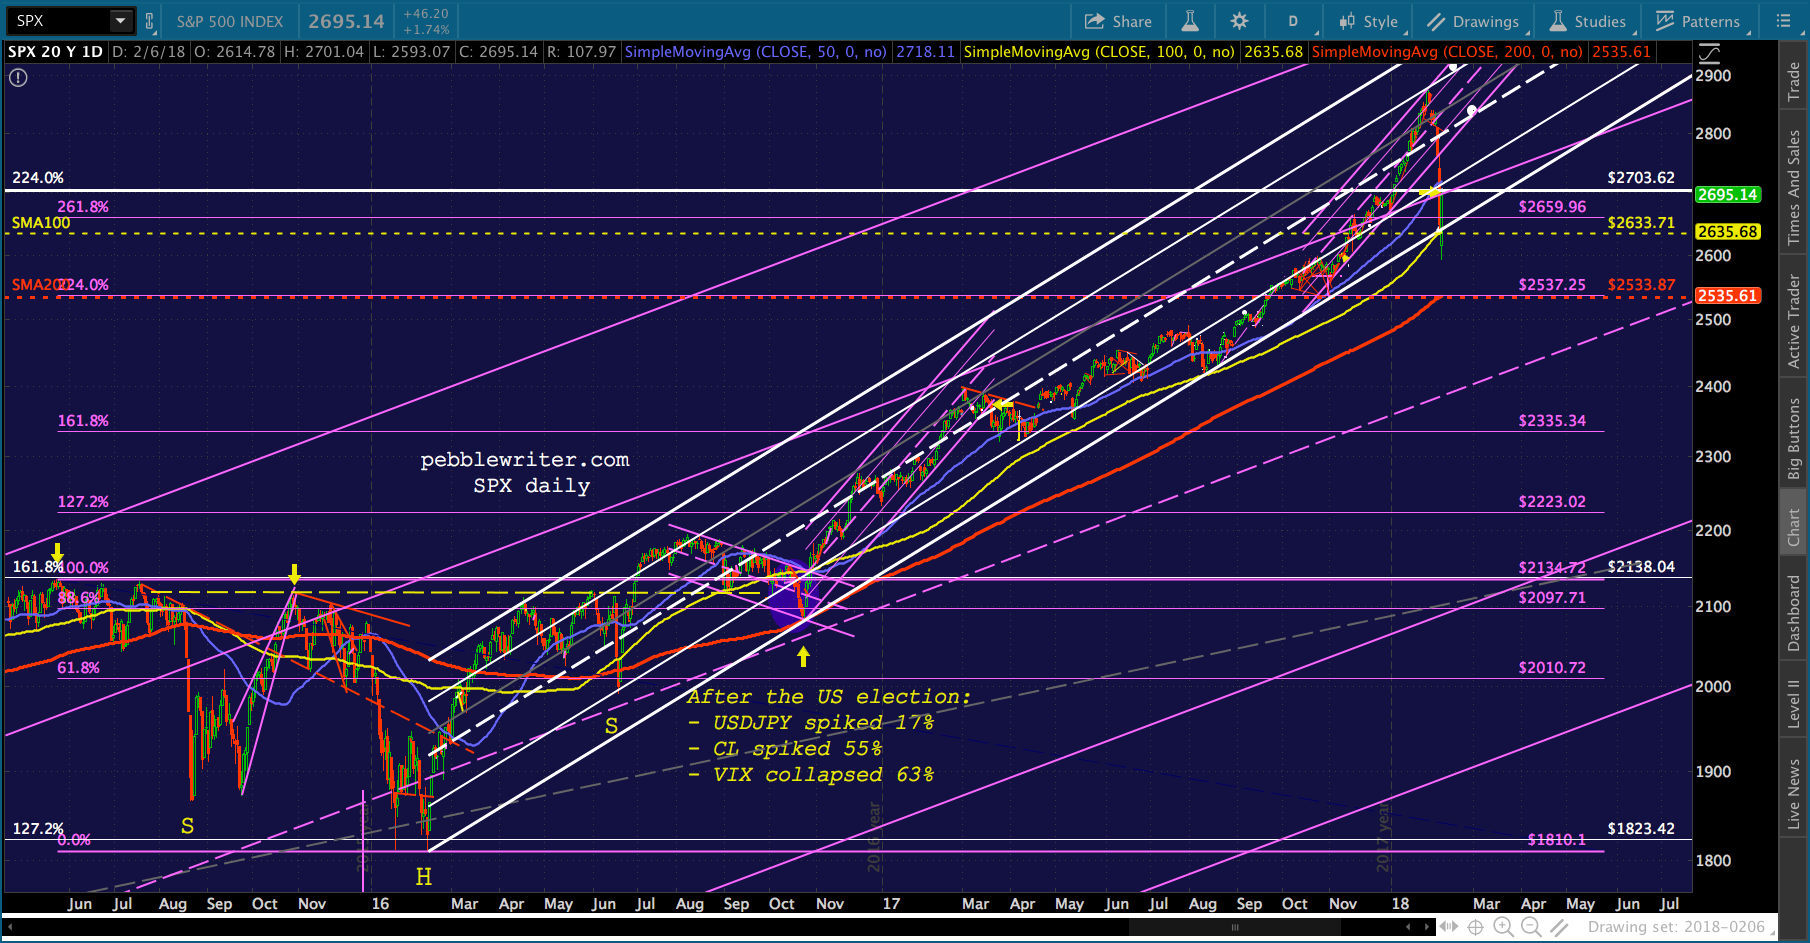 If we focus on the highs in 2016 and 2017 instead of the lows, we could draw it like this. Ignoring the obvious time scale difference, we can see a very similar pattern to the 2002-2008 chart — complete with:
(1) the breakdown that didn’t produce much downside
(2) the breakout above the 2.24 Fib via the construction of a steeper, new channel; and,
(3) a backtest that landed at the midline of the purple channel it broke out of.
 The more interesting similarities, and the focus of the analog, is VIX. The falling white channel had been pretty well established by 2007, with two bottoms and one top. The tag which might have occurred on Aug 16, 2007 was, as we’ve discussed, an overshoot.
 But, there were other interesting breakdowns (a, b and c) where a drop through a trend line or horizontal support helped SPX on its way higher. In particular, the rising purple channel from 2004-2007 eventually broke down in Oct 2006 — the exact same time that SPX broke out of the purple channel and began the steeper white channel.
The breakdown continued from late October 2006 to Feb 2007 — not too dissimilar to our more recent yellow channel bottom’s breakdown between December and Feb. The closeup below shows how this barrage of breakdowns fueled SPX’s rising white breakout channel. 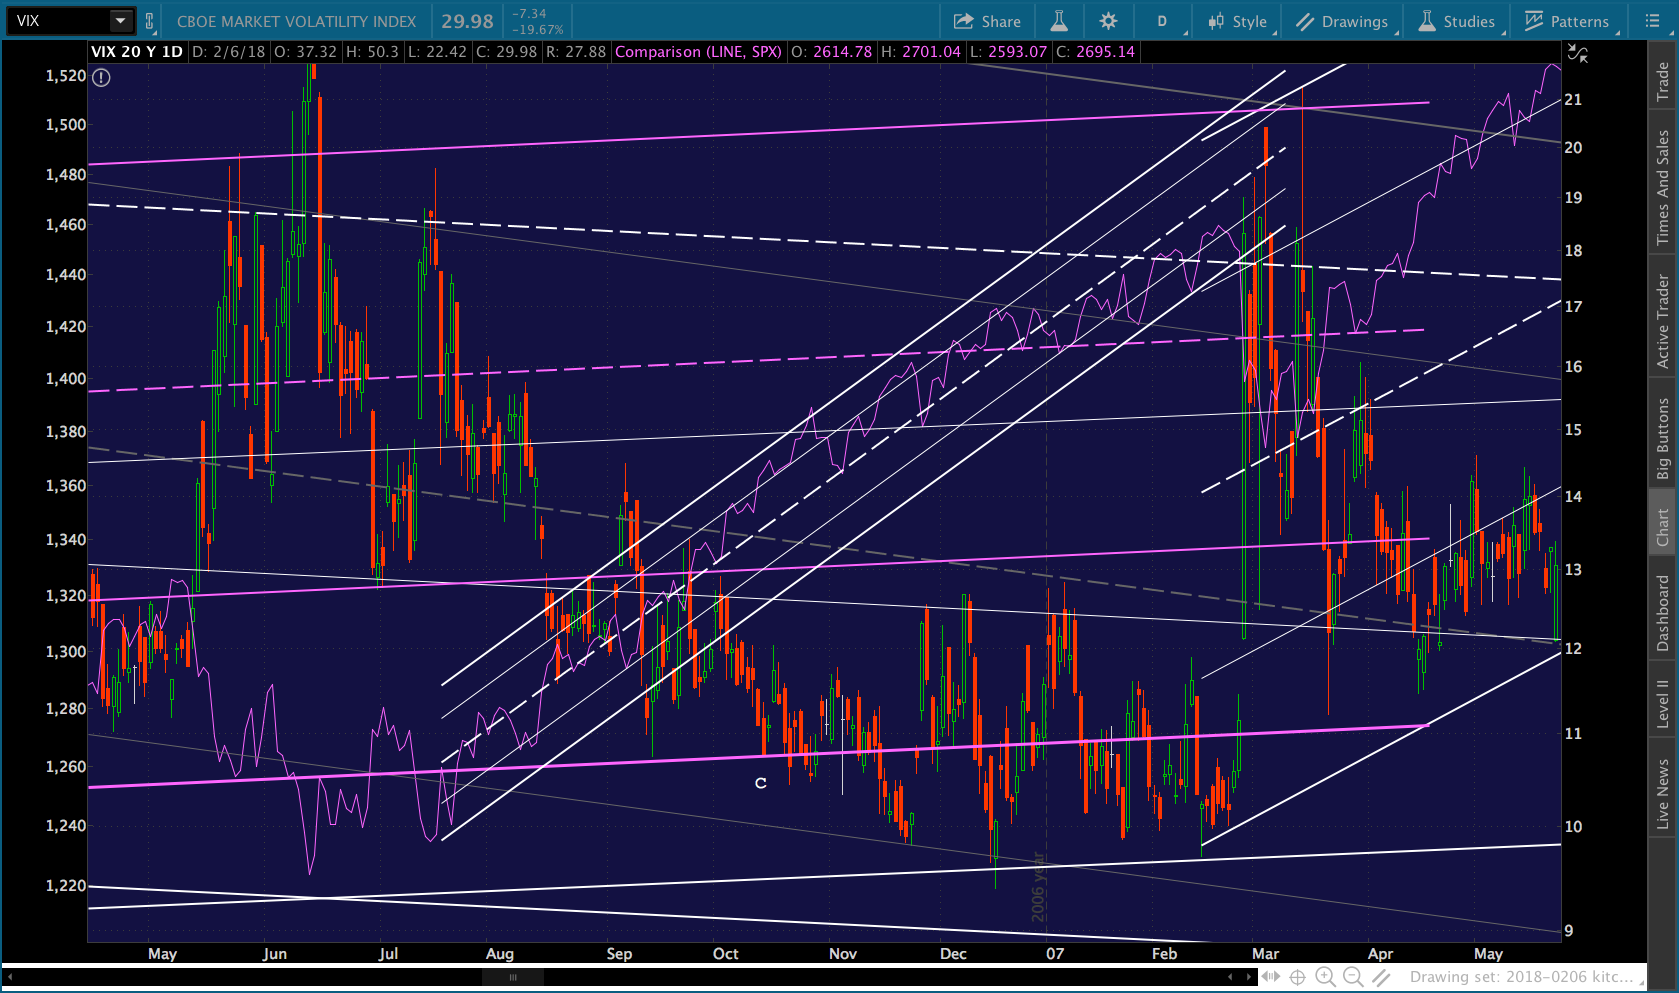 SPX’s channel finally broke down only when VIX popped 70% on Feb 27, 2007. On Mar 14, it rose even higher, producing SPX’s initial backtest of the broken purple channel. And, in July, VIX broke above the extended top of the rising purple channel – prompting SPX to break down and put in that Aug 16 low.
Enough background. Suffice it to say that even back then, VIX was being used to produce higher equity prices.
On Aug 16, when VIX pushed above the falling white channel top, SPX’s breakout broke down (1). The second rise above the channel top broke the longer-term channel bottom (2). The rising white channel that was subsequently created is the basis of the analog. If we’re at Session 0, then we should be looking for an interim low on Session 6 — Feb 14. Note that Feb 14 is the day that CPI will be released.
It would be a logical point for SPX’s current rally to run out of steam, at least temporarily, as investors digest the higher than expected CPI data.
Feb 14 also happens to fit with a number of other important chart points we’ve been watching. For instance, that’s the day I’ve been expecting DXY to bottom out. In 2007, we saw VIX bounce a bit through Session 16, which today would be Mar 1 — about the time that DXY, if it bounces at 87.465 on Feb 15, could come back and tag the .500 Fib where it intersects with the falling white channel at 87.259.
From there, the next major move for VIX is lower – fleshing out the rising white channel on Session 39. In 2018, that equates to Apr 2. And, as it happens, Apr 2 is about the time that the current white channel reaches the 2.618 Fib at 2047.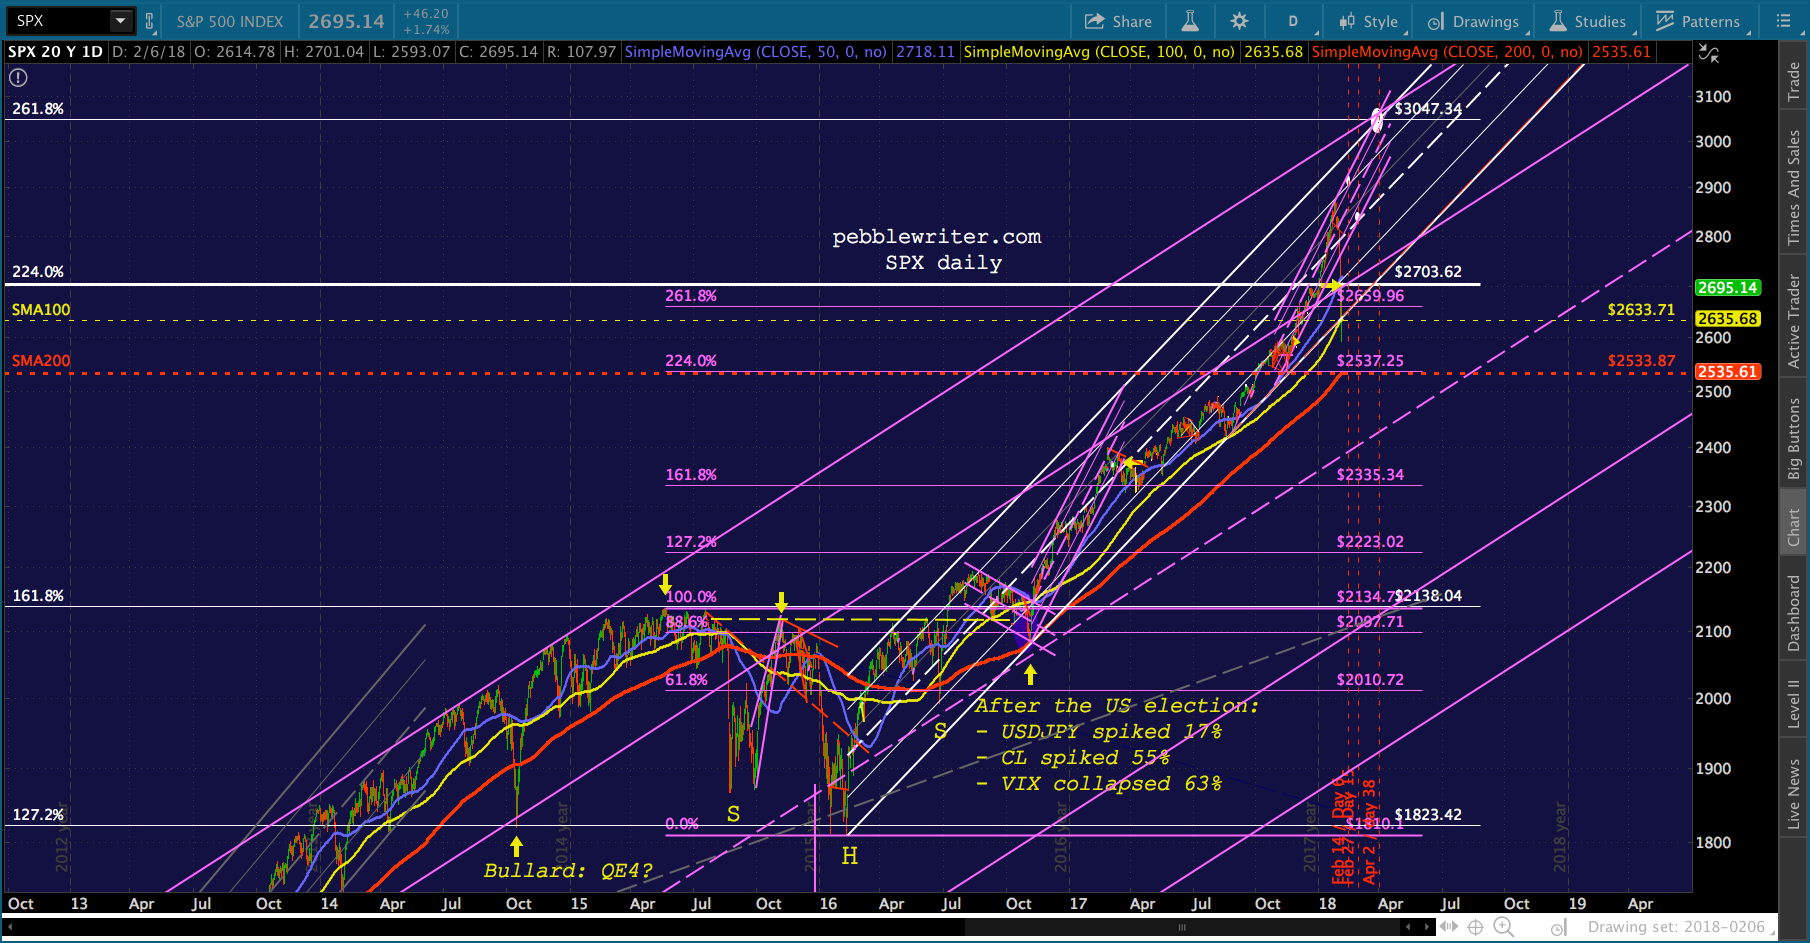 All in all, SPX’s rise between Day 0 and Day 39 amounted to 15.03% and obviously produced new highs.
  A 15% rise from today’s lows of 2593.07 would be 2983, so we’d be a little off. 3047 would be 17.5% higher (454 points.) Interestingly, though, the 1.618 extension from the recent plunge would take SPX to the very same spot.
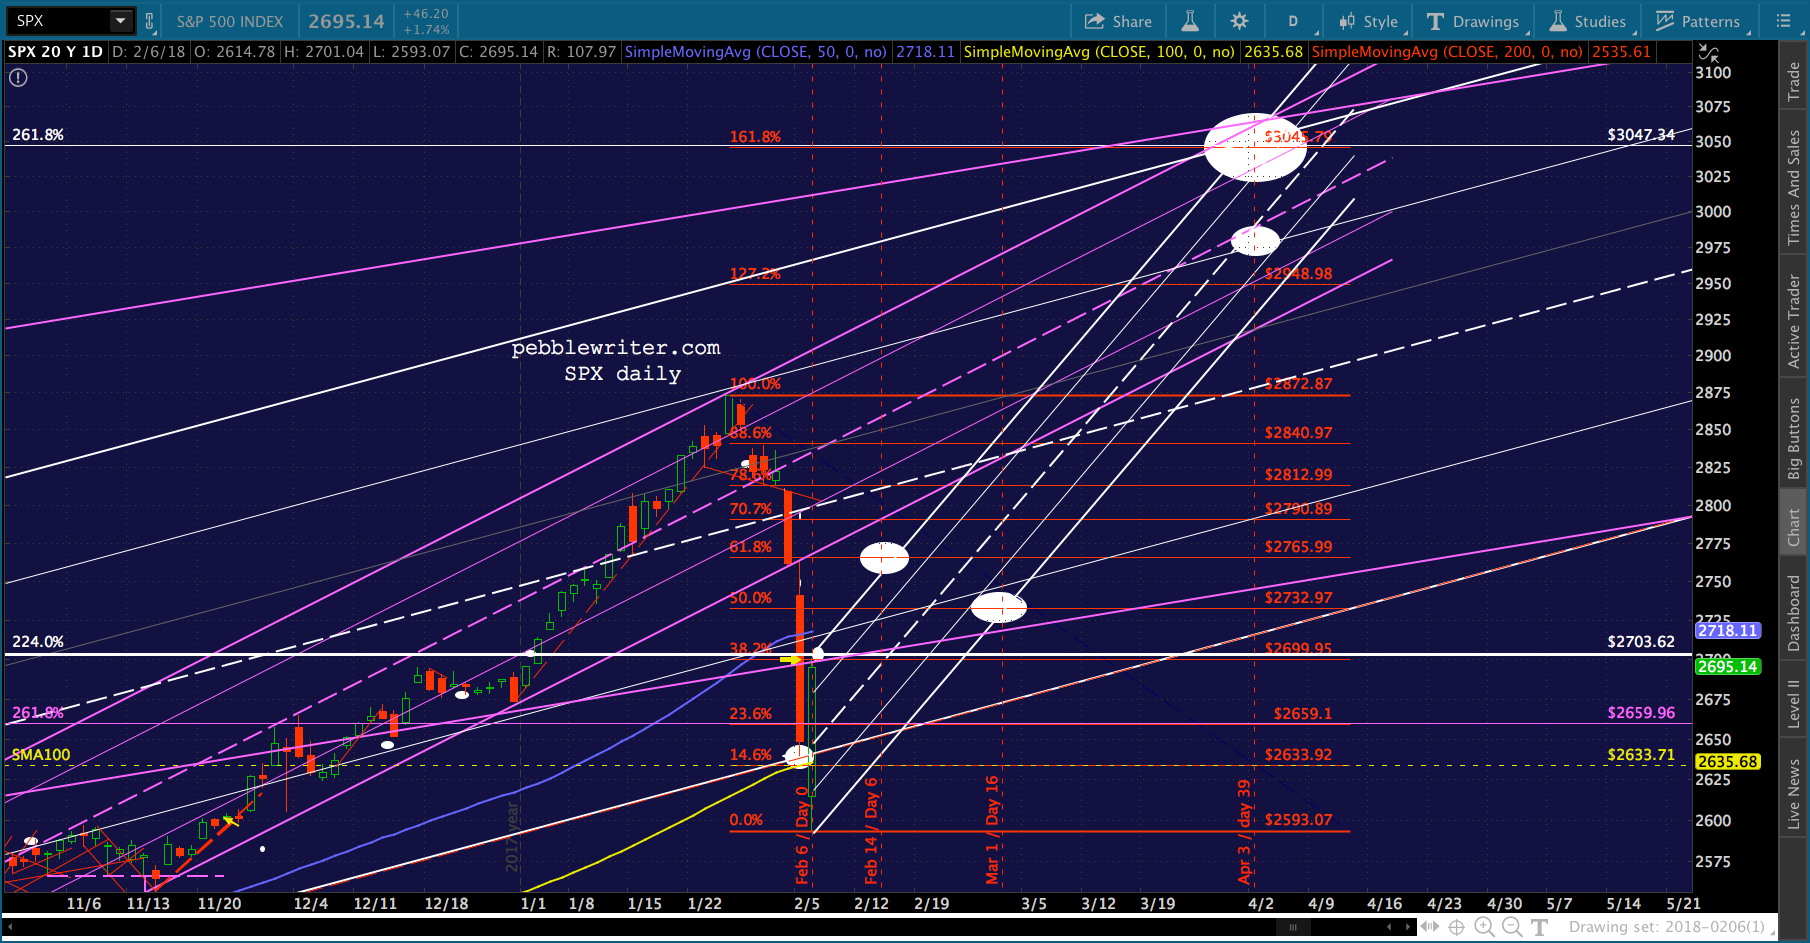 If SPX merely bounced to the midpoint of the purple breakout channel, as it did in 2007, it would land closer to 2983 — about 2.5% below the 2.618. A reminder: it’s not uncommon for SPX to reverse just short of a major fib like this in order to have more momentum to pop through it after consolidating.
This is all pure conjecture at this point. While SPX bounced very nicely today, it hasn’t pushed back above the 2.24 at 2703 yet. Unless it does, today’s bounce was merely a backtest and the SMA200 (currently 2535.61) is our primary target.
Tomorrow, we’ll take a look at the November 2016 recovery and see if we can draw any inferences — maybe a different looking analog. I’ll also apply the turn dates to USDJPY, EURUSD, CL, RB and DXY to see how plausible the analog is and to help establish some targets for those charts.
Speaking of tomorrow, this is my second 18-hr day in a row. So, don’t be alarmed if I don’t post terribly early in the morning — especially if SPX is set to bounce above 2703.
GLTA.