

USDJPY finally pays off. Recall we turned negative on the pair on Dec 11 when it appeared its breakout had run out of steam [see: PPI tops 3%]:
For those playing the USDJPY, this is a good entry for a short position with tight stops. The initial target is the SMA200, currently at 111.64, followed by the .618 at 110.14 and channel bottom currently around 109.

A second spike ten days later tested our resolve but, in the end, merely offered another nice entry point for a great short [see: VIX – New Lows.]
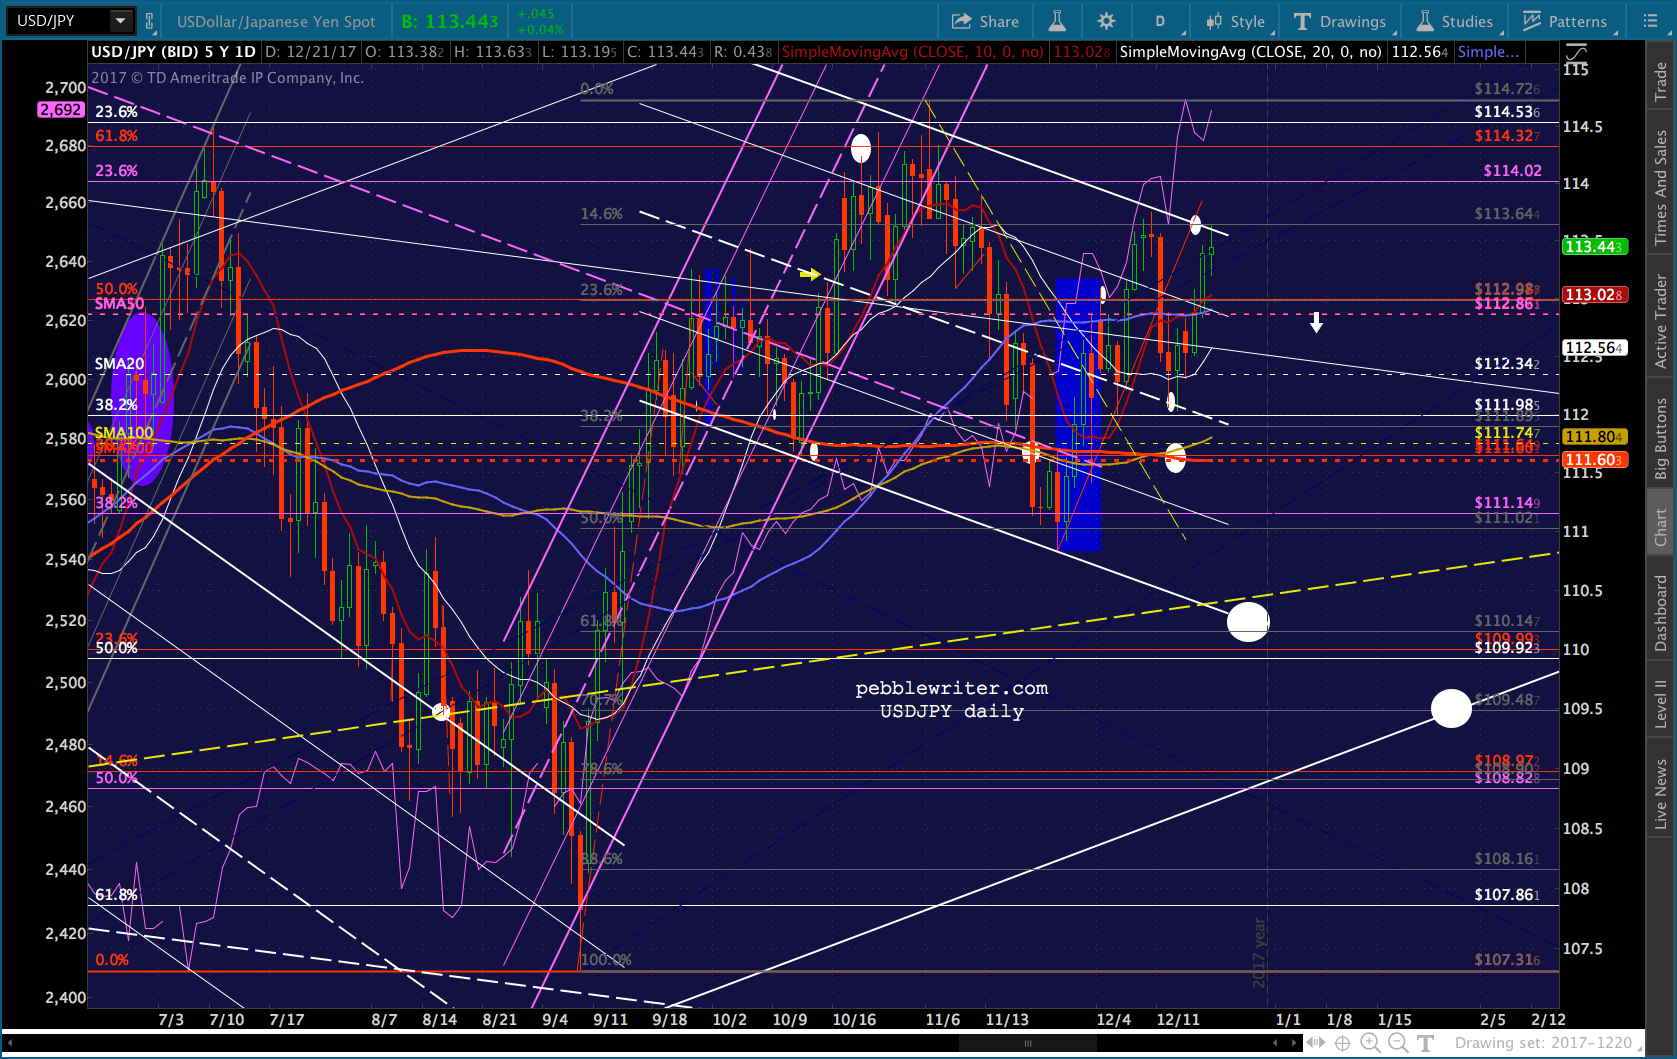
With USDJPY now sitting at key channel bottom support, have we reached an important turning point? 
continued for members…
We’ve reached the bottom of the rising white channel which has held on four previous occasions since its origin in late 2012. The slightly bigger picture…
 …and, the much bigger picture.
  Note that USDJPY also has support, again, from the yellow channel midline.
 If it reverses here, we should see it return to test the white channel top at 118.55, the .618 at 120.11, and horizontal resistance (and, an IH&S neckline) at 126.52.
If the white channel bottom doesn’t hold, then the white channel would yield to the yellow and eventually we could see the yellow .236 or bottom come into play. First, however, we’d have support at the falling white channel’s midline around 106.50.
Given that EURUSD is also about to reach its upside target, I think we’re looking at a strong bounce here at 109.38. But, as always, use stops to protect against the unexpected (and yours truly’s stupidity.)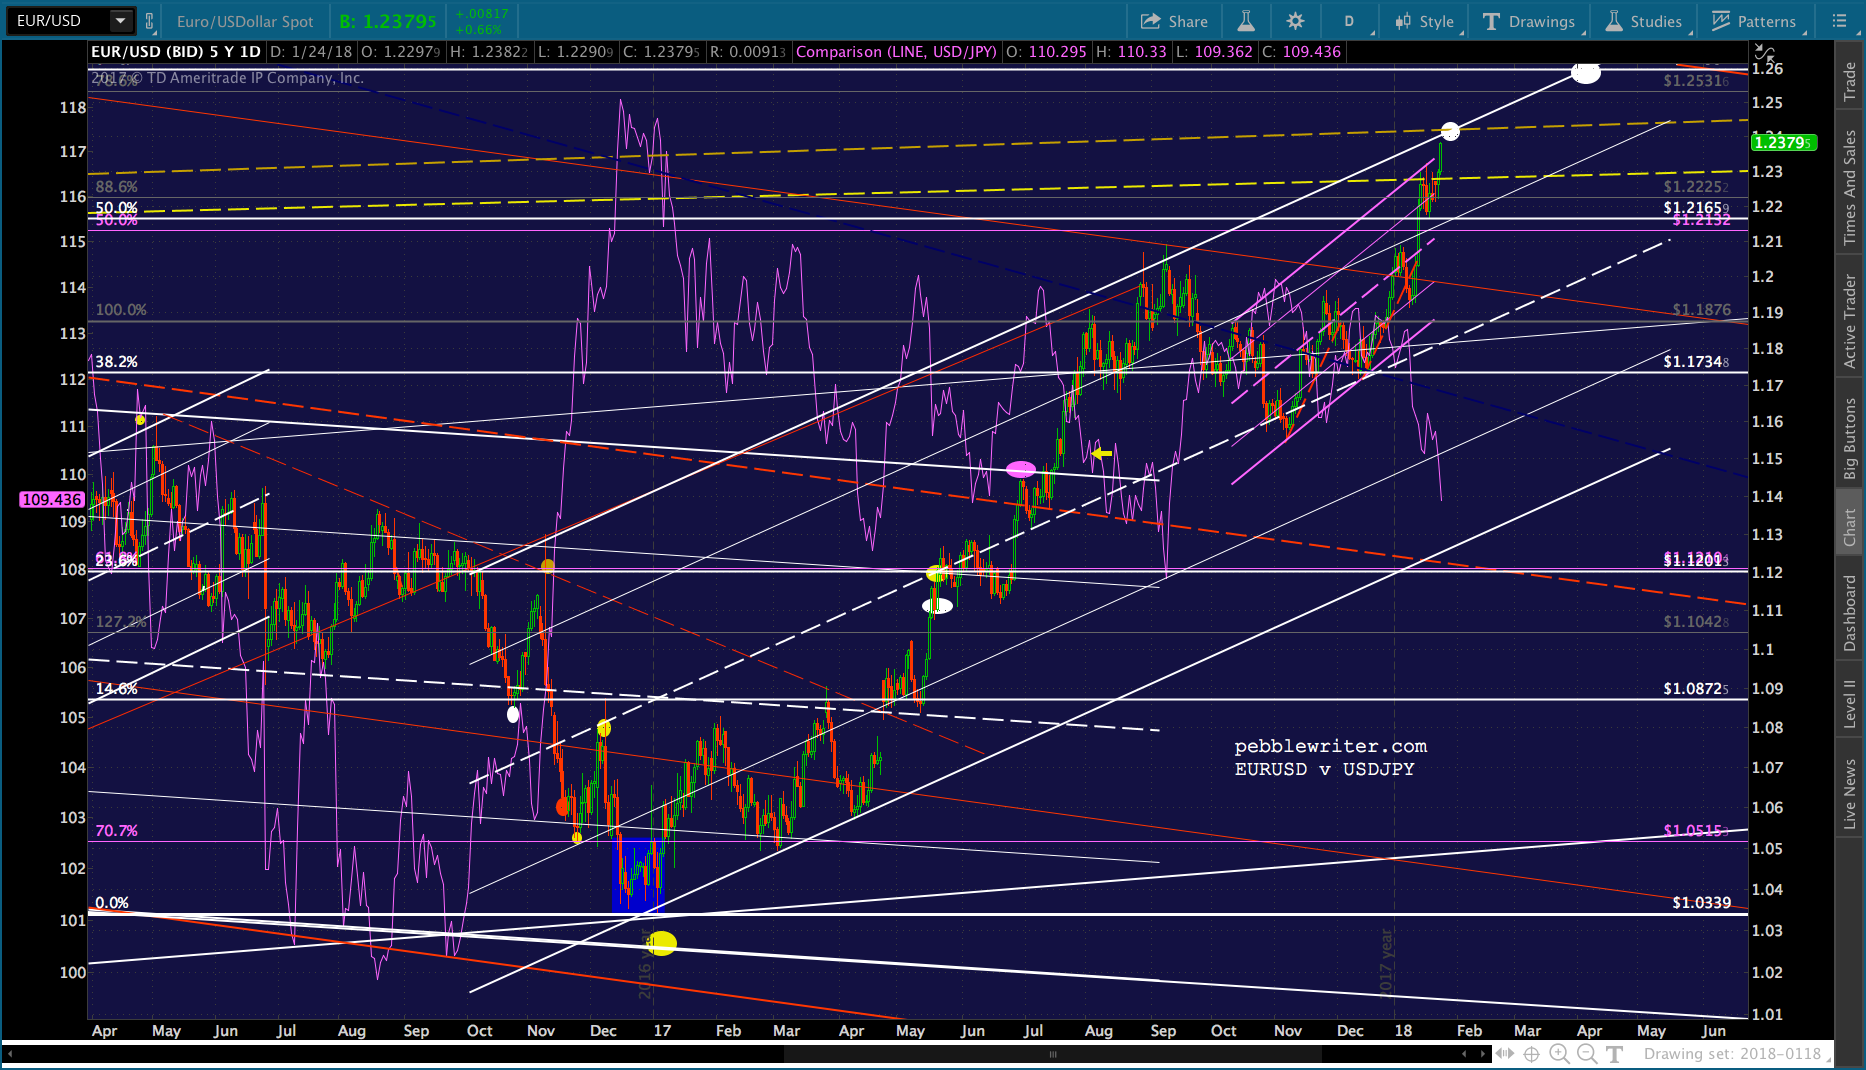 DXY still has a little ways to go (88.423-88.682), but it also is subject to a potential overshoot or bounce and subsequent return to these levels due to presence of the rising purple channel bottom (at 87.4 now, or at 88.4 again later this summer if it bounces here.)
Bottom line, USDJPY isn’t necessarily done until DXY is done. We had bounces at the .500 and .618, so an overshoot to the .786 at 108.90 or even the .886 at 108.16 is a distinct possibility. USDJPY likes big, dramatic reversals.
But, I’d be comfortable going long anywhere around 109 — especially if DXY has already reached our target range. On a side note, if USDJPY and DXY do bounce here and EURUSD reverses, CL and RB can finally take a breather without risking equities’ rally.
Upside targets if the channel bottom holds? The first task would be breaking the TL off the 2015 highs, currently around 113.07. After that, the top of the falling white channel at 118.66 is appealing. At 118.67, it would top Dec 2016’s highs. 
A slight breakout would take the pair to the purple .786 at 120.10 — .01 away from that important .618 at 120.11. And, the .886 at 122.78 would put USDJPY right at a TL from the 1998 highs. Its easier to see in the Prophet chart below. The other nice thing about this chart is it shows USDJPY has been locked in between the midline and .786 line of the falling blue channel for almost five years. It’s been a very profitable range for equities — a sweet spot, if you will.
As long as things are going well with stocks, we can probably expect it to remain in this range. Only if stocks get stuck (e.g. plunging oil prices, war, etc.) should we expect it to break out into the top quarter.
GLTA.