

With VIX finally unshackled from its falling channel, the question of the day is “how bad can this get?”
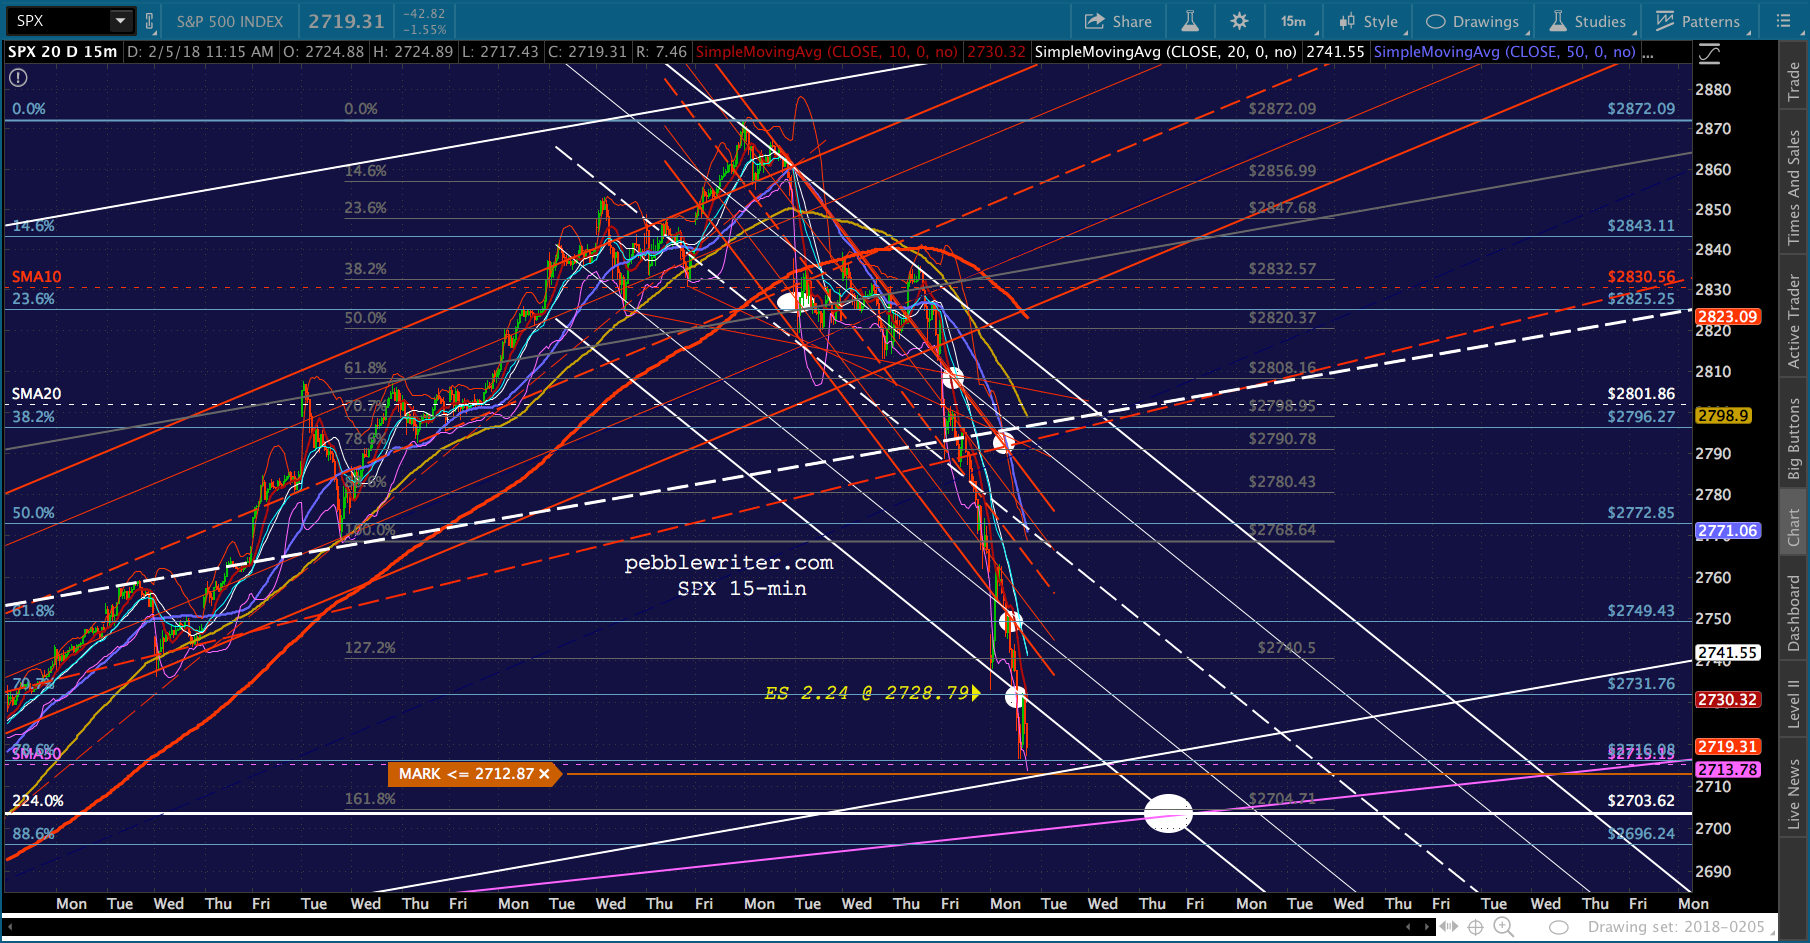
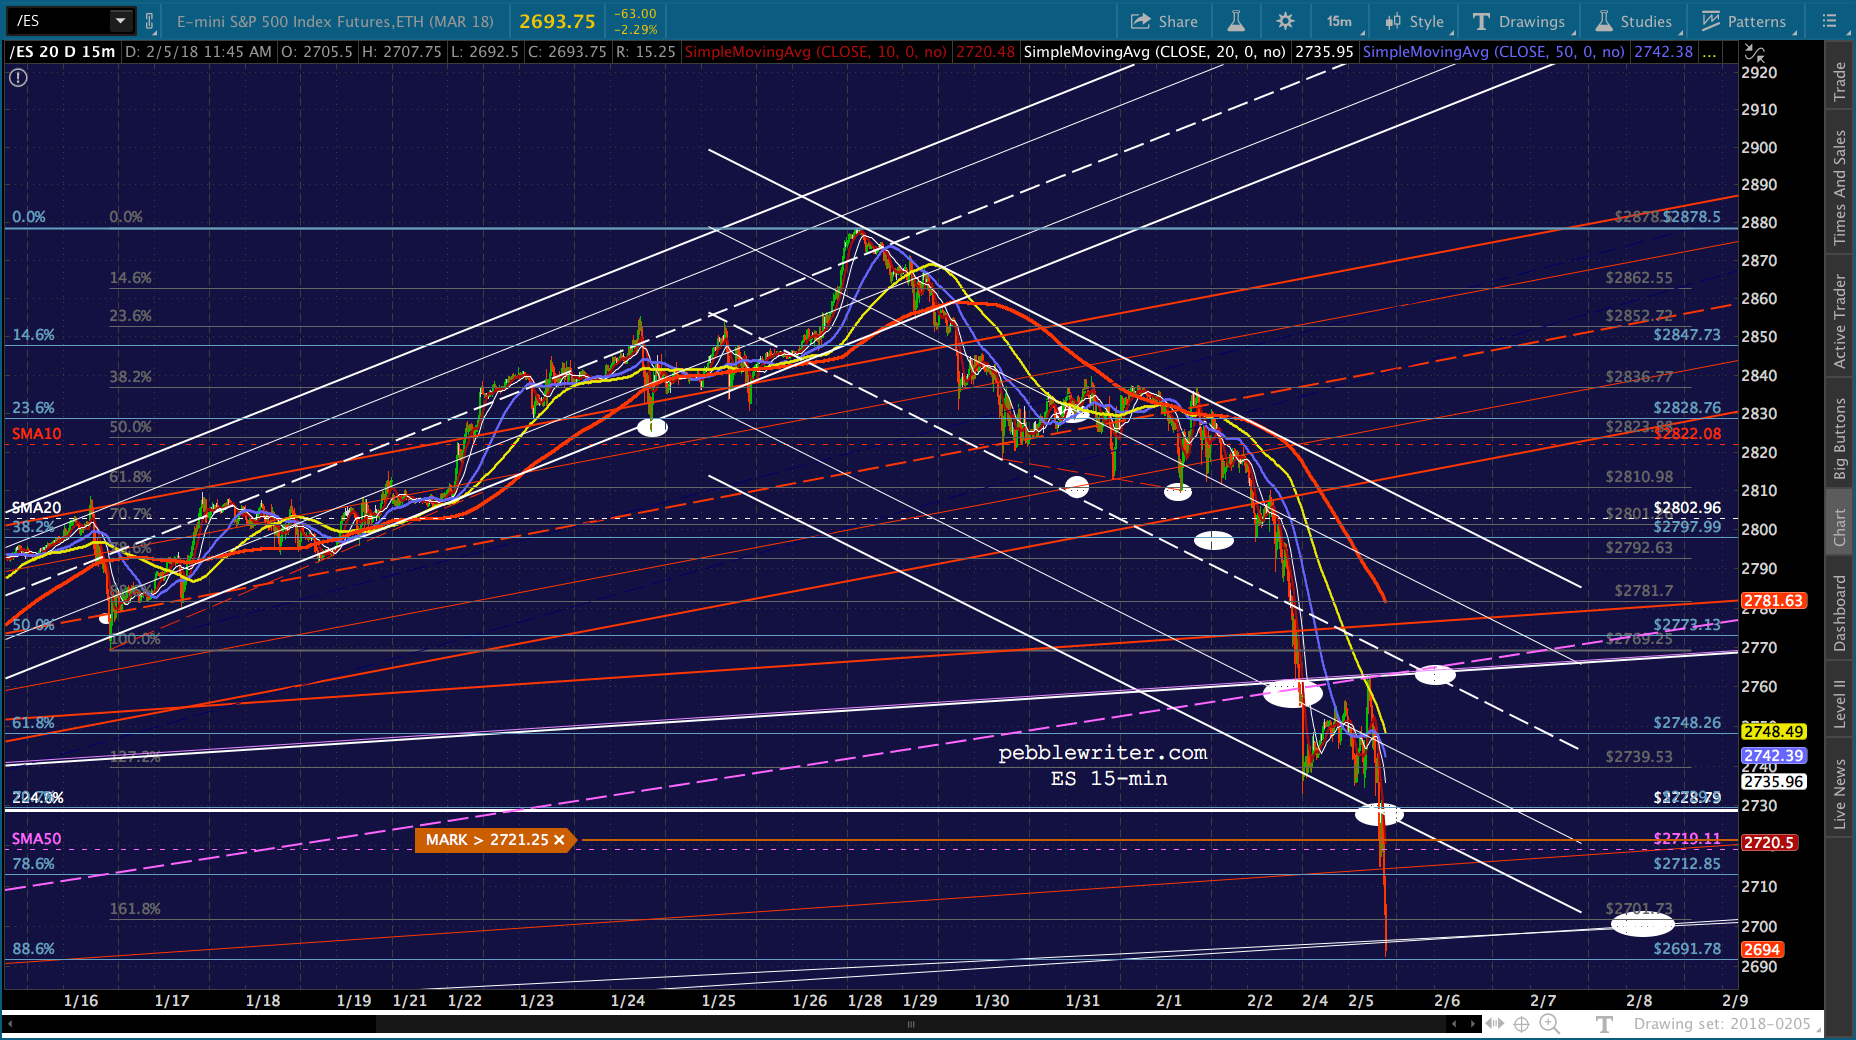
 It all depends on whether ES or SPX will be in the driver’s seat. ES closed at our purple TL target, but as we discussed last week, its 2.24 Fib extension is a little lower at 2728.79 — the equivalent of SPX 2730.
 Now, 2730 isn’t terribly significant on SPX’s chart — a .707 Fib and well above SPX’s 2.24 way down at 2703.62. So, we have an important conflict.
 The way this sort of conflict is usually resolved is a bounce at the higher target, followed by a leg lower or…. a nonsensical V-shaped recovery. Which outcome do the charts suggest?
continued for members…
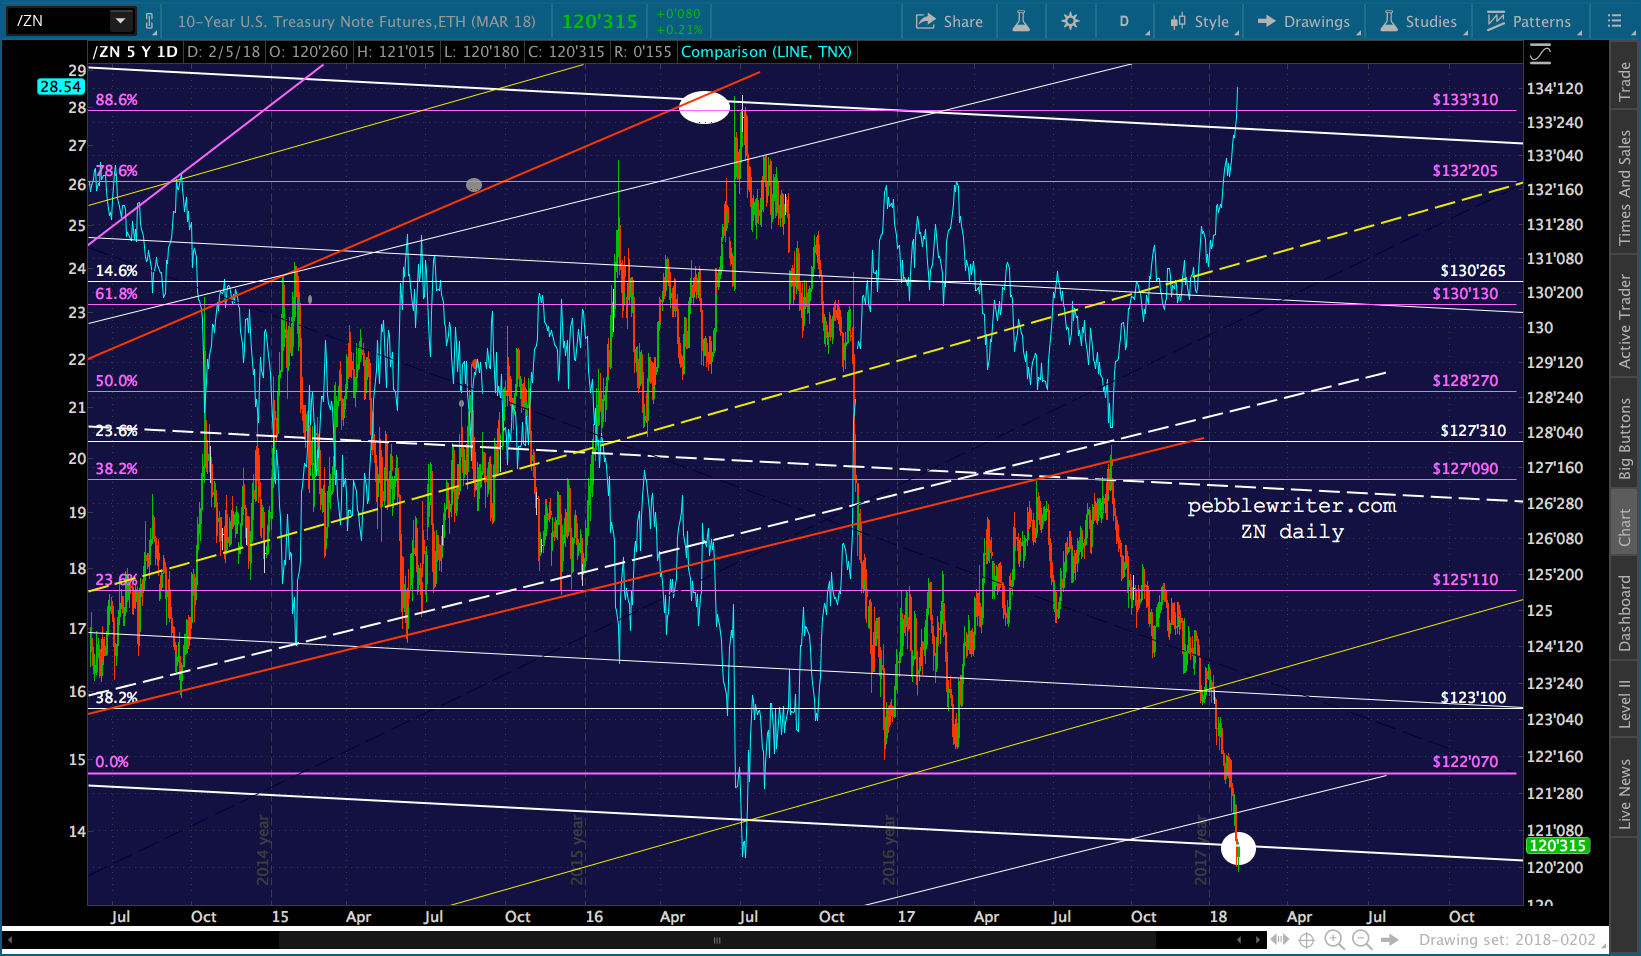
My preference is for an intraday plunge down to SPX 2703, ideally later this week. But, much of it will depend on DXY, EURUSD, CL and RB. Note that ZN is still hanging out near our 120’315 target, and TNX topped out just .02 below our 28.56 target on Friday.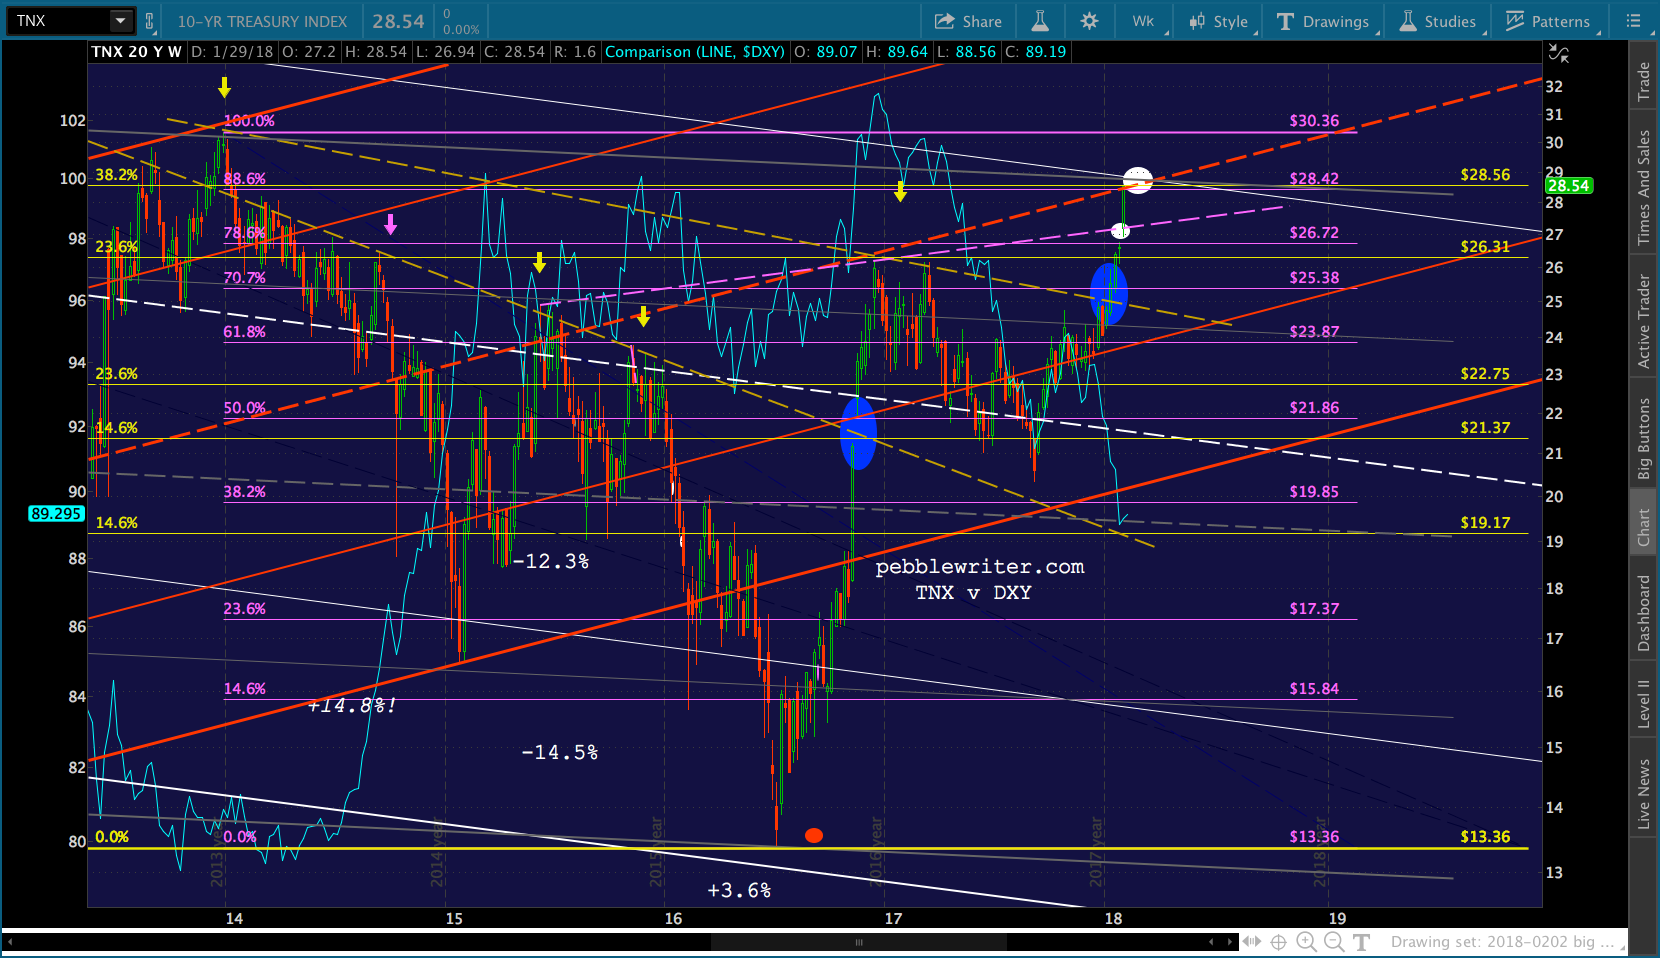
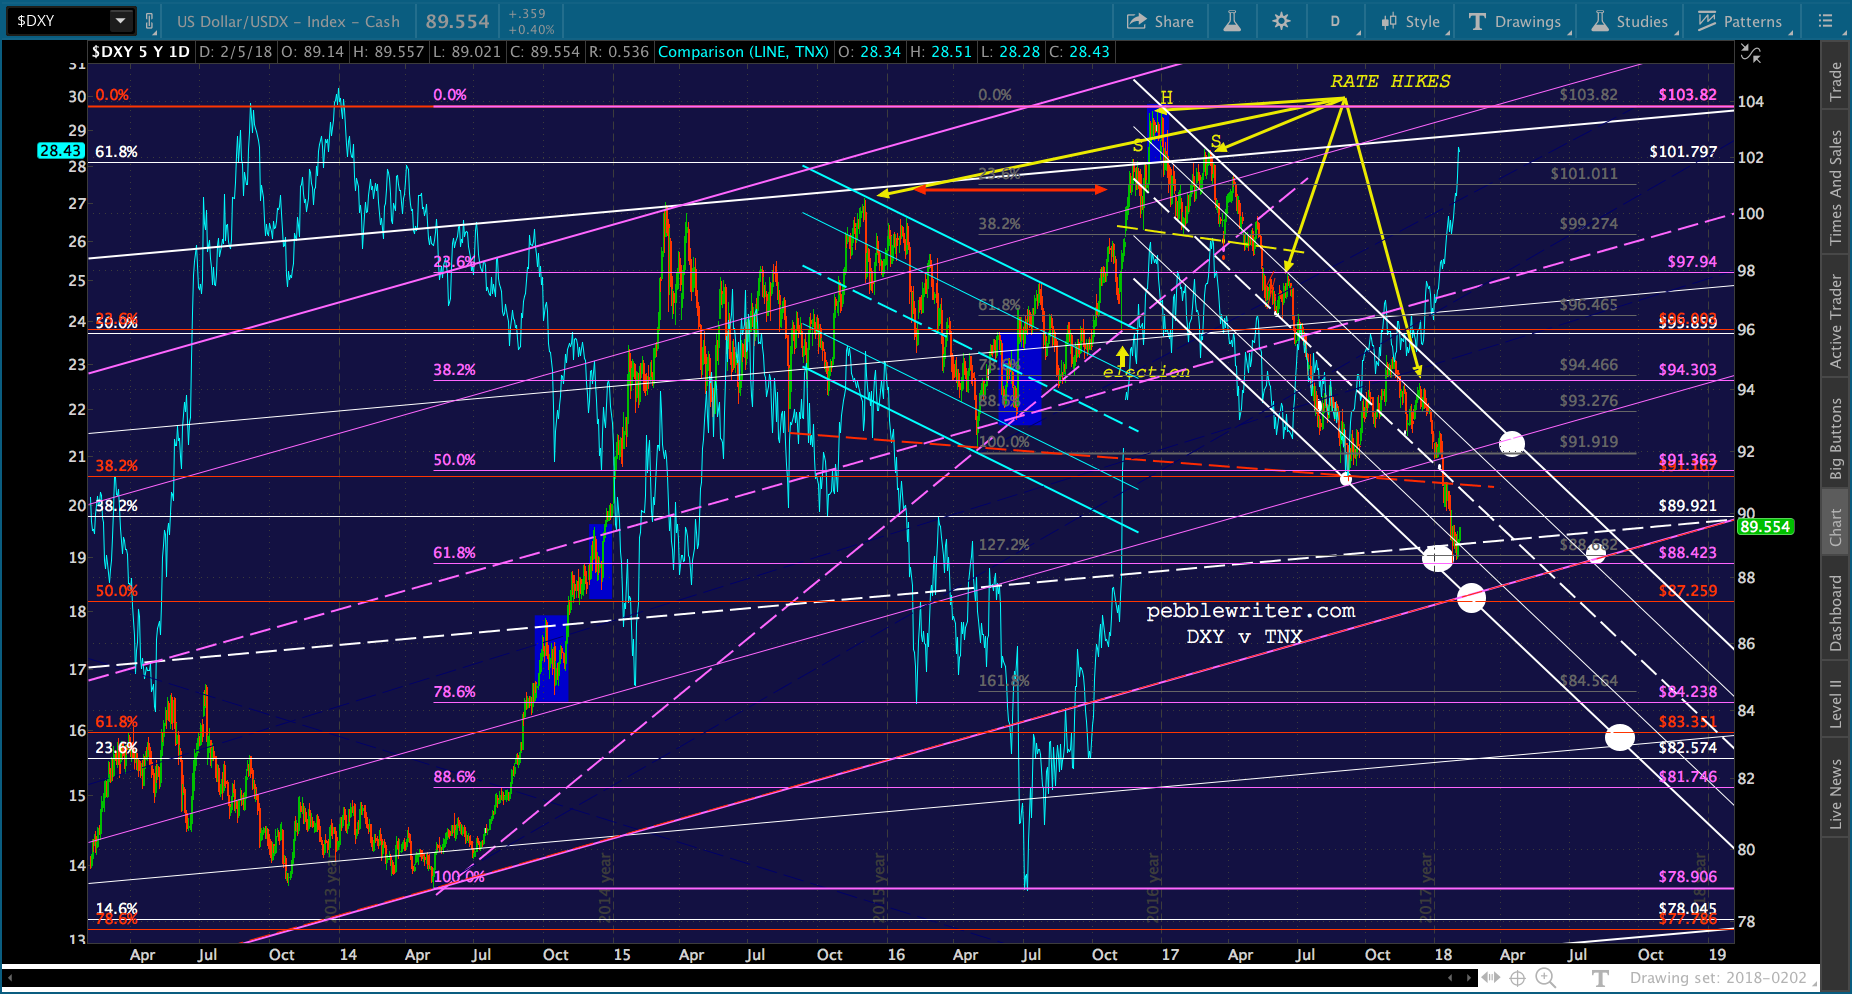
 DXY seems to still be unfinished…
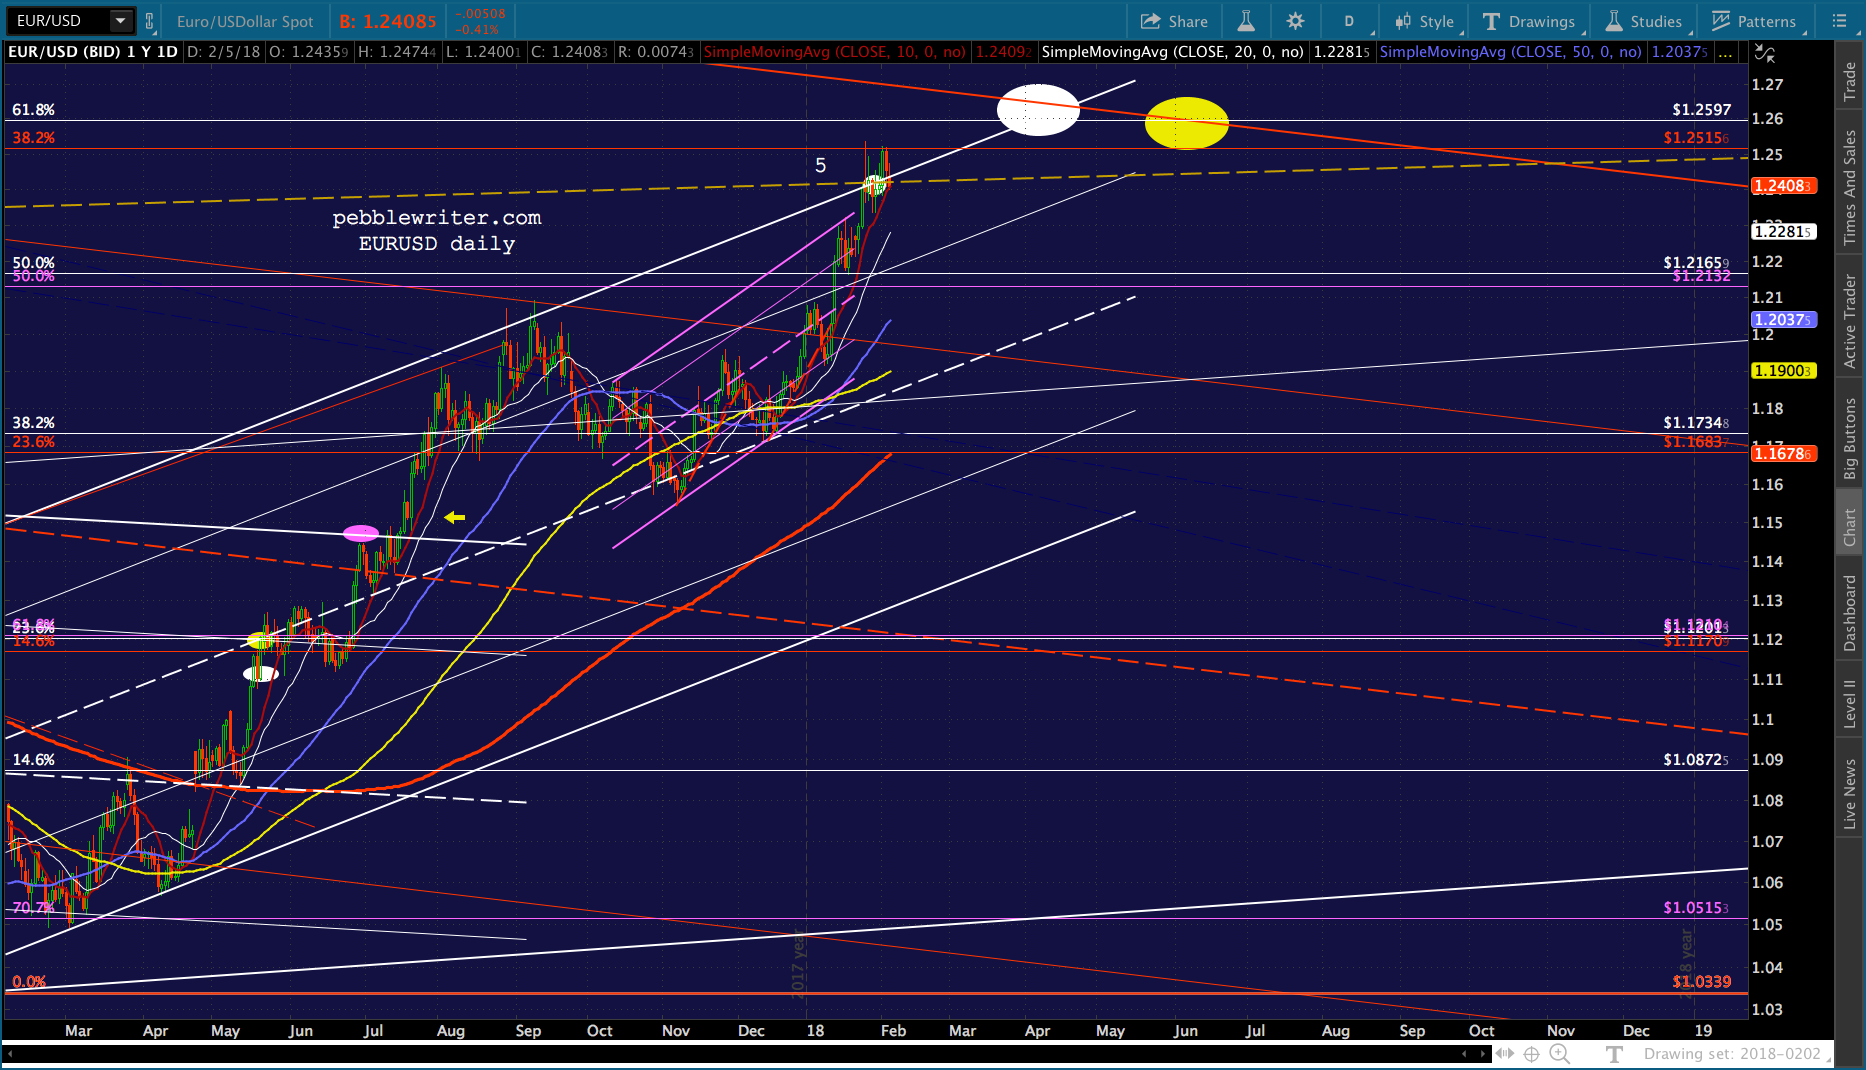
 …as does EURUSD.
 UPDATE: 10:30 AM
After a nice bounce at 2733.04, SPX has closed this morning’s gap — likely running out of steam here as ES backtests the purple TL.
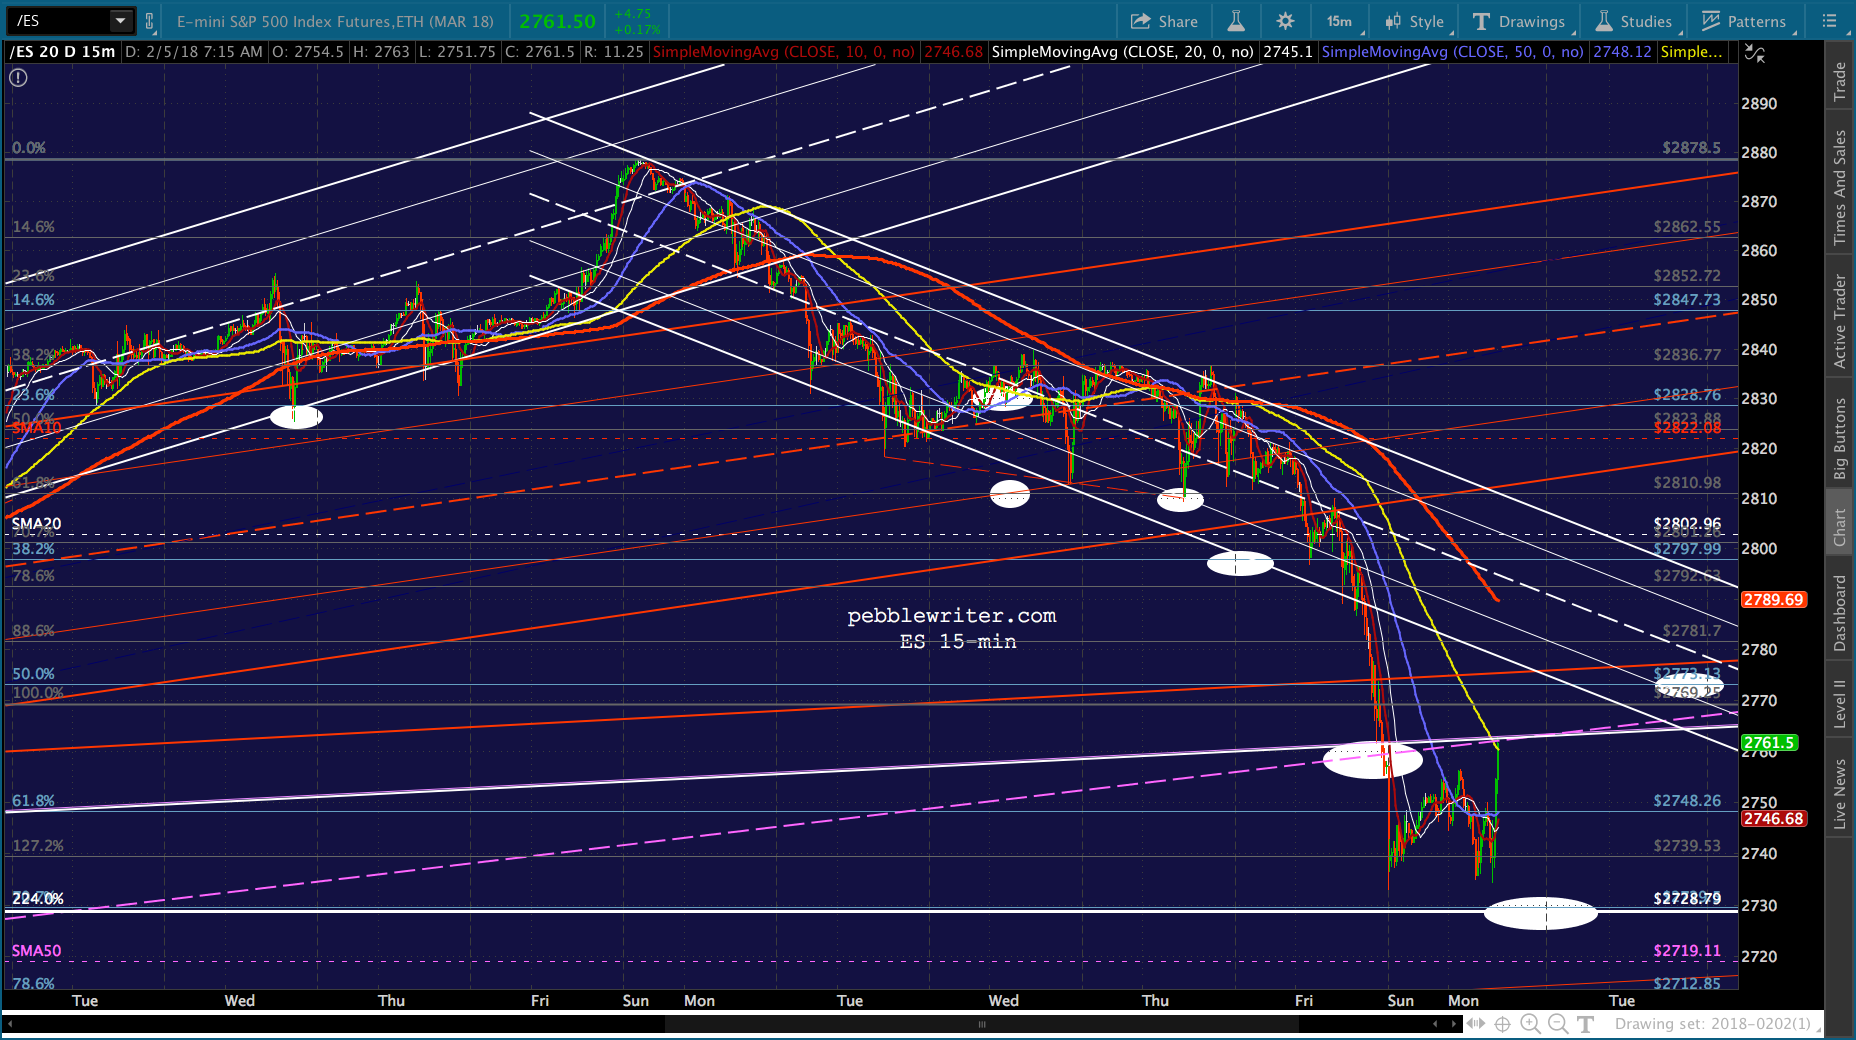 UPDATE: 12:30 PM
The backtest is working nicely, with ES coming within 4 points of its 2.24. Note that I’ve adjusted SPX’s equivalent target to 2730.
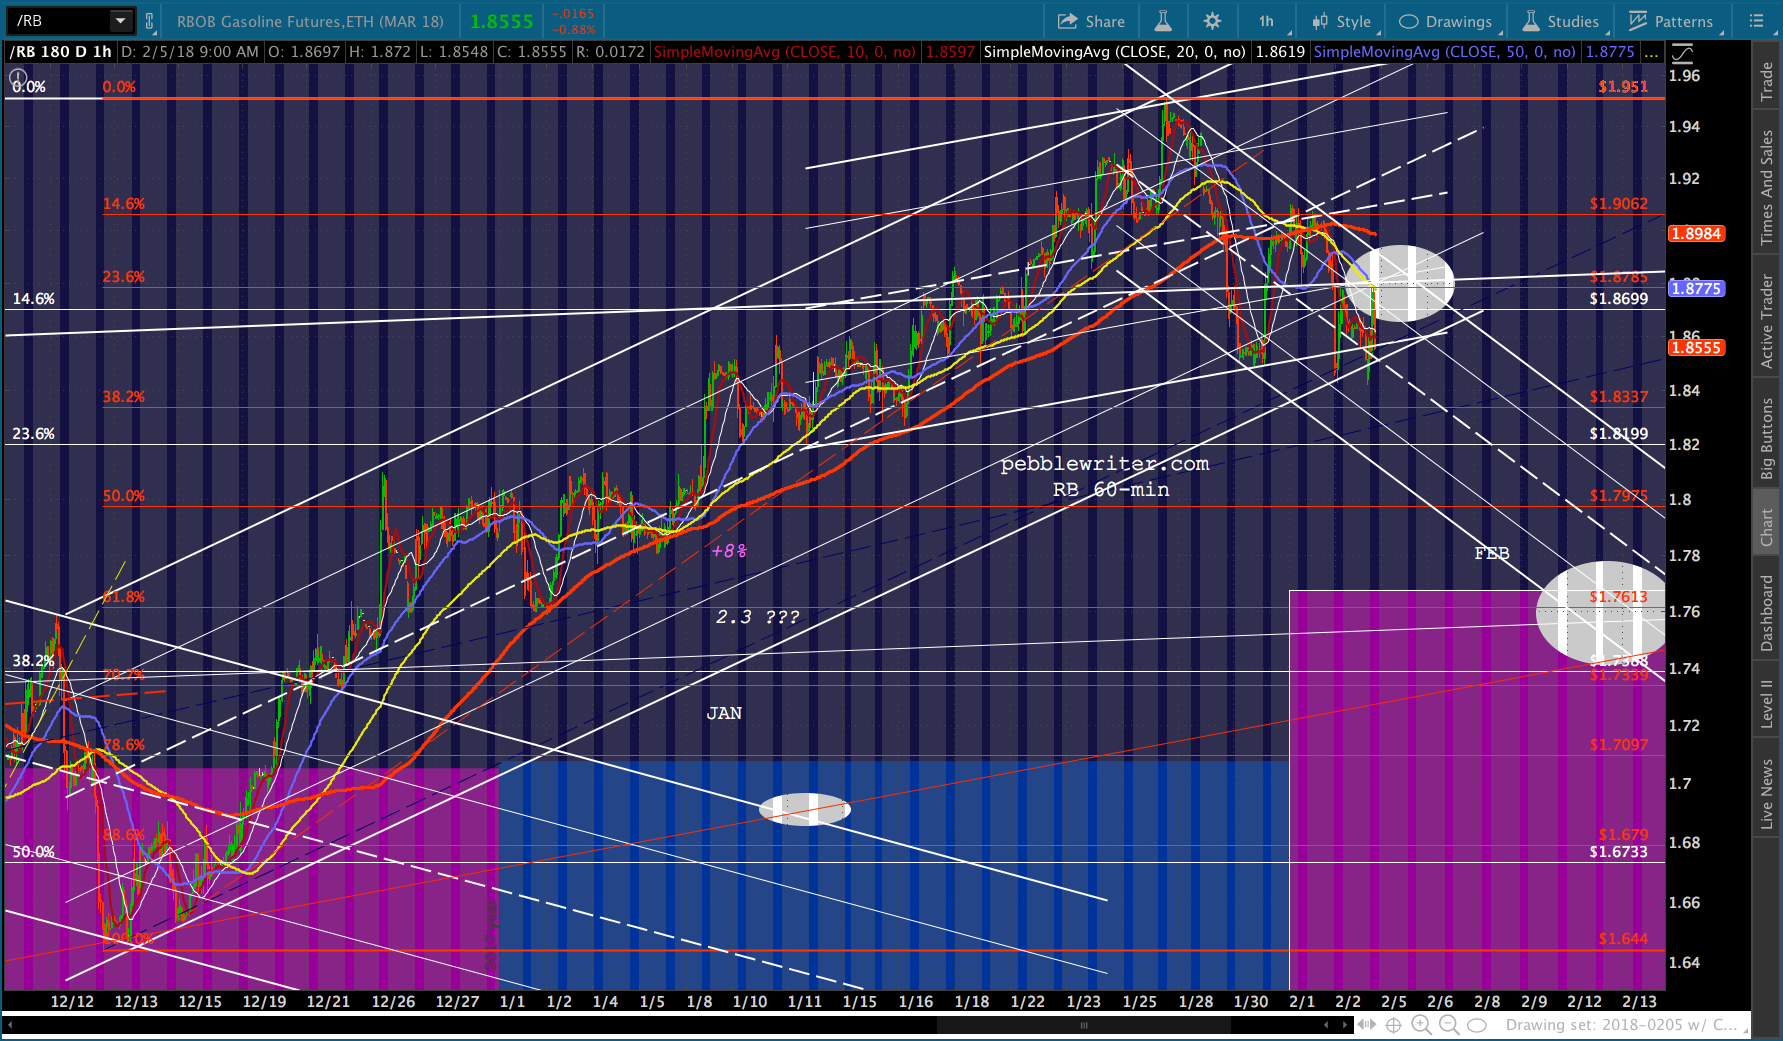
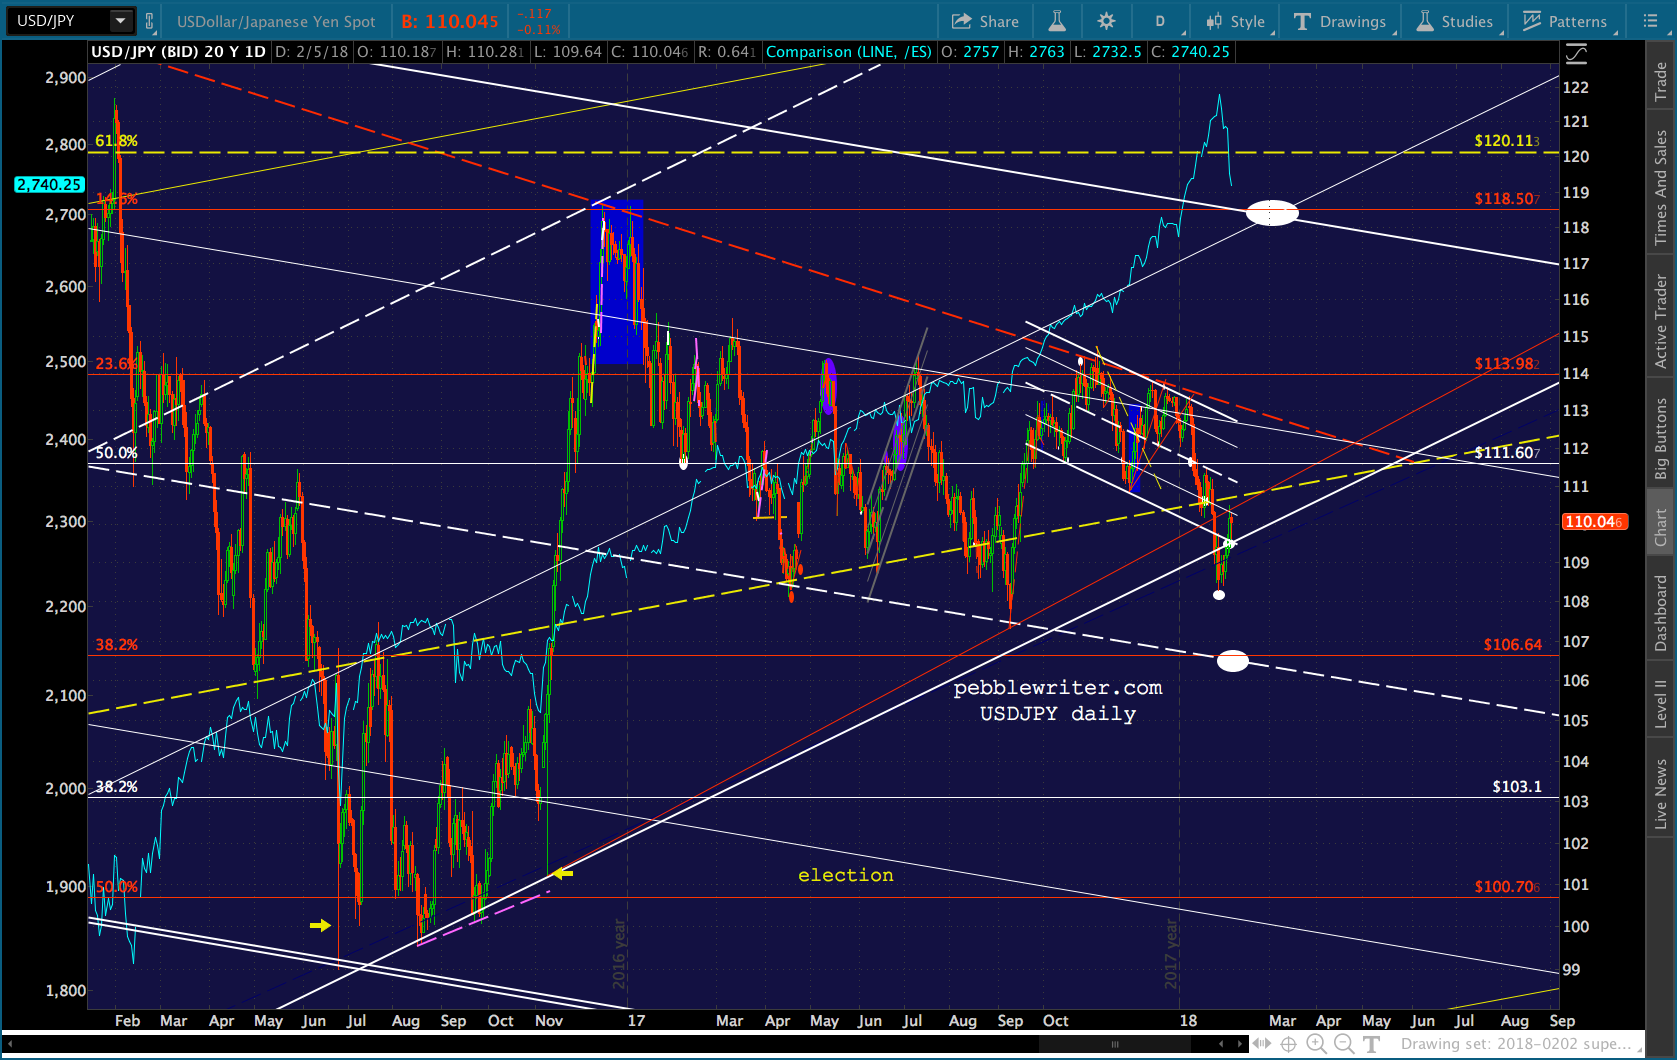
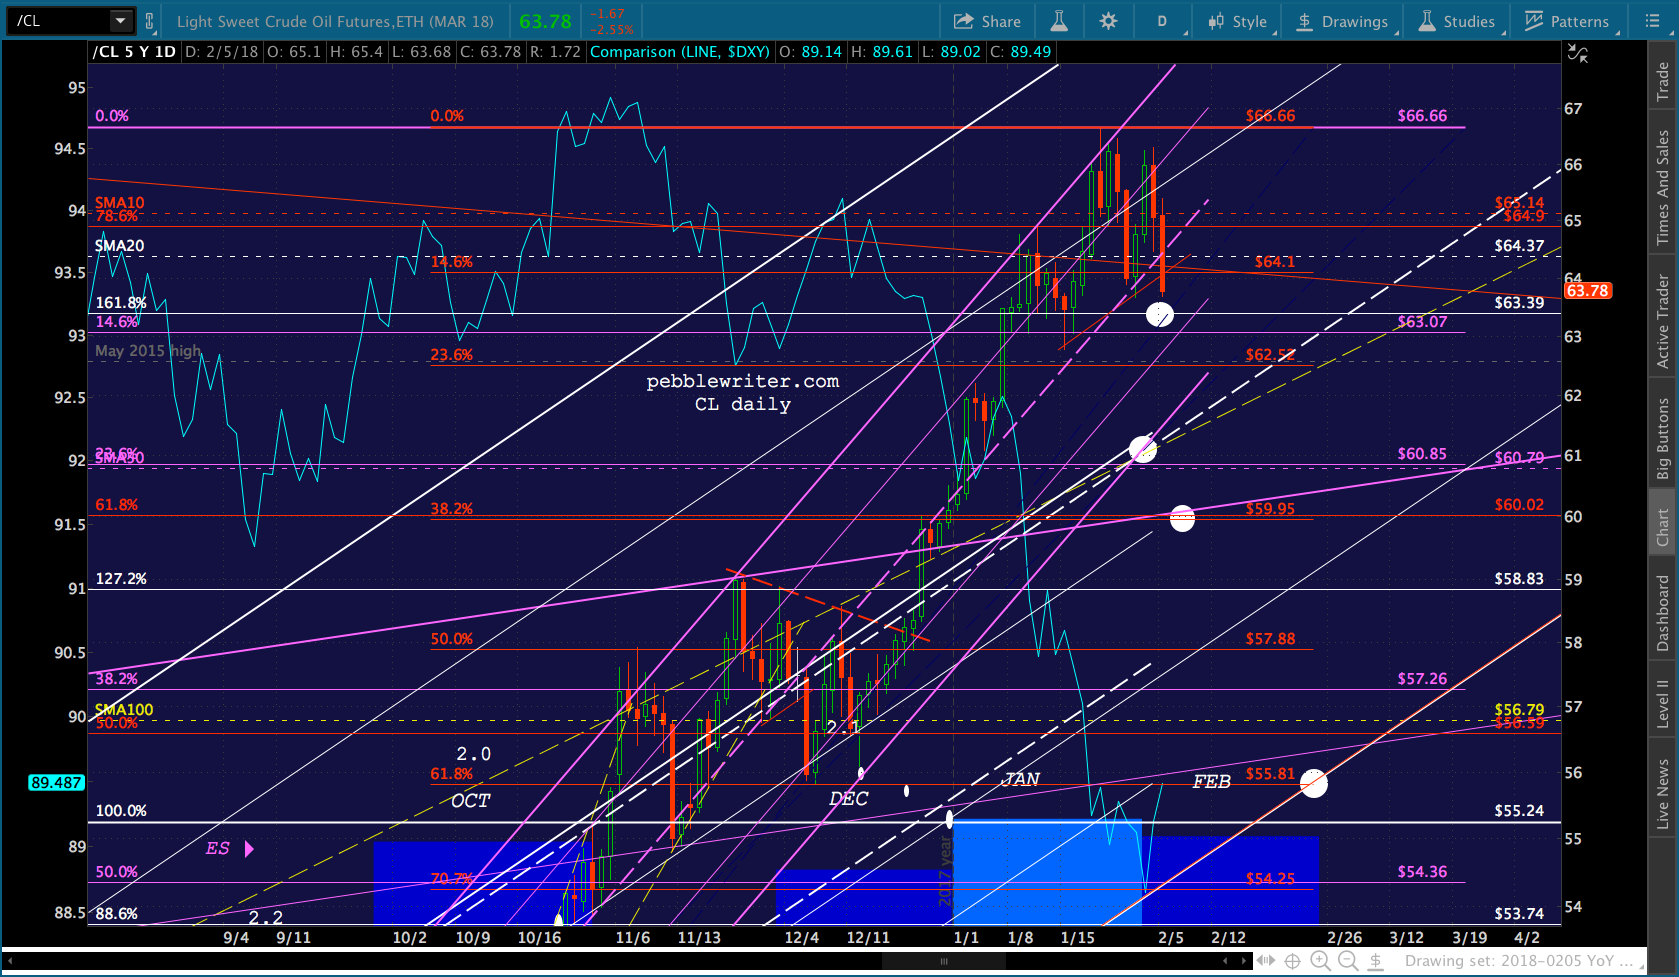
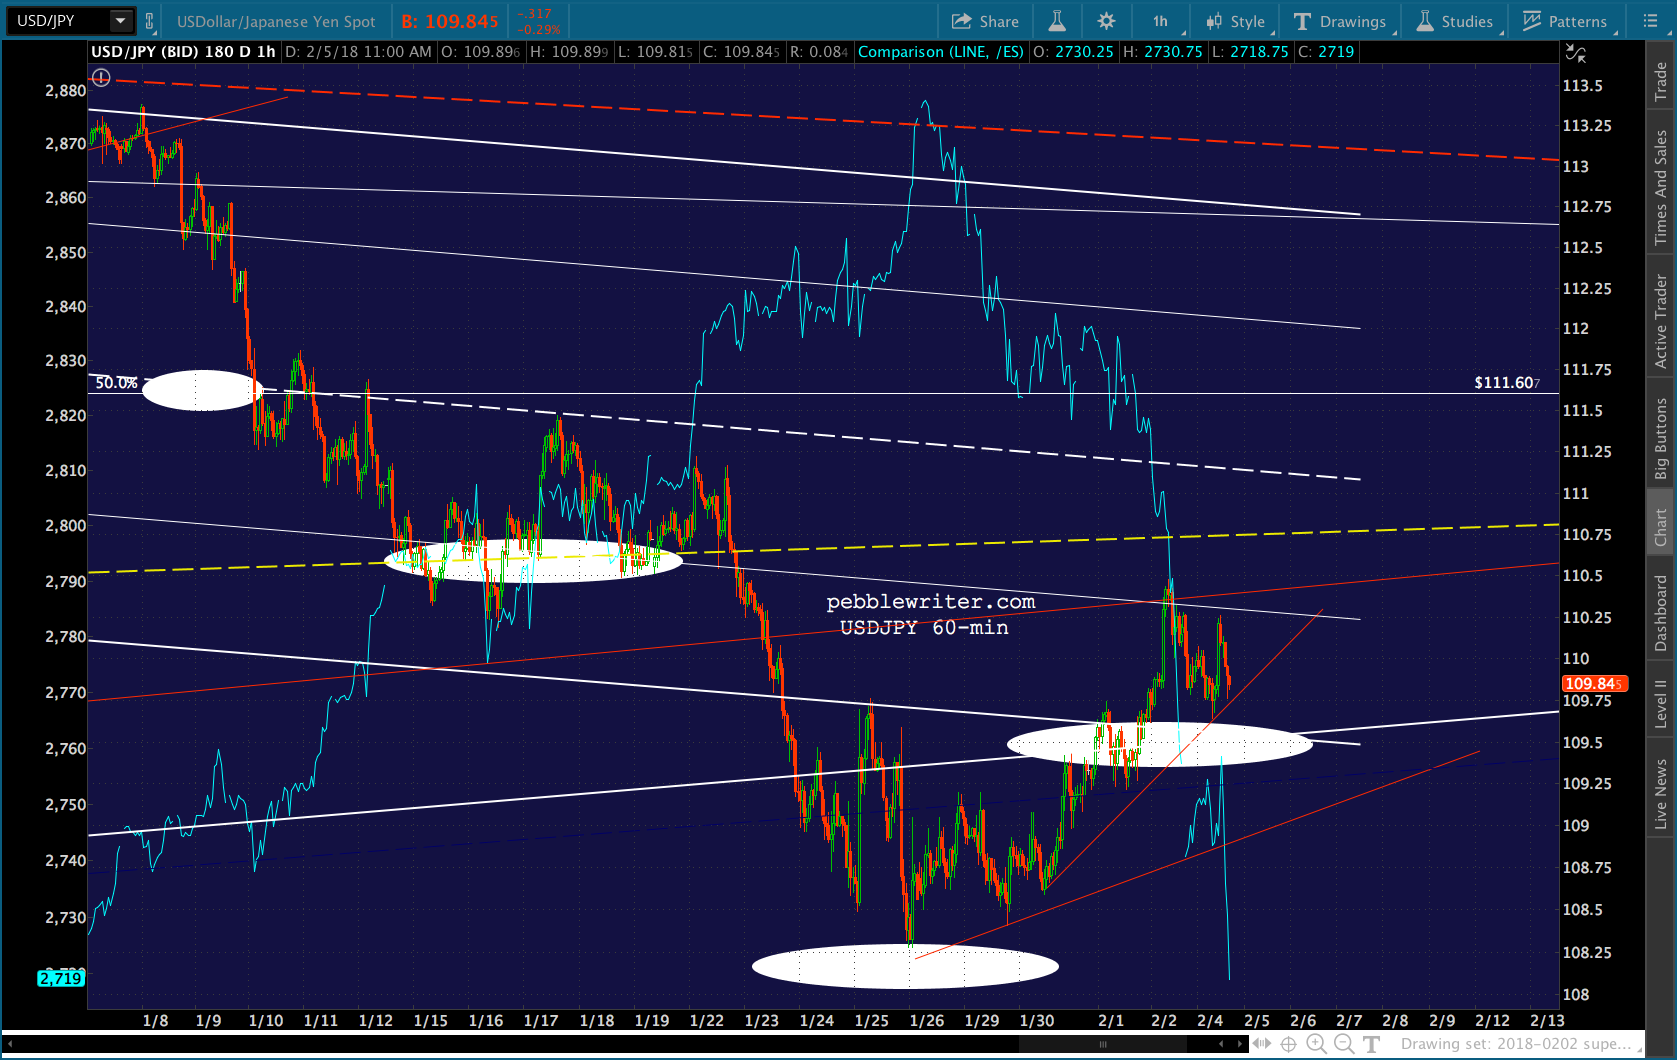
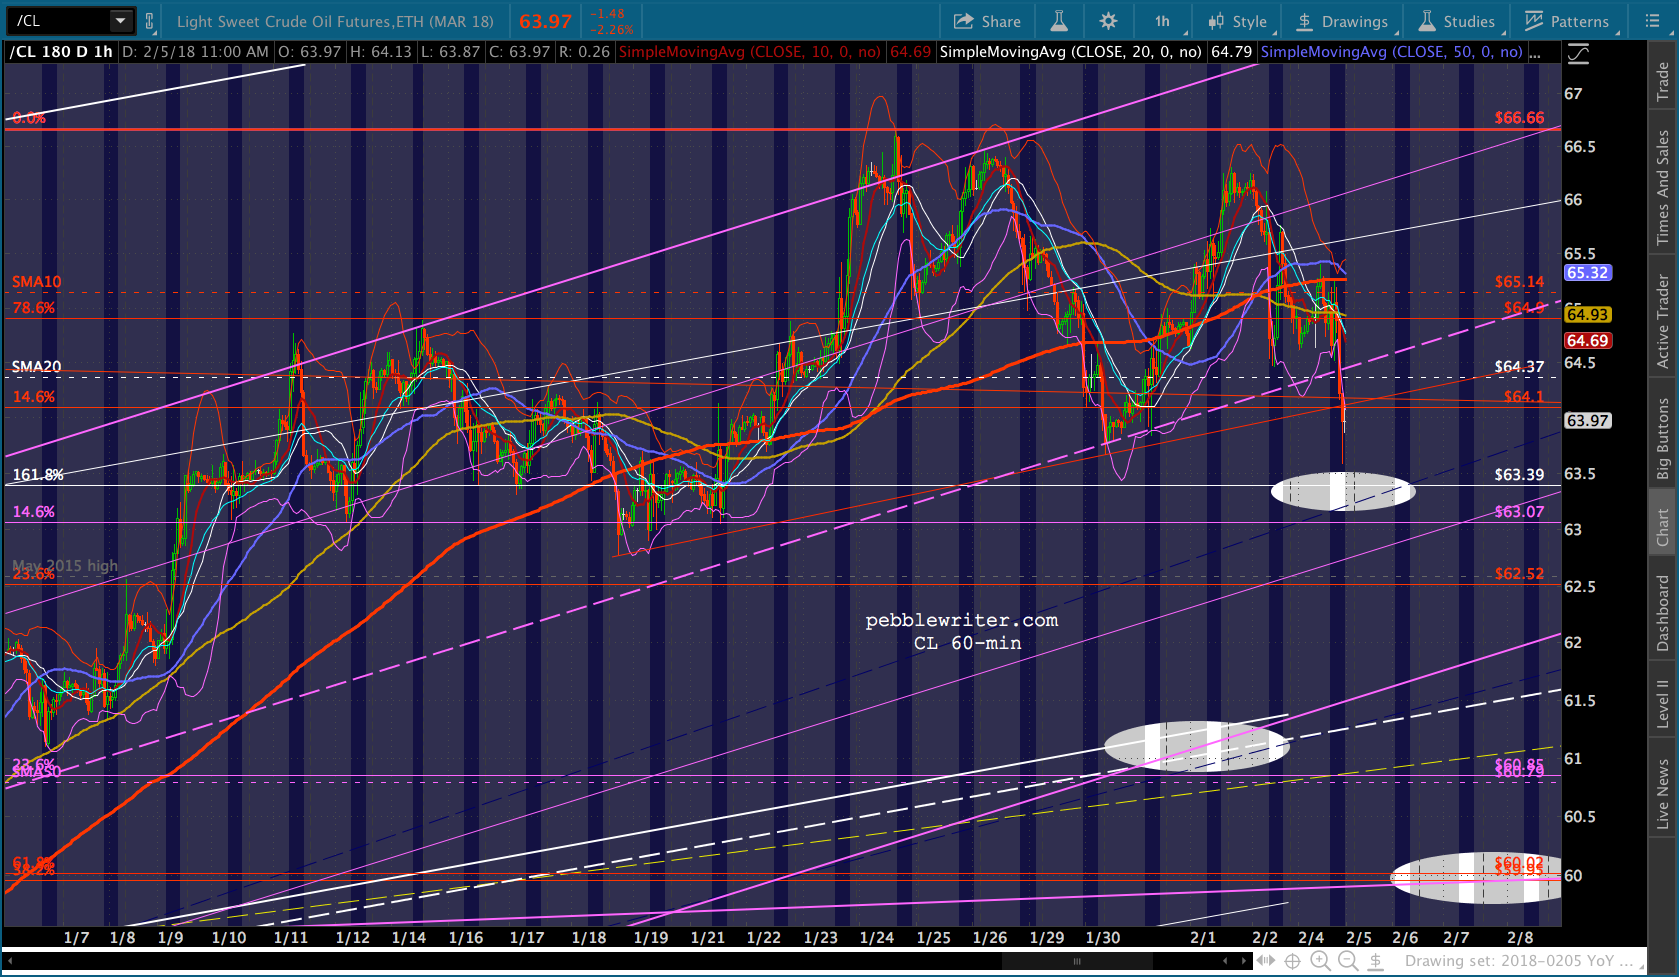
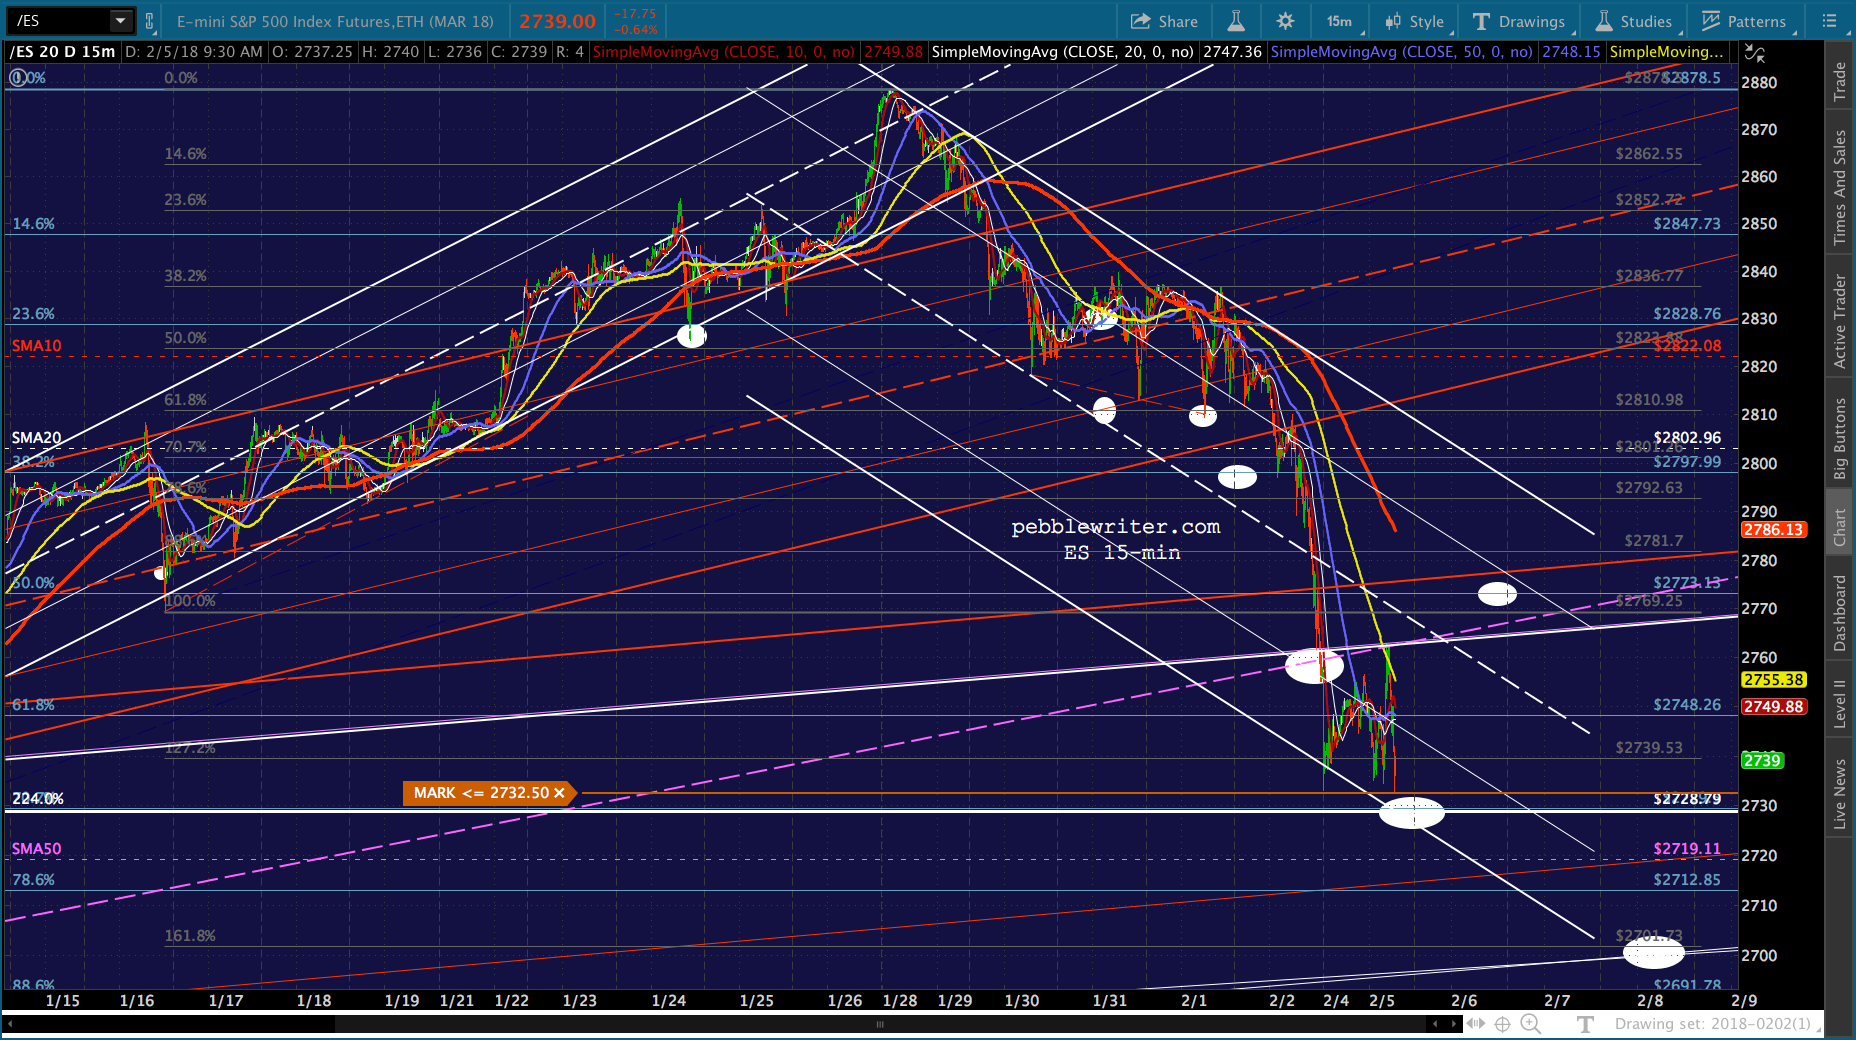 ES is resisting the tag, meaning it’ll probably take some persuading. Best candidates are CL, USDJPY and VIX. Look for CL to tag our next downside target — the 1.618 at 63.39.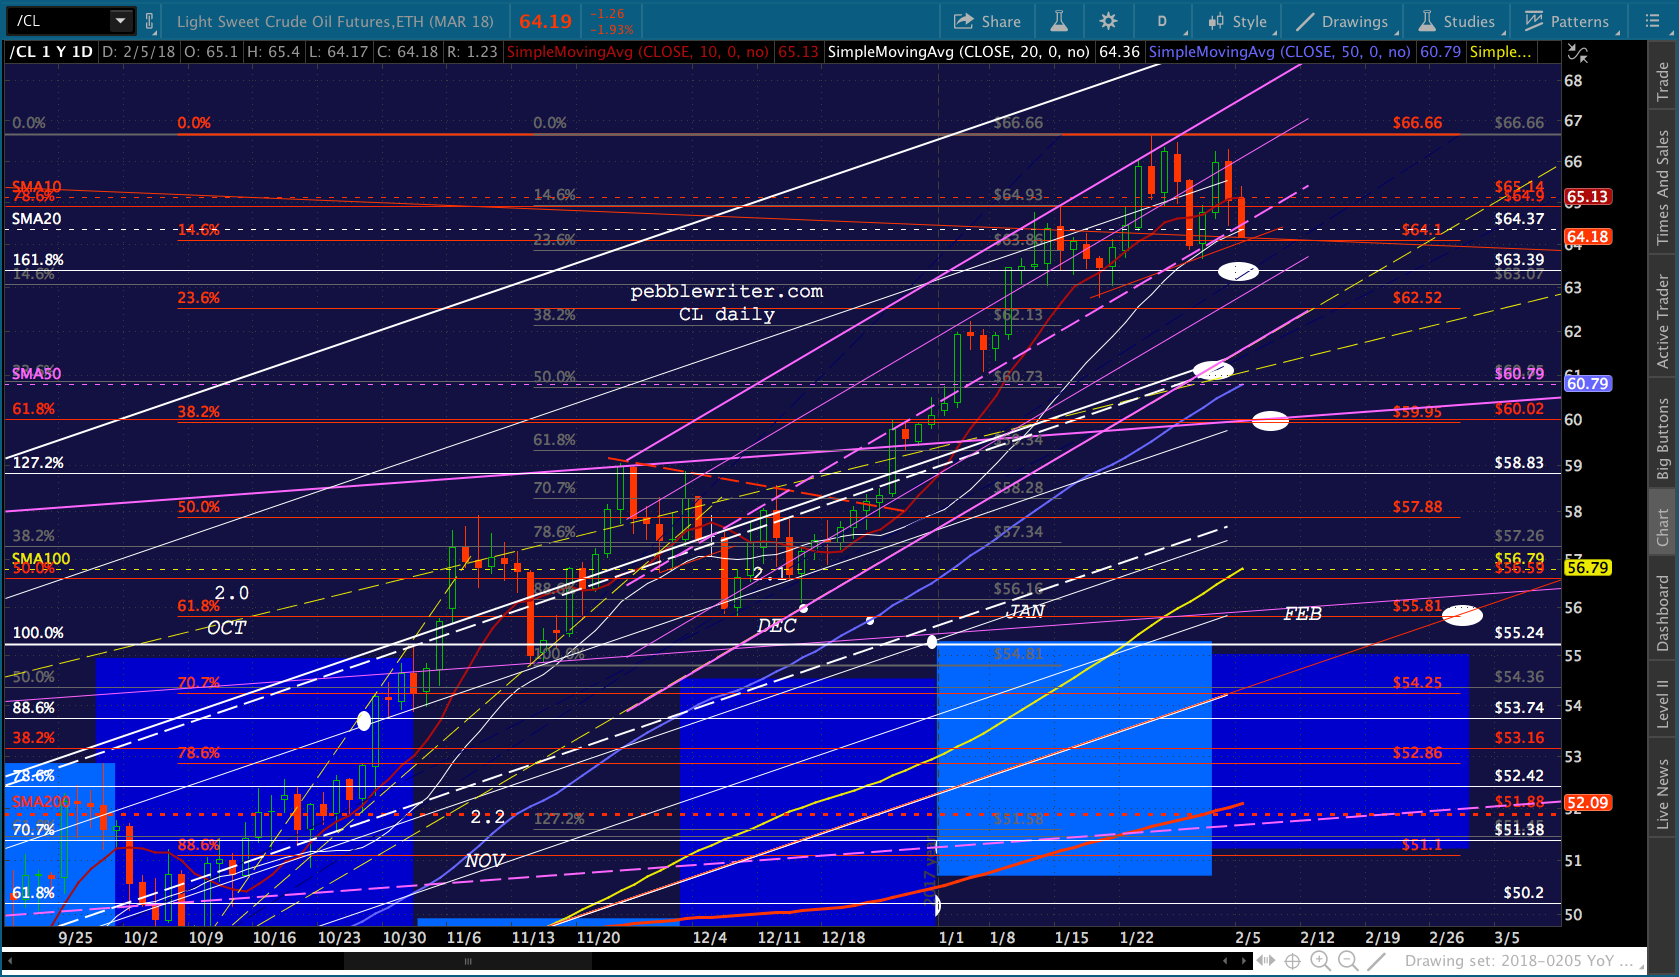
 I’m working on an update for VIX, but suffice it to say the huge falling white channel is the key driver following last week’s breakout. Note that, so far, it’s a repeat of the 1998-2008 one — suggesting upside targets of 36-40.
 UPDATE: 1:04 PM
ES just tagged its 2.24 and is slipping a little lower — meaning SPX is overshooting 2730. Watching carefully for signs of a bounce — don’t see it yet. Looking more like they’ll just let it drop.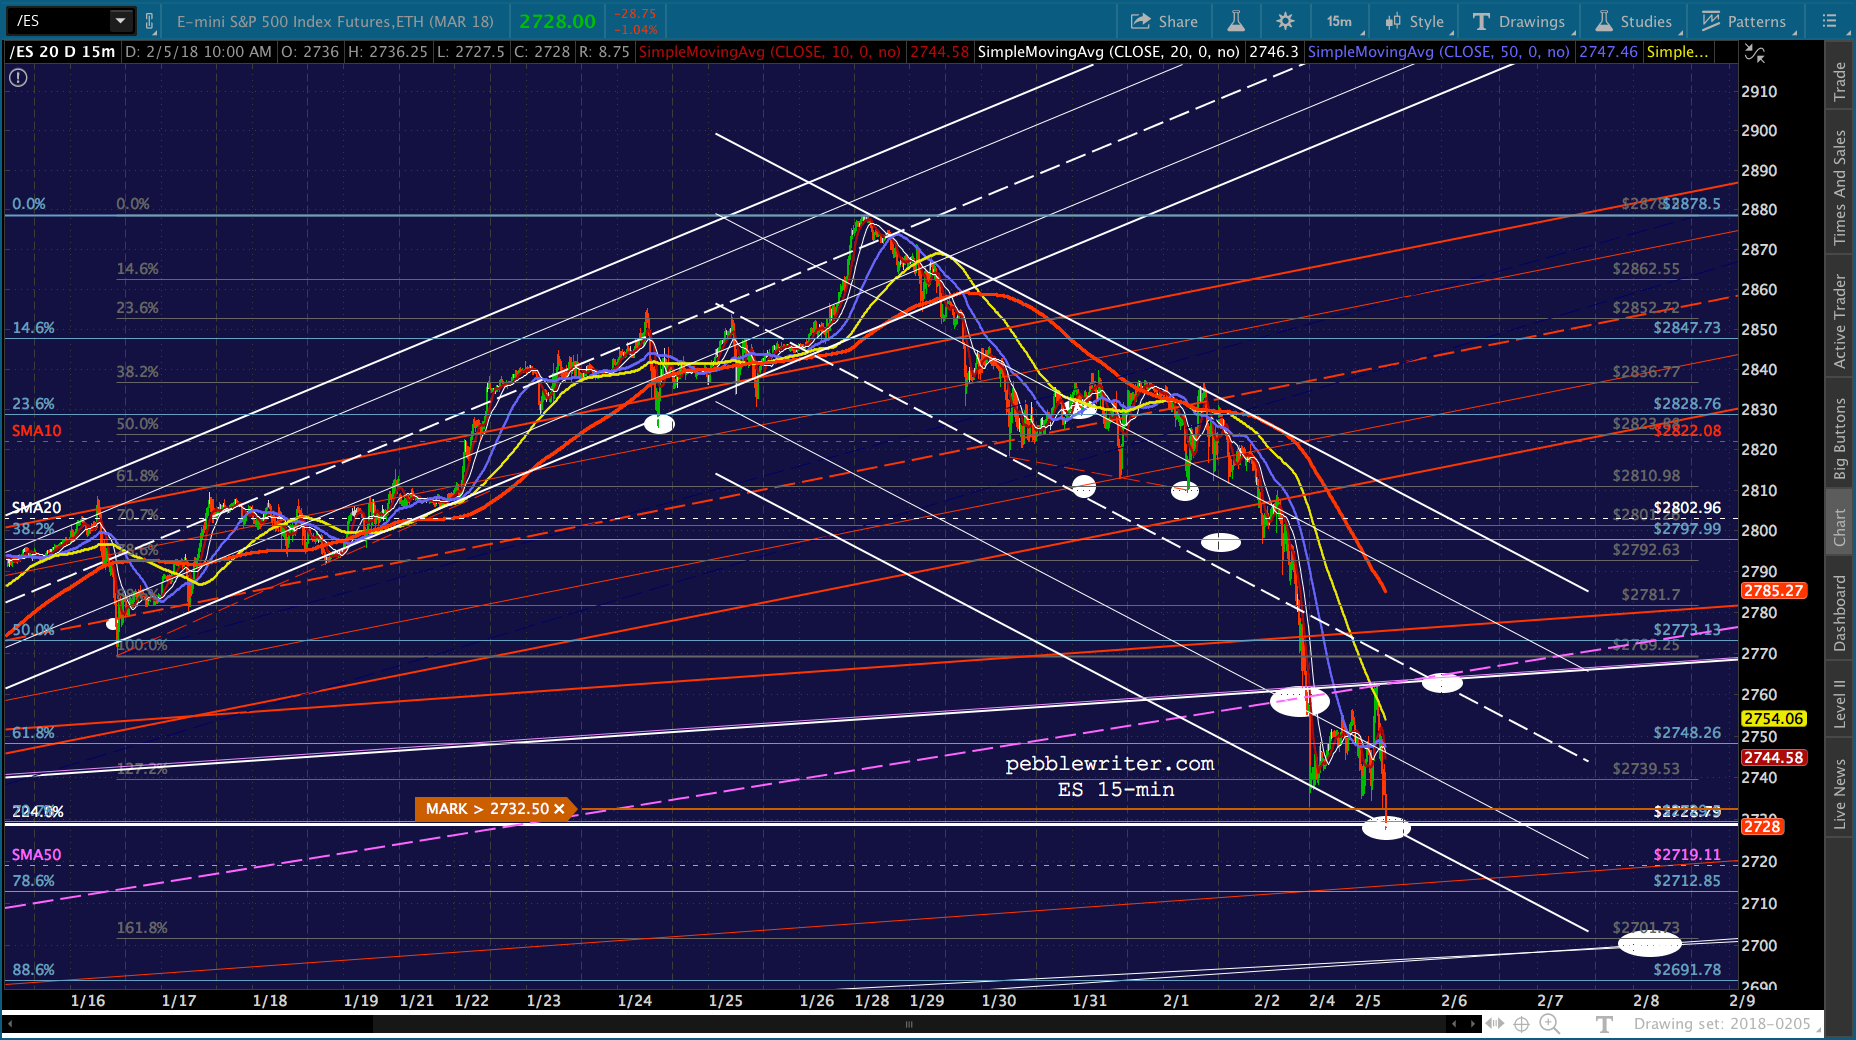
 New VIX path suggests 25.65 or wherever the channel top is when SPX reaches 2703.62. Purple 1.618 at 22.67 is another decent possibility. Not as great a channel fit, but we’ll see where it is if/when SPX reaches 2703.62.
 If they want to push it on down there, all it would take is to break this little TL on USDJPY…
 …and, let CL reach (or dip below) 63.39.
 Speaking of 2703…should we go long there? I think so. I’d be pretty surprised if they let it fall. Likewise, I’d want to be long CL and USDJPY and short VIX wherever they happen to be at the time. Just be ready to switch back to short in a jiffy if SPX drops through it. The next stop isn’t until the SMA100 at 2633, followed by the SMA200 at 2533.
Note that RUT is also closing in on a nice backtest of the 1.618 at 1514.09 — in addition to being a channel bottom. I’d want to be long RUT at this level, assuming SPX catches support at 2700-2703.62. If it doesn’t, RUT has potential to 1493.70 and the white or yellow channel tops at 1479 and 1472ish. Of course, the SMA200 is at 1460.61, so we shouldn’t ignore that.
UPDATE: 2:15 PM
Quick update…I have to run out for 30 minutes, will be back asap. Coming up on those targets…should be a very strong bounce. If not, all hell could break loose.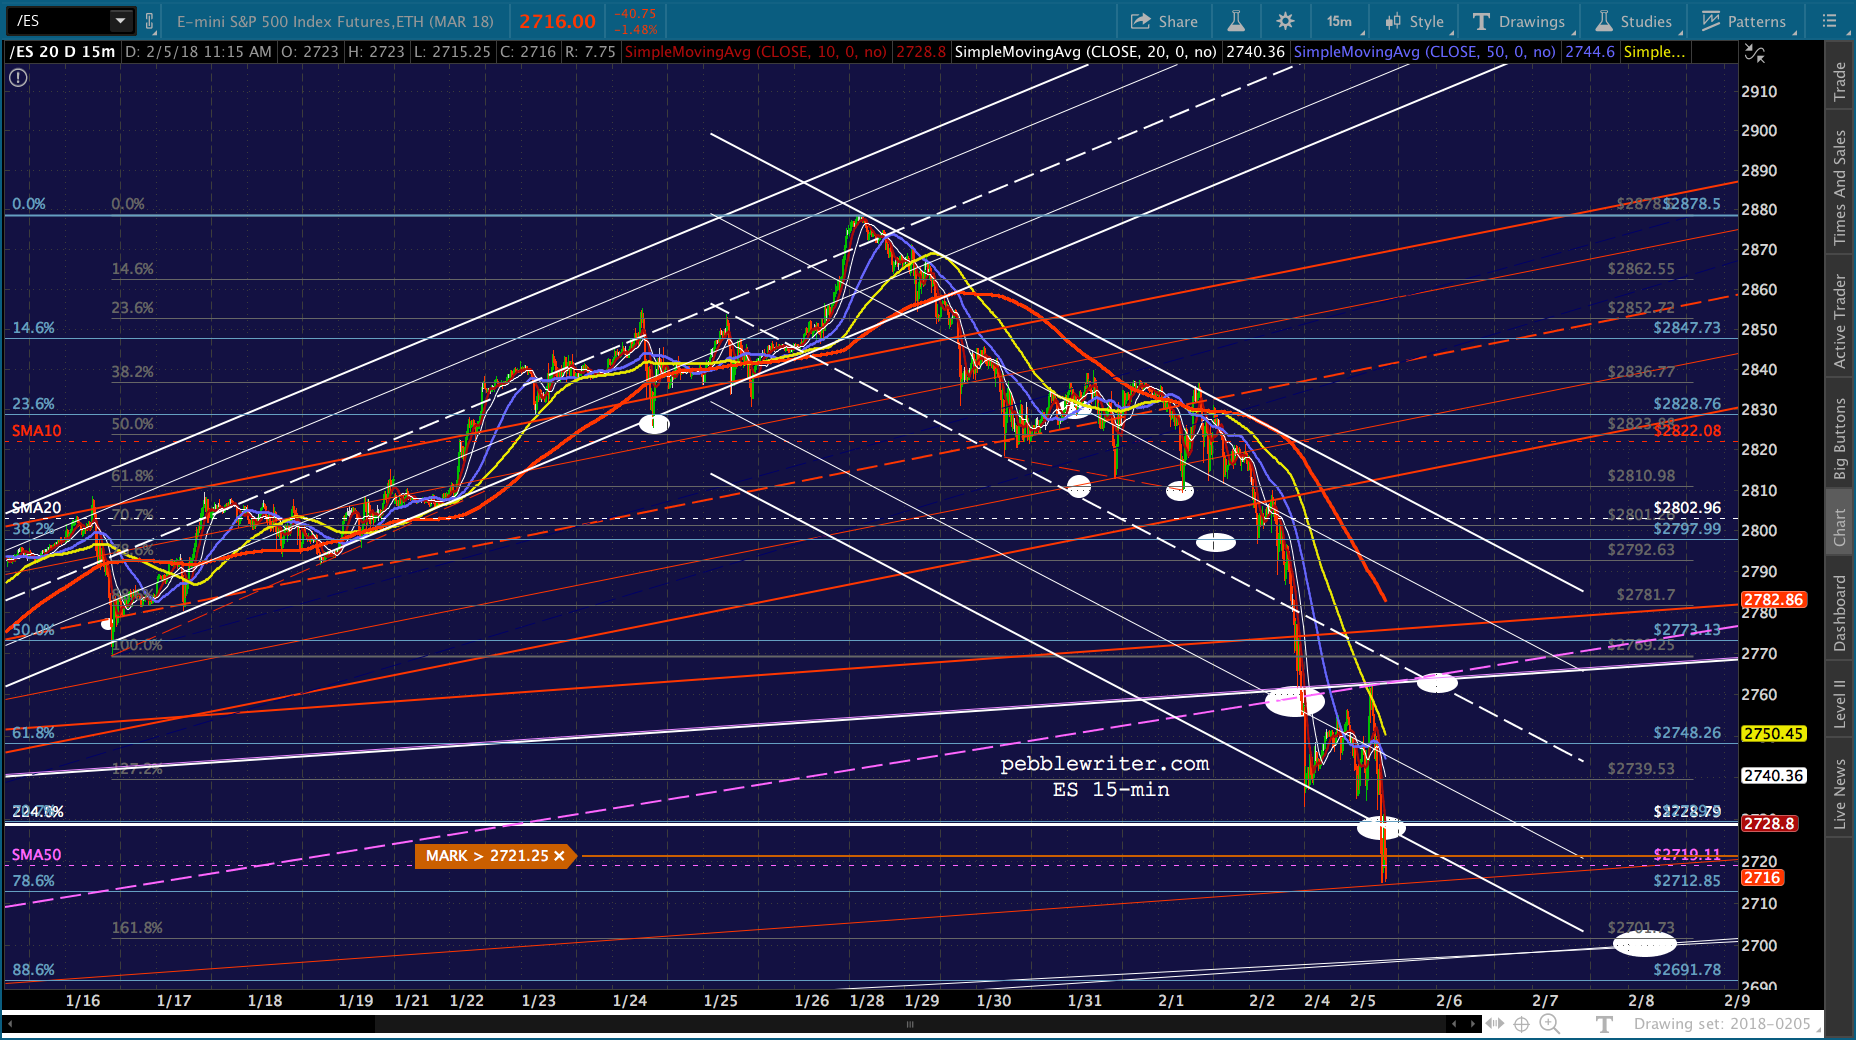

 UPDATE: 2:58 PM
That’s good enough for me. SPX, ES and RUT should bounce, VIX should slide, and USDJPY should rally. Pick your poison, use stops. 


 Judging from the price of the VIX puts, I’m not the only one looking for a bounce here.
UPDATE: 3:10 PM
Uh-oh…not done yet.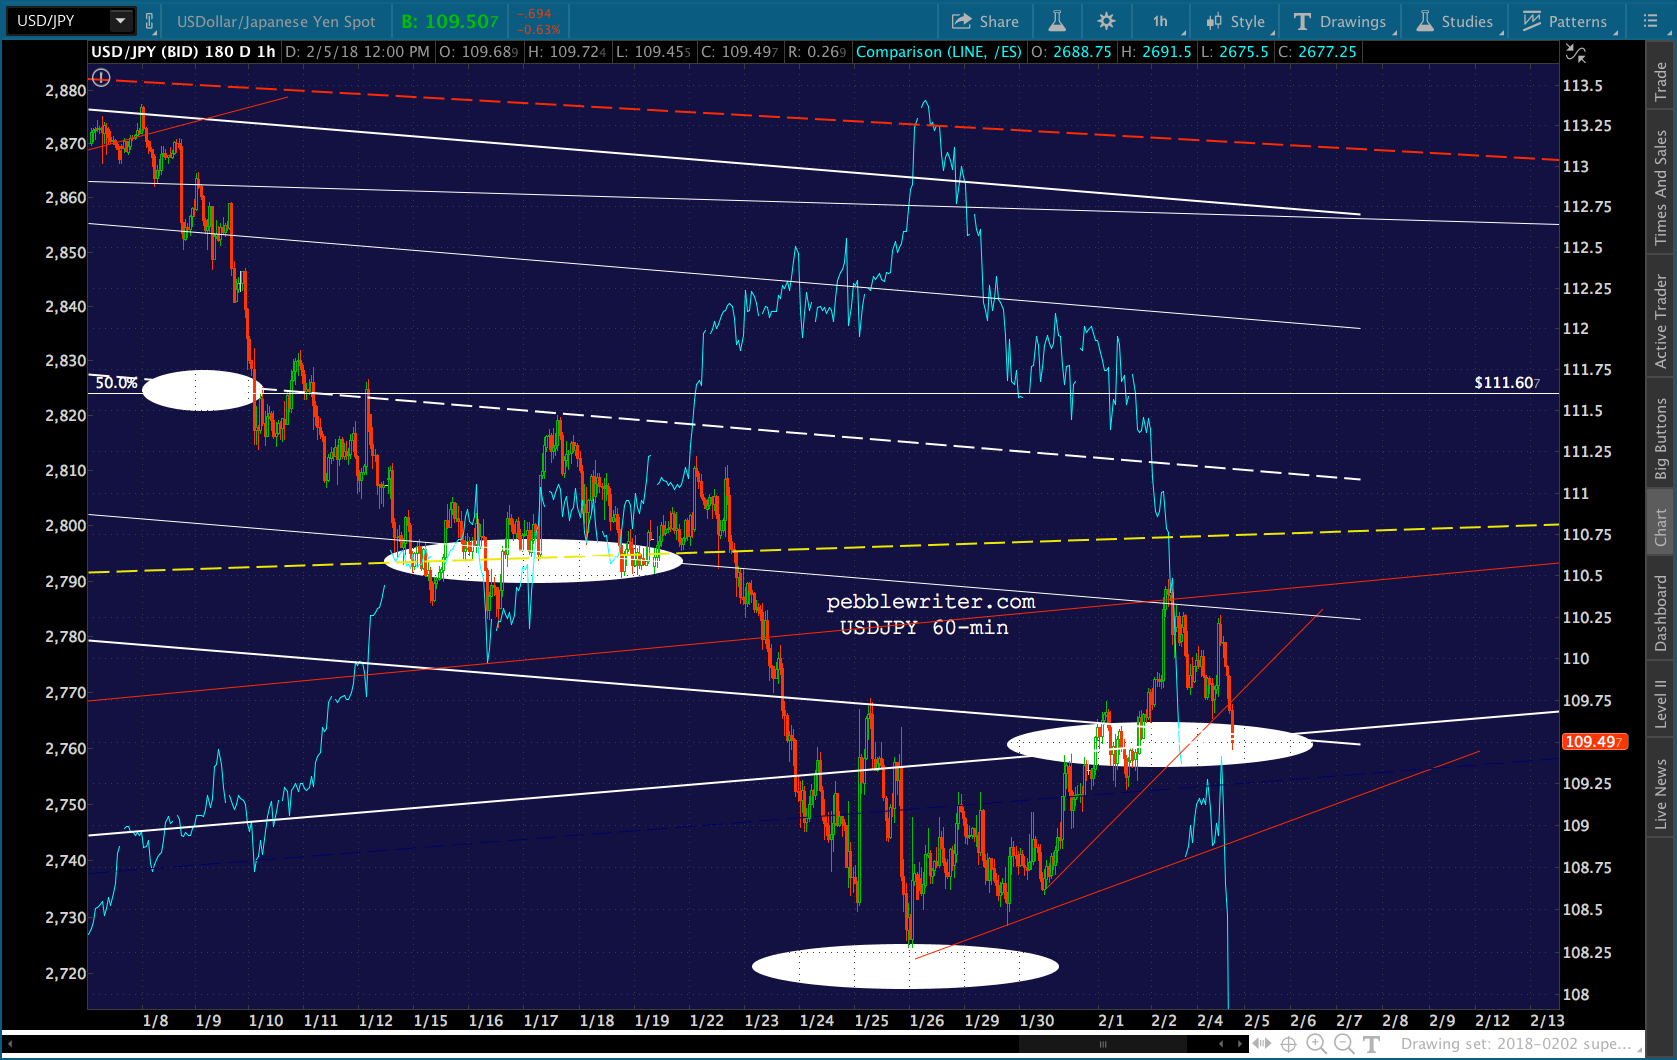 Next support is ES 2634.11 (SMA100 and midline) and SPX 2640 (channel bottom, SMA100at 2633) and VIX 36.20 (.618.)
UPDATE: 3:15 PM
That should do it. Back to long on stocks, short on VIX.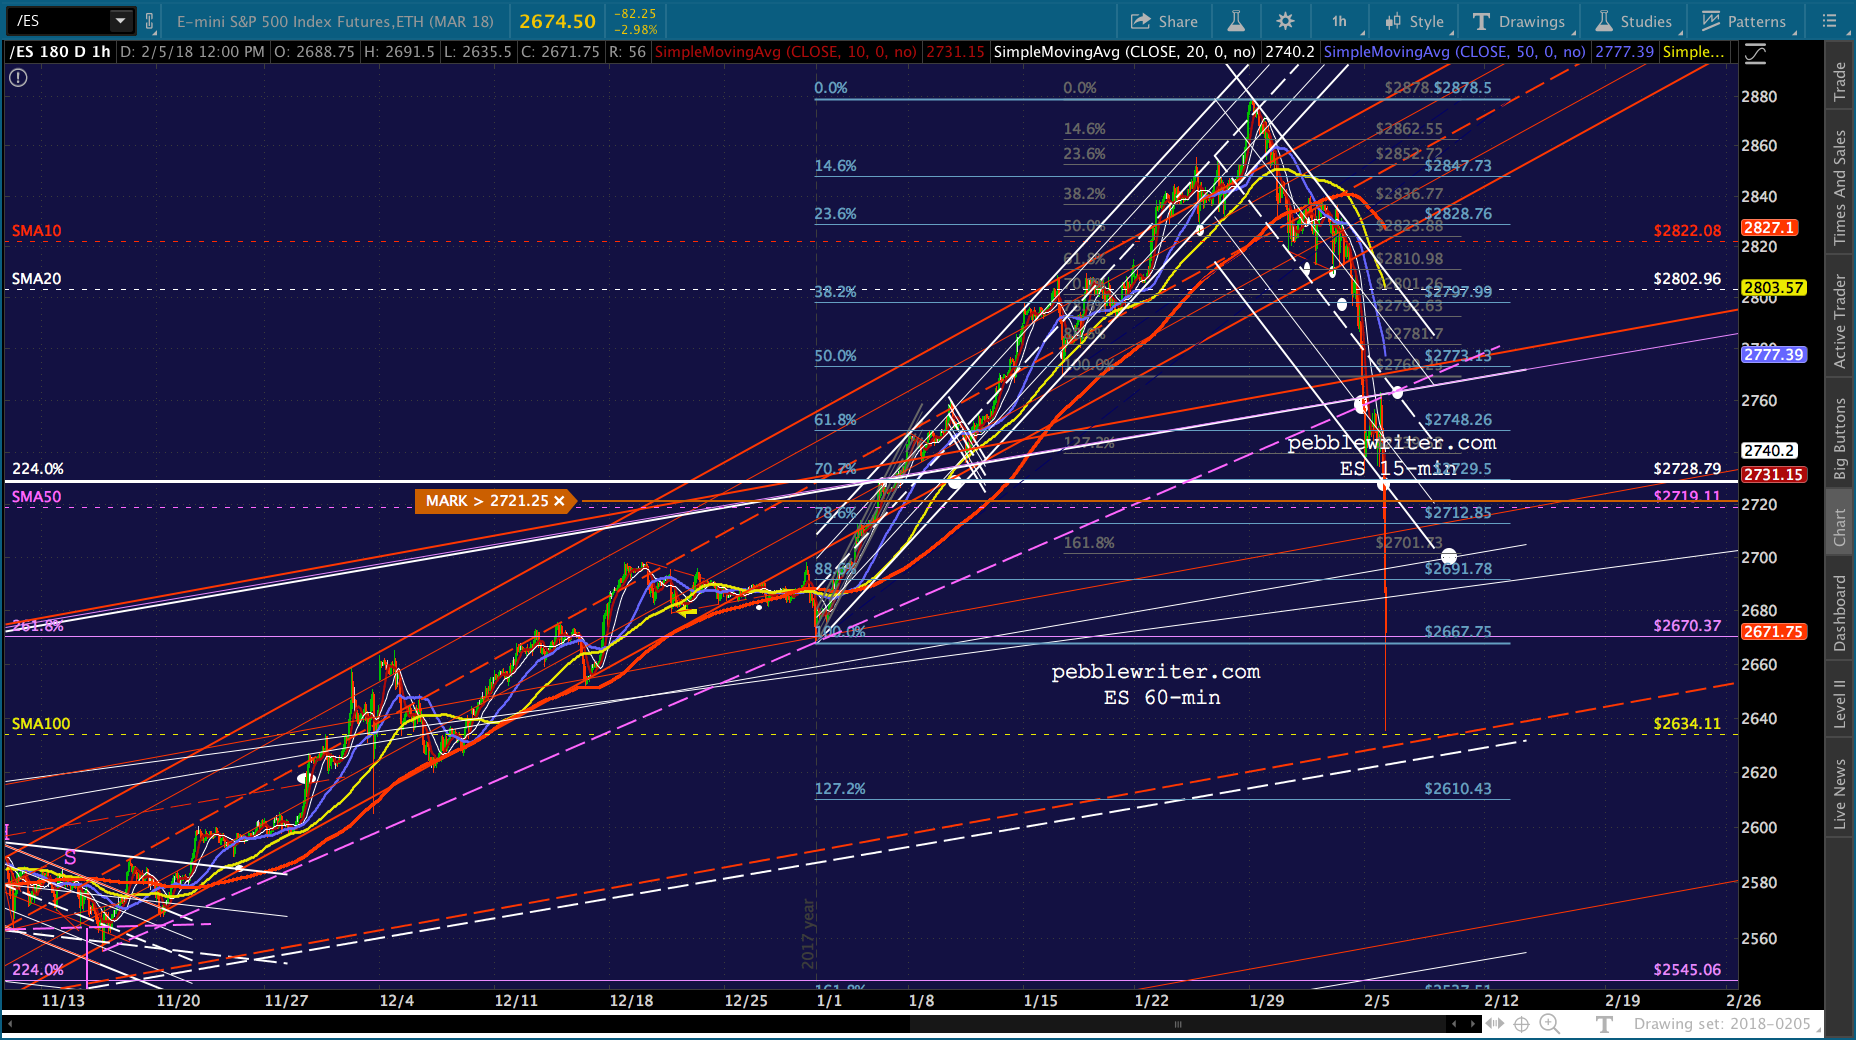

 I have to jump on a call, will be back before the close.
UPDATE: 3:50 PM
Why today’s lows are absolutely vital to the bulls:
SPX is obviously at the bottom of the rising white channel — score one for the bulls. However, it has given up the 2.24. If it can’t pop back above (as it did the 1.618 multiple times in 2016, then the next major support is the 1.618 itself: 2138. This would be an additional 19%, a total of 25.5% off the top.

I haven’t talked about it lately, but note that gray dashed line connecting the 2002 lows, the 2011 highs, and the 2016 lows. It runs through the 1.618 at 2138 in April of this year — right where the purple channel .238 line is.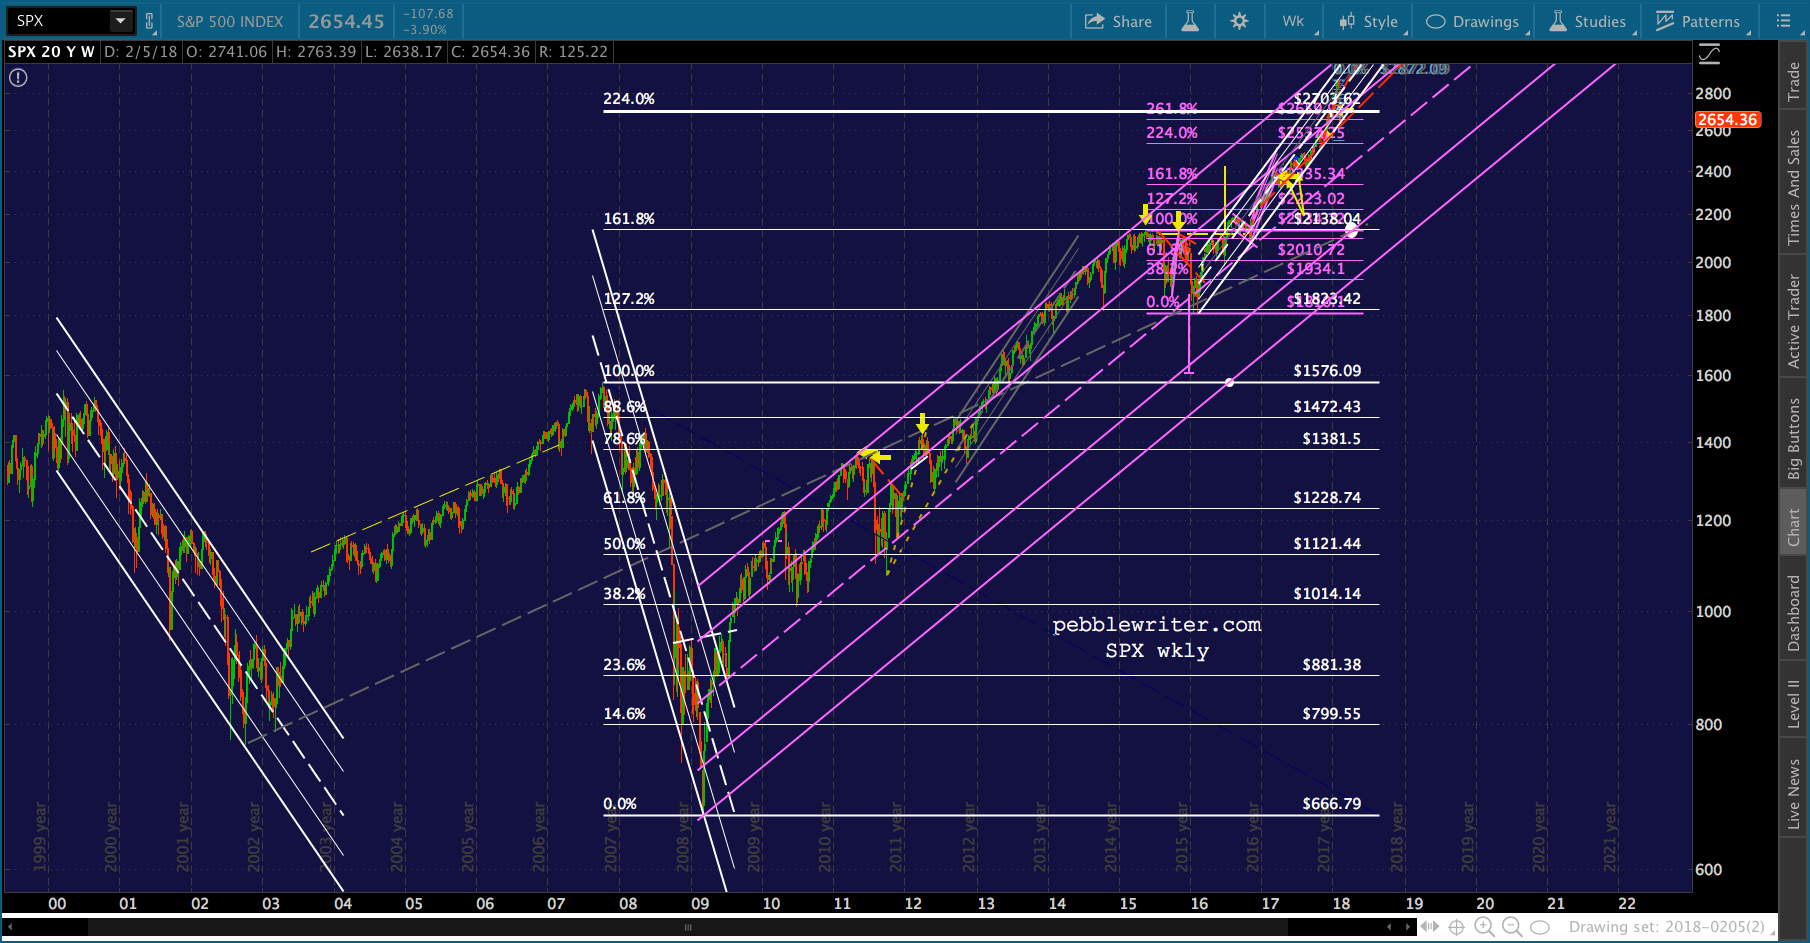
 No surprise to members that I’ve always considered the backtest of the 1.618 to be bullshit. SPX was toast going into the election, and would have dropped much more severely if USDJPY hadn’t spiked nearly 20%, CL spiked 27% and VIX collapsed below a long-term channel bottom.
Bottom line: unless some or all of those things repeat the effort they made to prop up stocks in Nov-Dec 2016, SPX could easily continue down to 2138. I’m cynical enough to believe TPTB will pull something out of their collective arses and get this thing back on track before tomorrow morning. But, if they don’t, get ready for some very ugly knock-on.