Tag: Inverse H&S

  • Charts I’m Watching: Jul 7, 2022

    Futures ramped higher overnight on yet another drubbing of VIX.

    It has all the hallmarks of a headfake, however, so caution is warranted for those following along – particularly if VIX holds 26.  Our analog continues to suggest much lower prices in the weeks ahead.

    continued for members(more…)

  • Gold: Anatomy of a Rat’s Nest Chart

    Once in a while, charts are so crystal clear that we can see the future as easily as we can reflect on the past. Gold is not one of those charts. The zigs and zags come fast and furious and rarely correlate with anything happening in the real world. Witness the indifference this so-called inflation hedge has shown toward the highest inflation in 13 years.

    But, the charts have pointed out some excellent trading opportunities along the way – usually by highlighting trend changes (or continuation patterns) that offer strong directional hints.

    I thought it might be interesting to reflect on the use of channels. What do they tell us, and how can we use them to guide our trading?

    By the time we layer in all the trend lines, Fibonacci levels, moving averages, etc. charts can start to take on a rat’s nest look.

    But, if we strip away some of those things, the channels tell a very compelling story. GC’s long-term chart, for instance, starts with a long, pretty well-formed channel. It did a reasonably good job of guiding prices from the late 1990s until 2014.

    When it broke down in late 2014, it was a clear signal that the long-term trend had given up the ghost.

    We can see that the breakdown followed a pretty clear trend lower, marked by the red channel below. When GC rallied out of that falling red channel – a clear buy signal – we were able to construct a less bearish falling purple channel that guided prices for several more years. When GC reached the bottom of that channel, it accurately signaled a good buying opportunity. That signaled was reinforced when, in 2019, GC broke out of it. Once a few parallel highs and lows were established, we had a rising channel once again. But, GC broke out of that rising channel, requiring a more aggressive one. We added the rising purple channel to accommodate it……and expanded the red channel to make room for the new highs.Although it’s a little early to say with any certainty, the rising purple channel is threatening to break down. It obviously sets up a backtest of the rising red channel’s midline (the dashed red line.) If the two of them are breached, it would be a very bearish signal – particularly in light of the drop through the 200-DMA.

    Put it all together, throw in some trend lines and other chart patterns, and we get a pretty clear picture that GC is on the verge of a breakdown. The chart doesn’t necessarily tell us which way it will ultimately go, just that we’re at an important juncture – very useful information indeed.The factors have been busy overnight, seemingly in quarter-end mode to prompt a bullish run for the barn. Will it be enough?continued for members(more…)

  • Why Bonds Are Still Important

    I had an great question yesterday regarding the bond market: “Is it possible the fear of pandemic in spring 2020 affected the behavior of 2yr and 10 yr and then indirectly triggered the crash?”

    Pebblewriter longhaulers will recall that our bond cycle model forecast a severe plunge in interest rates long before anyone was talking about a pandemic. In August 2019, for example, we were already anticipating a drop to near or below zero around December 2020.It’s what the charts suggested, as we posted in April 2018 [see: Bonds – a Buying Opportunity]…

    …and it’s what was necessary in order to keep America’s books balanced.  Annual debt growth was averaging 5%, and debt:GDP had topped 100% for the past five years.

    As we pointed out in July 2019 [see: Why Interest Rates Must Not Rise] the only way to keep debt service from overwhelming other federal expenses had been to crash interest rates.

    The trick was how to force interest rates lower without alarming us economist types. Past maneuvers had involved adjusting Fed policy (not terribly effective for medium and long-term rates) and forcing inflation lower by forcing oil and gas prices lower as occurred in 2014-2016 and late 2018 (detrimental to stock prices.)

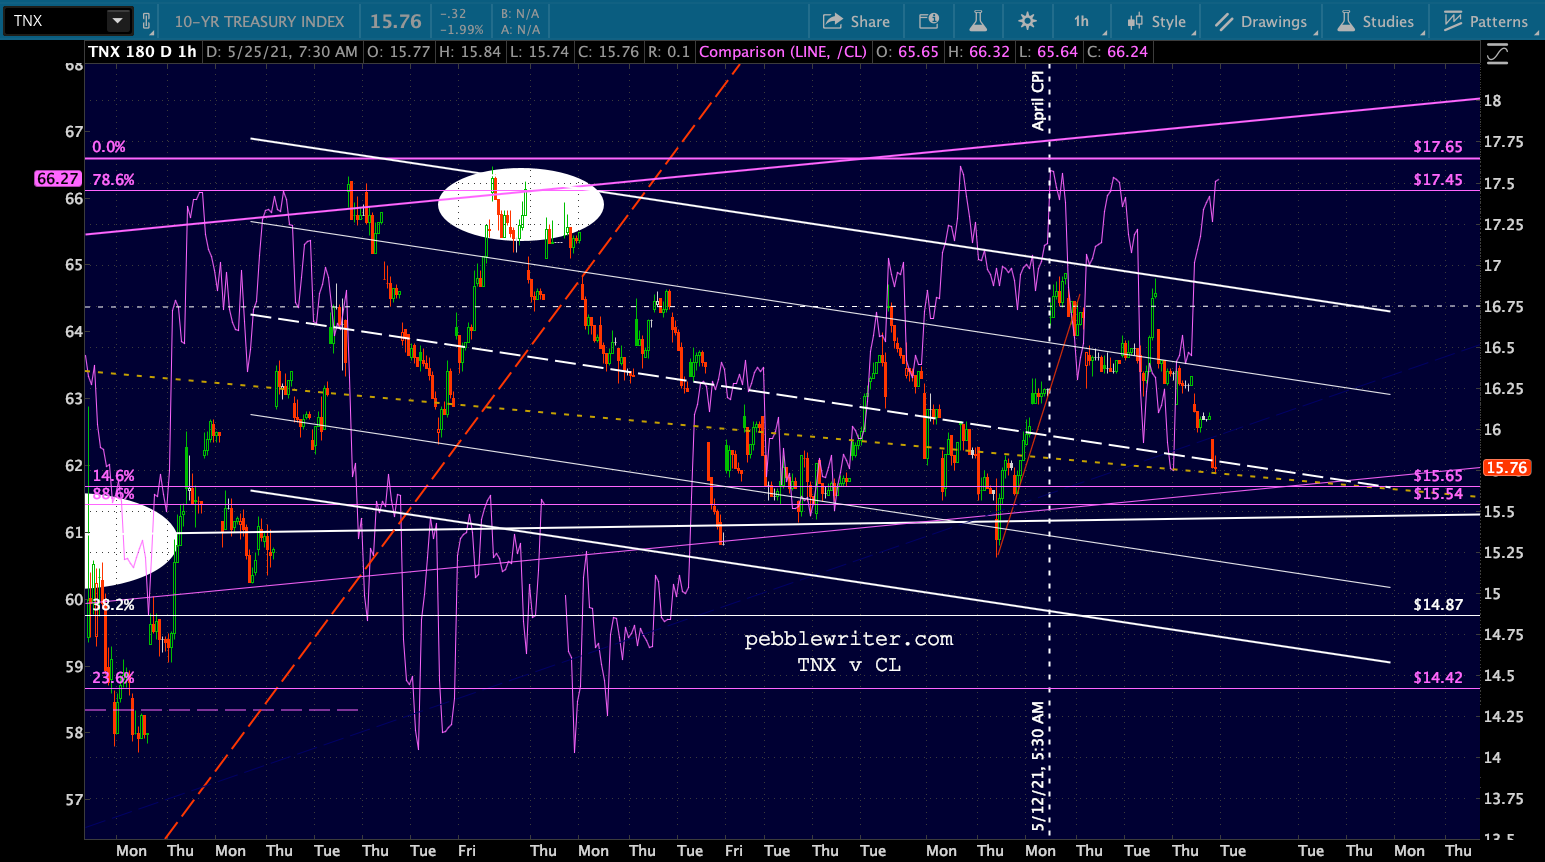
    CPI, which had spent most of 2018 above 2%, had declined to a more manageable 1.7% by September 2019. But, the year-end ramp job in oil prices sent CPI up to a troubling 2.3% by December. The 10Y rose from 1.43% in September to 1.95% in December and, as the chart below shows, threatened to break out.  Something, as they say, had to give.

    As the big brains at the Eccles Building were spitballing potential solutions, the most extreme case of deus ex machina imaginable landed in their laps.  COVID-19 did the Fed a solid – albeit one which went way overboard.

    Oil prices, inflation and the 10Y were suddenly in a race to zero (oil won) and the Fed suddenly faced a slightly bigger problem: how to prevent Armageddon. They needed higher oil prices, interest rates and inflation just to talk equity investors (well, algos) off of window ledges.It worked so spectacularly well that they painted themselves back into a corner very similar to the December 2019 one: rapidly rising inflation and interest rates thanks largely to spiking oil and gas prices – exactly what our models predicted would happen. YoY gas price increases and CPI have been so highly correlated that they are now literally on top of one another.

    For the past few thousand years, this would have been a serious problem.  Everybody knows interest rates spike when inflation spikes. Since the Fed essentially took over the bond market, however, they’ve been able to convince bond investors (well, algos) that spiking inflation isn’t a problem and, even if it is, it’s transitory.

    Want proof? Rates have actually declined since April’s 4.2% CPI print and are nearly back to the same level as before the bomb was dropped.If I walked up to you on a cloudless day and insisted that shaking my rain stick will make it pour, you’d probably double over with laughter. If I had a secret accomplice spray water from a garden hose all over us from an undisclosed location, you might begin to wonder if I was right.

    That’s what’s happening with interest rates right now. Except the rain stick is the Fed’s prognostications and the garden hose is actually a low-flying supertanker carrying 20,000 gallons.

    Of course bond investors care about spiking inflation. But, with the Fed pumping billions of dollars into the bond market every day (more on days with alarming economic data) to force interest rates lower, they can claim that said inflation (“did we mention it’s transitory?”) is obviously not a problem.  And the dopes in the financial press eat it up because, by God, they’re soaking wet.

    Instead of rising, interest rates decline, proving to all (especially the algos) that the Fed must know what they’re talking about or — to us more cynical types — that they’ve completely destroyed the bond market’s price discovery mechanism.

    So, did fear of the pandemic affect bond behavior and, thus, cause the crash? Absolutely – though it’s a bit of a chicken and egg situation. Everything unraveled at about the same time in the mother of all negative feedback loops.

    The irony is that it accomplished what the Fed needed to happen in the bond market — though to excess. The Fed can now use the pandemic as their excuse for the most rapid expansion of monetary supply in history– even as spiraling inflation crushes the disadvantaged whom the Fed claims it’s desperate to help.

    Now, on to the markets.  No surprise, but futures managed to ramp higher again overnight – creating the illusion, at least, that the downside case is off the table. It’s not.

    continuing(more…)

  • There Will be Typos

    It’s a little known fact that if you’re trying to get over the pain of back-to-back knee replacements, you should have rotator cuff surgery. At least that’s what my horoscope said. As a result, my typing skills will be a little off this morning, which means my market insight might also be a bit off.  But, here goes.

    After tagging our IH&S target yesterday, ES tumbled back below the bottom of the channel which broke down back in late October. It’s sitting right there at this moment, meaning the bulls and bears have yet to sort things out.

    continued for members(more…)

  • Test Passed, So Far…

    ES spent 6 1/2 hours yesterday anguishing over the trend line/neckline we discussed.  When the Fed minutes came out, it even broke down a bit from the rising channel it had constructed overnight.  The breakdown seemed like it was sticking.  But, just after the close, WTI spiked and VIX dumped. That’s all it took to put ES back into bullish mode, prompting a 21-pt pop which fell apart overnight but is back in place as we approach the open. Meanwhile, VIX has constructed a little TL which could break down any minute and boost the algos if they should need help.  But, what if it holds?  (For the answer, see yesterday’s: This is a Test.)

    Should be a very interesting day.

    continued for members(more…)

  • Update on Gold: Apr 11, 2018

    In our last major update [see: Jan 26 Update] we noted that gold, 1355 at the time, had reached the same price level at which it had frequently reversed.  Even though we’d had a bullseye at 1377-1380 for over a year, it had stopped short several times.

    GC is sitting just below the neckline of the huge IH&S that could result in a significant breakout.  The fly in the ointment: I don’t think TPTB will let it break out.  So, you should either take profits here in the 1348-1365 range, or at least set your stops at this level.

    As it happened, 1365 (reached the day before) was the cycle high.  Gold tumbled 4.1%, then bounced around between roughly 1308 and 1362 for the next two months.  Our interim posts caught most of the moves:

      * * *

    Feb 8: Analog Details  “[Gold] has dropped 4.1% since reversing where expected in late Jan, and just reached fanline and double channel support [1321.] Could it finally be ready to tag 1377-1380?”  Bottomed that day, rallied to 1364 over the following week (+2.51%.)

    Feb 15: Where to, Next?  “GC might have run out of steam here [1360.] Cautious types should consider taking profits, while the daredevils out there remain focused on 1380.” Topped out the following day at 1364 (+2.95%.)

    Feb 27: Powell’s French Toast   “Gold is getting clobbered…our analog suggests a Mar 1 turning point. The SMA100 should be around 1303 by then and would be a better bounce spot.”  Bottomed on Mar 1 at 1303.60 (+4.15%.)

    Mar 27: Algos to Markets – All Better  “GC, which tagged its 1362 resistance yet again, has retreated once more… It still has a good shot at 1380, but only if/when DXY finally breaks down.” Reached 1369.40 today (+5.05%.)

     * * *

    So, here we are, sitting on a tidy 14.7% gain.  It’s not terrible for 2 1/2 months work, considering gold has only netted a 0.9% gain during that period.  But, I hate to leave money on the table. Is it time to pull the plug on 1377-1380?  Or, are we about to reach or exceed it?

    continued for members

    The two major factors at work are the ongoing saga of the US dollar and the possibility of a shooting war with Russia in Syria.  I can’t speak to the question of a war other to say anything’s possible, especially with the crew currently running the ship.

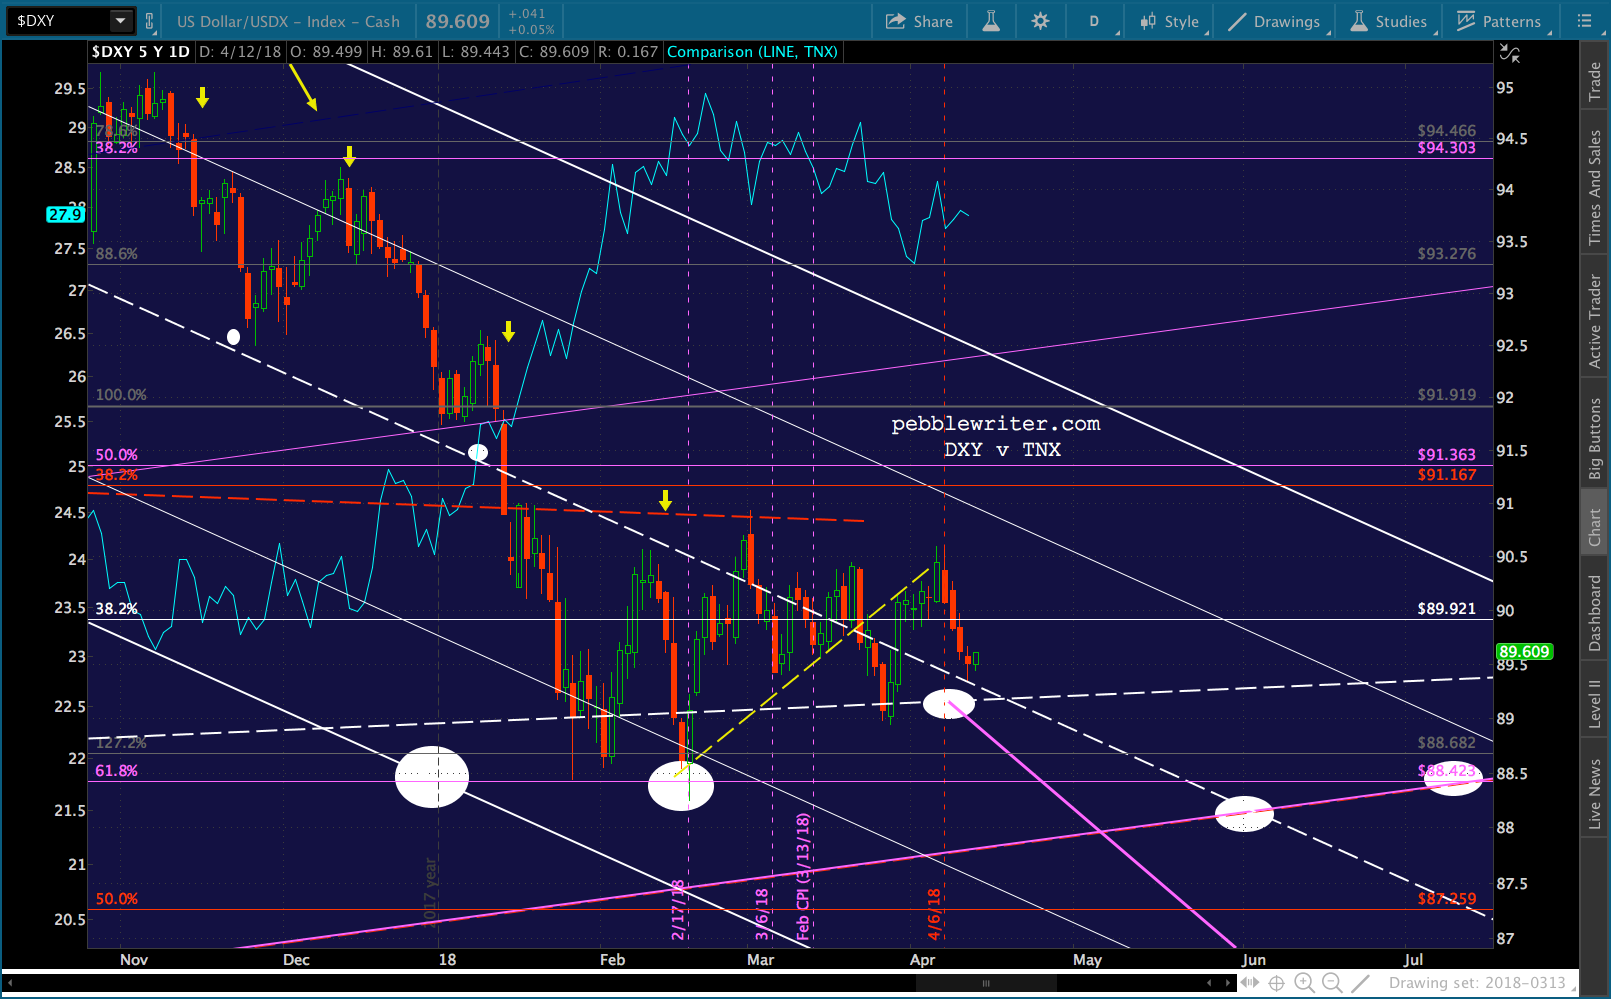
    The dollar is another matter.  While it normally rises and falls in sync with interest rates, this relationship reversed at the end of 2017.    At that point, DXY logged another leg lower while TNX spiked. At just shy of 3%, the TNX became a drag on equities — the whole “going broke” thing [see: Why Rising Rates Are a Problem This Time.]  But, as the gyrations in equities picked up again, great care was taken to ensure it didn’t plunge in value.

    I suppose the thinking was that lower rates would weaken the dollar’s appeal.  Or, maybe it was just fear of a yield curve inversion.  In any case, TNX’s purple TL has refused to break down. DXY also refuses to break down.  And, this could go on for quite a while.  It needs to tag the bottom of the rising purple channel.  But, until mid-July rolls around, that would mean dipping below the .618 at 88.423.  So, it’s quite possible TPTB will prop it up for another three months! 
    Remember, Mnuchin publicly stated he wants to support the USD.  And, it goes without saying that he, like every central banker, loathes any serious price appreciation in gold, as it undermines the value of the mighty dollar. One silver lining, EURUSD suggests a shorter timeframe, say Jun 5.  But, even two months would be a long time to wait for another few points.  An escalation in MENA tensions could obviously accelerate things.  But, is it worth taking the risk for 10-15 points?  I think not.  I’d pull the plug or at least enter stops here at 1367.  If it pops above 1380, great.  No argument with going long, again.  DXY could drop to 87 tomorrow, and GC could easily reach 1377-1380 or higher.

    But, if DXY continues sideways, and unless war breaks out in the next day or two, it seems likely that gold’s next move will be lower.  The most obvious support is at the rising white channel bottom and SMA100, currently around 1315.2-1318.  If the channel breaks down again, the SMA200 will reach the purple channel line later this month, probably around 1300.  I’ll update things if we see a material deviation in either direction.

    GLTA.


  • That Escalated Quickly!

    It was just last Tuesday we asked “where’s the bounce?”  SPX had gapped lower and failed to rebound the way it always seems to has for the past year.

    We had watched a trend line dating back to Dec 29 (below, in red) break down, and were wondering about the small, white channel.  From Where’s the Bounce?

    After that, it gets a little messy. ES has an important backtest at 2773, which would be 2730 on SPX — nothing all that important in the vicinity. Below that, however, the white 2.24 at 2703.62 remains very interesting. It would be a hell of a drop from here: 117 points or 4.1%.

    The closer we got to 2703, the more plausible it seemed.  When we reached it today, though, SPX leveled off for only about 10 minutes before plunging lower.  Why?

    There are two primary reasons.  The first, of course, is VIX.  Was there a single session this past year when I didn’t bitch about the degree to which timely beatdowns in VIX were triggering algos to bid up stocks?  Doubtful.

    After VIX broke out of the falling channel on Friday, Our charts suggested it would reach 16.29 and, if/when that broke, 25.65. 

    When 25.65 broke, at approximately 11:48 this morning, it triggered an additional wave of selling from those very same algos which have learned so well to take their clues from VIX’s every twitch.  Live by the sword…

    The second reason was USDJPY and the ubiquitous yen carry trade.  As we noted in our last update [see: Jan 24 Update on USDJPY], the pair reached a channel bottom which represented important support.

    We’ve reached the bottom of the rising white channel which has held on four previous occasions since its origin in late 2012…Bottom line, USDJPY isn’t necessarily done until DXY is done. We had bounces at the .500 and .618, so an overshoot to the .786 at 108.90 or even the .886 at 108.16 is a distinct possibility.

    As it so happens, the white channel bottom didn’t hold.  Despite Kuroda’s desperate jawboning, USDJPY has continued to falter.  It backtested trend line resistance yesterday — all well and good.

    But, instead of catching support as it almost always does, it broke down.  At 11:56, it dropped through a tiny trend line of support.  Seconds later, when that TL broke down……it broke down through a larger TL of support.

    Bottom line, VIX and USDJPY are the two most powerful drivers of algos there are (oil occasionally takes the lead.)  When they were going strong…melt up.  The slightest hint that they’re not…melt down.

    SPX bottomed out yesterday at 2638.17 and closed a good 55 points below the 2.24 Fib.  While it’s always scary to see major Fibonacci support fail, there was an obvious effort to keep the uptrend alive.  Note the SMA100 crosses the bottom of the rising channel which was established with the Feb 11, 2016 lows.  In other words, it’s important.

    Significantly, the channel bottom was defined by the Nov 9, 2016 lows.  If that date sounds familiar, it was the election night in the US.  And, it was the last time a major effort was made to salvage important Fibonacci support. [see: Why the Trump Rally Is a Fraud.]

    It worked spectacularly, resulting in a 38% rally.  All it took was a 17% spike in USDJPY, a 55% rally in oil, and a 63% collapse in VIX.

    How about now?  The algos are primed and conditioned to respond.  I’m sure Jim Bullard still knows his way to Bloomberg’s studios.  Can TPTB manufacture another recovery?  For the answer, we need only to examine two similar, previous meltdowns: the night of the US election in Nov 2016, and August 16, 2007.

    continued for members(more…)

  • The Rally That VIX Built

    As discussed yesterday, stocks spent the night building a cushion based on VIX (currently off 5.4%) in preparation for tomorrow’s FOMC announcement.  It started just before the close, yesterday, and has built to a 6-pt gain in the futures.Actually, it’s been less of a rally, lately, and more of an effort to maintain ES at levels above its IH&S Pattern target reached back on Jun1.  Remember the mantra “stay fully invested, because you never know when a sudden rally will appear out of nowhere and you can’t afford to miss it”?  These days, it’s the corrections that pass in a flash, like Friday’s 31-pt plunge which was reversed so quickly that it won’t even register on daily charts.

    But, I digress.  Today’s action is all about putting more distance in between SPX and the Support Below Which it Must Not Go in the wake of the FOMC meeting.

    continued for members(more…)

  • Pulling Out All the Stops

    When unexpected unpleasantness unfurls, you can count on central banks to pull out all the stops. Such is the case with the British election results which, like Brexit, have wreaked havoc on FX markets.

    EURGBP, having broken down from its rising red channel dating back to mid-2015, was well on its way to a perfectly nice backtest at .80ish. Instead, it’s backtesting the broken red channel itself. Hence…the stop pulling.It should start with nice bounces from USDJPY and CL — which, as discussed yesterday, have already reached interim bottoms — and, of course, a sharp plunge by VIX.

    Look for USDJPY to pop through its SMA200 for good measure… …and CL at least hold its own in the midst of strong selling pressure.

    continued for members(more…)

  • The Same, but Different

    Yesterday started out with a VIX-driven pop that quickly fizzled and nailed our downside target before rebounding and hitting our upside target.  Since SPX closed right at resistance, it needed a boost overnight.  So, why not go back to the same clever trick that worked the day before?

    Yes, VIX’s red channel has broken down again.  And, the algos are eating it up… to the tune of +5 on ES.

    Will it pop and drop, again, or will this one take?

    continued for members(more…)