Tag: Inverse H&S

  • Striking Distance

    This is day 8 of our membership promotion, running now through the end of the month for members and non-members alike. We’re offering a 25% rebate off the first month of Monthly and Quarterly auto-renew subscriptions. Annual memberships are available at a very substantial discount (rewarding those who act quickly!)

    Remember, the annual pricing is available to current members. If your current membership hasn’t expired yet, we’ll tack your new subscription on to your current expiration date. This can be especially valuable for those who took advantage of a special last year which offered a discount on the first year of a auto-renewing annual subscription.

    To sign up for a new monthly or quarterly subscription, CLICK HERE. For details on an annual subscription, drop us a line with the subject line “sign me up!”

    * * *

    After SPX’s break out on the back of a 37% plunge in VIX, it’s no surprise that the VIX has kept it within striking distance of new all-time highs.

    In dropping that 37%, VIX completed a deep retracement of its rise from 9.97 — the lowest it’s been since 2007 — to 16.28.  The .886 retracement is considered the last stop before prices drop through the previous lows.  Imagine: risk being considered lower than at any time since 2007!

    Yesterday, VIX spent the entire day dancing around that .886, with a dip below it every single time SPX started slipping.  The message to algos was that VIX was about to drop to new lows and, therefore, stocks should be bought.It was enough to keep SPX from completing a simple retracement from its .886 to its .786, or any meaningful dip until the final minutes of an otherwise nonsensical session.Today’s a new day, as CL is closing in on our 48.35-48.45 target and investors are no doubt anxious to express their disappointment with the lack of details provided for the fantastic, big-league tax cuts “revealed” yesterday.

    Despite the slight bump in futures overnight, our downside targets remain intact – starting with 2384.

    continued for members(more…)

  • Charts I’m Watching: Apr 12, 2017

    As we noted yesterday, SPX is hanging on by the skin of its teeth to a breakout.  Despite an 18-pt intraday plunge, it recovered by the end of the session thanks to a timely decline in VIX and rally in WTI.  Will it be enough to keep the trend intact?

    continued for members

    The daily candle is close enough to the yellow channel bottom to call it a save.  But, futures are off several points again this morning. 

    And, VIX is on the rise — likely headed for our target at 16.25 – 16.48.

    But, USDJPY has reached the white channel bottom ahead of the SMA200 and could get a bounce for a few days.

    It will need to clear the 109.75 price level to be of any help.

    I suspect this is all designed to allow ES to tag support on this little red channel as well as the larger red channel.  If it doesn’t hold, the falling white channel suggests another 20+ points of immediate downside.If it holds, SPX should bounce from right here and recover to test the IH&S neckline over the holiday weekend.  Aside from the purple TL, the other key level is the SMA5 200 at 2354.95 — which is very close to the yellow neckline (which has yet to be properly backtested.)  I would want to be long here with very tight stops.

    Here’s SPX with the same falling white channel as ES sketched in.  Clearly, yesterday’s reversal at 2337, which occurred a few points shy of our 2334-2335 target (yellow) was a little premature.  It leaves open the question as to whether the bounce was off firm enough support.

    UPDATE:  10:01 AM

    SPX is struggling to remain above its SMA50.  USDJPY and CL aren’t helping much, though VIX is falling just enough to keep it above the purple TL — now around 2348.80.

    Remember, we have an EIA crude inventory report coming out at 10:30AM.  CL has been steadily approaching the .886 at 54.11 for the past two weeks, and yesterday’s API report was bullish.

    Stay tuned…

    UPDATE:  10:32 AM

    The EIA says crude inventories decreased by 2.2 million barrels.  The bad news, however, is that Cushing is at all-time highs — 69.4MM versus capacity of 77MM barrels.


    CL spiked higher for a moment, but is back to its .786 Fib.  SPX is following its lead, and dropping through the purple TL.  I’d revert to short on any drop through the SMA5 100 at 2348.76.

    CL is slipping, and looks like it wants to tag its SMA5 200 at 53.19.  It would be enough to knock SPX off trend, so it’s a little tricky.  If CL drops through the SMA5 200, it’d be quite negative for both CL and SPX.

    VIX is keeping SPX afloat……and USDJPY is still playing its cards close to its vest.

    UPDATE:  10:38 AM

    SPX is slipping below the purple TL, but has so far just head-faked 5 separate declines below the SMA5 100.  If CL gets a strong bounce off its SMA5 200, it’ll set up another head fake.  Even so, it makes me nervous to hold long as it keeps testing the SMA5 100.  Keep your stops where you’re comfortable.

    UPDATE:  10:44 AM

    I’ll probably be right back to long, but I’ll revert to short here.  CL is struggling with its SMA5 200 and USDJPY might not hold its red TL.A drop through 53.29 would be bearish and open it up to 51.6 or lower.

    Note that ES’ red channel has completely broken down.UPDATE:  11:07 AM

    A bounce off the white midline makes sense.  We’ll have to see what happens, thought, when it reaches the SMA5 10 at 2347.80.  If it pushes through, everything’s a go for the SMA5 200 tag and yellow neckline breakout.  If it can’t, then 2334.26 is in view.

    At the current rate, it could reach the .786 without tagging the bottom of the falling white channel — if it’s willing to wait a while.  Note that the channel’s .236 line reaches 2335 a little after 3pm this afternoon.

    UPDATE:  11:42 AM

    ES just reached the midline of its falling white channel, which could provide support even though SPX doesn’t show much.

    UPDATE:  11:58 AM

    Now, SPX has tagged its midline, too.  I’d expect a bounce here, though it could be confined to the SMA5 10 around 2344.  Note, though, the SMA5 200 is approaching the purple TL.  A huge bounce would make that a target — though it seems unlikely.

    CL has broken down below the .786 and SMA5 200.  So, this entire decline feels very much managed/engineered — meaning there’s a purpose and a target which is below current levels.

    UPDATE:  12:09 PM

    12:09 — often a turning point in bounces — and SPX just backtested its SMA5 10.  I’d look for a reversal here, but keep an eye on USDJPY and CL.

    UPDATE:  12:21 PM

    SPX is nudging up through the SMA5 20 on VIX weakness and USDJPY strength.  But, CL continues to falter.  And, VIX has bounced at the SMA5 50 three times in a row.  I’d hold short here.

    UPDATE:  12:51 PM

    VIX is getting a nice boost, but our 16.25-16.48 target isn’t that far off.  SPX should continue dropping, but I’d keep a close eye on VIX and USDJPY, which is testing its SMA5 200 again.

    I have to run a quick errand, will be back in 10 minutes or so.  Watch for TL support at 2341.78, the 1.618 and .786 at 2334.26-2335.34, and the .886 at 2328.65.

    UPDATE:  1:03 PM

    SPX just tagged TL support at 2341.78 and got a nice bounce.  Bears need the bounce to stop right here.  Will CL be satisfied with a backtest?

    UPDATE:  1:14 PM

    Giving it just a little leeway in case the .886 is the target.  My only hesitation is USDJPY, which has pushed above its SMA5 100 again.  On the other hand, VIX has tagged the SMA5 50 for the 4th time.  The fact that it hasn’t plunged down to the SMA5 200 or below tells me this is probably an officially approved and scripted decline.

    UPDATE:  1:40 PM

    SPX is breaking out on VIX’s dip below red TL and USDJPY’s push above the purple TL.  Back to cash until this resolves itself.  Remember, VIX has support at the purple TL and the SMA5 200 around 15.35.  If it drops through the SMA5 200, SPX has a good chance of reaching its own SMA5 200 — perhaps as it reaches the SMA50.

    UPDATE:  2:01 PM

    Feeling pretty iffy about it, but we could get a reversal here at the SMA50 rather than the SMA5 200 as it’s also the white channel .786 line.  Back to short with relatively tight stops.

    Note that ES has fully backtested the red channel.

    UPDATE:  2:10 PM

    Note that USDJPY is back below the purple TL.  I need to run out for a meeting and probably won’t be back until after the close.  I think there’s probably a 50% chance that SPX holds these levels until the SMA5 200 arrives at the SMA50 at 2349.60.  It’s equally likely it reverses between here and there and heads down to 2334 or 2328.  As long as it stays below 2350, I’d want to be short.

    UPDATE:  2:51 PM

    TL support, again.

    UPDATE:  3:20 PM

    USDJPY just snapped, sending VIX surging and CL popping to compensate.  SPX is down to the white midline again, where it could bounce.  VIX might have one more good run in it up to 16.25+; but, they might be looking to close the session at that SMA50/SMA5 200 intersection. I’d want to revert to cash above the SMA5 100.  As usual, shorting overnight should only be attempted by those who can hedge or handle the gap risk.  Watch your stops.

    .

  • Betwixt and Between

    SPX and ES managed to hold key trend lines and channels yesterday, bouncing from just short of our downside targets to exactly where we expected.  All it took was an 18.3% hammering of VIX — no problem for the Masters of the Universe (real subtle, guys!)

    But, there was no breakout.  There wasn’t even an overnight ramp job.

    This somewhat validates our theory about the oil and USDJPY two-step, meaning we should be looking for a big, sudden move in the currency markets as soon as today.

    continued for members(more…)

  • Reproach and Retreat

    The first big Republican victory — the repeal and replace of the ACA — has morphed into reproach and retreat.  The net impact: what does this failure portend for the rest of the Trump agenda and, thus, the Trump Rally?

    Regular readers know that I’ve looked askance at this rally from the start [see: Why the “Trump Rally” is a Fraud.]  It was born of a sharp reversal in CL, USDJPY and VIX — the key algo drivers.  Momentum traders jumped on board as it rose.  And, somewhere along the way, mainstream investors convinced themselves that the new and improved outlook justified an 18% rally.

    But, live by the algo, die by the algo.  The yen had to appreciate to compensate for higher oil prices.  Higher US and euroland inflation necessitated a drop in oil and gas.  And, front-running the Fed’s tepid response to spiking inflation was widespread.  With the Trump Rally narrative in doubt, there were simply too many plates to keep spinning.

    Futures are off 22.50 at the moment, leaving us some clues as to what to expect for SPX.  But, the more important side of the equation is where do WTI and the USDJPY dip to?

    continued for members(more…)

  • Horseshoes and Hand Grenades

    There’s an old expression that says “close only counts in horseshoes and hand grenades.”  So, we spent most of the day yesterday wondering whether the day’s 2336.45 lows were close enough to our long-held downside target of 2335.34.The tag was marred by premature reversals in oil and VIX.  Did the guys working the algos not get the message?  Or, were they just a little over-eager?  Admittedly, it’s tough to nail a precise value in an index as unwieldy as the S&P 500.  But, they went to all the trouble of engineering a backtest of a key Fib level.  You’d think they’d care…

    continued for members(more…)

  • Update on AAPL: Jul 31, 2013

    It’s not often I get the chance to plug a future competitor.  As some of you know, my son Kyle is helping me out this summer.  He will graduate in December with an Economics major and Personal Financial Planning minor from Texas Tech University in lovely Lubbock, TX.

    In addition to performing many rather thankless duties for me, he has spent a fair amount of time learning the ropes of charting and technical analysis.  I asked him his opinion on AAPL the other day, and am pleased to present his analysis.  FWIW, I think he did a very nice job.

    It wasn’t the easiest of assignments.  Since our bottom call on April 19 [see: Is it Safe?], the stock quickly rallied to our upside target (a nice 20% gain), then promptly gave back almost all of those gains.  After all is said and done, he feels bullish about the rally continuing – a forecast with which I agree.

    I hope to lure Kyle back after he graduates for more of the same.  Though, he seems pretty excited about the financial planning field.  Those of you in the biz who would like to chat with this bright young lad about his career plans, feel free to drop me a line.

    *  *  *  *  *

    AAPL rose sharply following its earnings release last Tuesday.  EPS was $7.47 on revenue of $35.3 billion. Both numbers beat Wall Street estimates. Analysts had been expecting EPS of $7.34 on revenue of $35.18 billion.

    It shot up 25 points, breaking through the midline of both the rising purple channel and a large falling channel (in white below) from the 705 high.  It backtested the white channel midline, then shot up yesterday to complete a Bat Pattern (yellow) at the .886 of the drop from 465 on May 7.

    The completed Bat Pattern could pay off with a drop to backtest the white channel midline around 430-433 (the last Bat Pattern – from 469.95 on March 25 – fell much more sharply, retracing .886 of its rise.)

    Such a pullback could ultimately be bullish, as it could form the right shoulder of another IH&S (red) that targets 525 – only a few points away from the 1.618 extension (522.39) of the 469-385 drop beginning March 25. This target intersects with the top of the white channel around August 5-12.

    But, given that the recent low was slightly higher than the April lows, a large IH&S Pattern has already completed.  It could go ahead and play out now.

    The current rising purple channel doesn’t intersect with the top of the white channel until lat August/early September, about the time it passes through the latest Bat Pattern’s extension to the 1.618 at 513.26.

    Both of these bullish scenarios assume that AAPL is able to beat its former highs of 465 and 469.95.  Many potential harmonic patterns on the way down from 705 have been unable to.  In fact, each successive high has been lower than the last.

    But, for now, we’ll remain bullish with a target of 514 by late August and 570 before the end of the year.

    GLTA.

  • Update on DJI: Jun 19, 2013

    Since breaking above the 2007 high, the Dow’s been on a tear — eager to leave 2007-2009 in the past.

    In so doing, it sliced right through the white 1.618 extension of the 2011 correction and the 1.618 and 2.24 extensions of the drops from Apr 2012 and Sept 2012.

    What’s next?

    continued for members(more…)

  • Update on USDJPY: Jun 18, 2013

    The pair has dropped like a rock since the purple channel broke down on June 5.  It reached the .886 Fib as expected [CIW: Jun 6], then immediately bounced back above the neckline of the H&S Pattern it had completed (in red, below.)

    The following day, it fell back through that neckline, and has spent the past three sessions trying to climb back above it.

    In the process, however, it formed a second H&S Pattern (roughly the dashed yellow line as the neckline.)  Either of them could send the pair tumbling to the white 1.618 at 85.66.

    But, the defunct purple channel has given rise to a decent-looking new channel (in white, below) that — if it holds — could pick up where the purple channel left off and carry USDJPY to new highs?

    But, what if it doesn’t, i.e. if the H&S Patterns play out?

    continued for members

    (more…)

  • Charts I’m Watching: May 10, 2013

    The market bounced back a little into the close yesterday, and recovered further overnight.  ES retraced a Fibonacci .886 of the initial plunge, and is hanging in the small channel established over the past week.

    We shorted SPX at 1635 yesterday, but weren’t sure whether or not the upside was completely done. This morning, there’s still some question.

    The dollar, which we remarked yesterday morning looked “ready to rumble” did just that — completing its largest move in the last 16 months.  It retreated just a bit off the .786 before zooming up to tag our .886 target at the purple channel midline.  How it handles this price level will determine whether or not we see any follow-through on equities this morning.

    We would normally see a pull back at the .886 — a Bat Pattern.  But, Bats can and do go on to become Crab Patterns — which would mean a move up through the channel midline to the 1.618 extension at 84.522.

    Daily RSI arrived at a 4-way “stop sign” overnight — three channel midlines and a channel top.  Though it might ultimately push through, this supports the idea of at least a pause and more likely a pull back, meaning stocks should rebound from here.

    The question, of course, is “how much?”  The EURUSD, which we remarked yesterday was “hanging by its fingernails,” wasn’t able to hold the purple channel.  It completed the small scale Bat Pattern we were expecting overnight (purple), and has potential to the red .886/purple 1.618 down around 1.28.

    The daily RSI supports this move, as it fell right through its nearest support overnight.

    All eyes are on Bernanke this morning, as he speaks at the Chicago Fed.  Evans and Plosser’s semi-public debate regarding QE has ratcheted up a notch the past couple of days. It’ll be interesting to see whether Bernanke can reassure the markets that economic conditions remain “just right” for continuing to pump $85 billion monthly into the markets: getting better every day, but not able yet to stand on its own two feet.

    The other big story, of course, is the yen. We discussed yesterday how it was a moment of truth for the USDJPY.  It was threatening an Inverted H&S Pattern, but had run into an important channel line.

    The pair sliced through it like it wasn’t there, completing the IH&S, then reaching the IH&S target and a Crab Pattern near 102 in one fell swoop.  In the process, it reaffirmed the dominance of the rising purple channel from 75.56 in October 2012.

    A quick pullback could reassert the white channel; but, if not, the next stop is 105.57-106.98 as soon as May 21.

    But, the daily RSI suggests a very good chance of a quick pullback.

    The Nikkei 225 has loved the yen implosion, zipping through the .618 retracement of the 2007 crash and a well-defined channel top on May 3 and threatening to top the Dow.

    But, the collapse in JGB (and spike in yields) gives one pause.  This is what Abe wanted, but is he prepared for the currency wars he’s unleashed with neighboring Asian countries?  Sri Lanka, Vietnam, Thailand and South Korea have all either cut rates or are about to.

    I wonder whether Japan, with government debt at 240% of GDP, will survive the cure for its economic malaise.

    UPDATE:  9:30 AM

    I’m taking an interim long position on the opening, but will be watching to see what happens at 1631.  My core short position will remain in place unless we get a push up through the red channel midline. Stops on the long at 1626ish.

    I would have been more than content to close out the short at yesterday’s close, but the low for the day was slightly lower than the previous “bottom” of 1623.30, leading me to believe we might see another leg down.

    We’ll see what Bernanke has to say, then check back in.

    UPDATE:  10:00 AM

    A bit of a snoozefest in Chicago.  Bernanke’s giving a history lesson, not saying anything yet about the topic on everyone’s mind: QE.

    SPX just reached the red channel midline mentioned at 9:30, just shy of the .786, and is deliberating next steps.

    The dollar continues to strengthen, making a series of smaller waves higher while remaining above the .886 Fib discussed above.  And, the EURUSD continues to leak lower — just reaching the .236 of the 1.37 high In Feb.

    UPDATE: 11:5 AM

    I’ll be closing the interim long here at 1626 due to the triangle breaking down. Full short for  1613-1617 (favored target about 1614.) Confirms with a drop through 1623; should get a bounces around 1624 and 1622.

    60 min RSI shows a little room to run.

    Watch out for a possible backtest of the triangle to around 1627.75.  Stops on the short at the top of the triangle, currently about 1629.

    If there’s something that could derail any further downside, it’s the EURUSD.

    It reached the .618 of the 1.2743 to 1.3242 rise this morning (small red pattern), and can be expected to bounce.

    It’s also getting dangerously close to the bottom of the light blue channel that rises from July 2012.

    Technically, the .618 is enough of a retracement for this wave to be finished.  But, it certainly doesn’t look finished.  I think it’s more likely we’ll get an intra-day push down to the red .786 (1.2850) or even .886 (1.28) before all is said and done.

    A sustained break of the channel bottom, needless to say, would be exceedingly bearish for the euro and for equities.

    UPDATE:  1:30 PM

    Based on my best stab at placing the falling white channel, I believe SPX just topped out on the day.

    Next stop should be around 1622 at the midline, but ultimately the green 2.618 should come into play where the white channel bottom and red channel bottom intersect — probably around 1614 on Monday.

    The next major support would be the purple midline — around 1593 on Monday — and then the previous high and purple .25 of 1576.

    If I’m wrong, stops at around 1630 ought to do it.  I have to run out till 3PM ET, but will post more when I return.

    GLTA.

    UPDATE:  3:44 PM

    SPX just moved up past my comfort zone — not to mention out of the channel — so I’m switching sides here at 1630.  Next stop 1641-1642?  It’s the 1.618 extension of the fall from 1635 to 1623 and the approximate level of the IH&S.

    Best of all, it will happen on the 13th, which is when we originally had the interim top scheduled.  All is right in the world again.

    Legible chart coming up…

    I wouldn’t normally stay long over the weekend, but I imagine we’ll gap up to 1641-1642 Monday morning, so it’s worth a shot.

    Looks like we’ll probably close at the .886.  We might get a small reversal just ’cause, but Point B in this case was almost the .786, so that technically rules out a Bat Pattern.  Instead, it’s a Butterfly/Crab that should extend to the 1.272 or 1.618.

    Of course, things don’t always go according to plan; but, I like where the currencies are finishing up.

    More in a few

    UPDATE: EOD

    The revised view from the treetops:

    And, a little closer in…

    “D?” doesn’t work as a Bat Pattern because “B” is higher than the .618.  We could use the reversal at the .500, but “A” is the lowest low, so that doesn’t work.  That leaves a Crab Pattern with roughly a .707 Point B — if it follows the rules.



  • The Best Laid Plans

    The best laid plans of mice and men
    Go often awry,
    And leave us nothing but grief and pain,
    For promised joy!

    Robert Burns, 1785

    ORIGINAL POST:  6:45 AM EDT

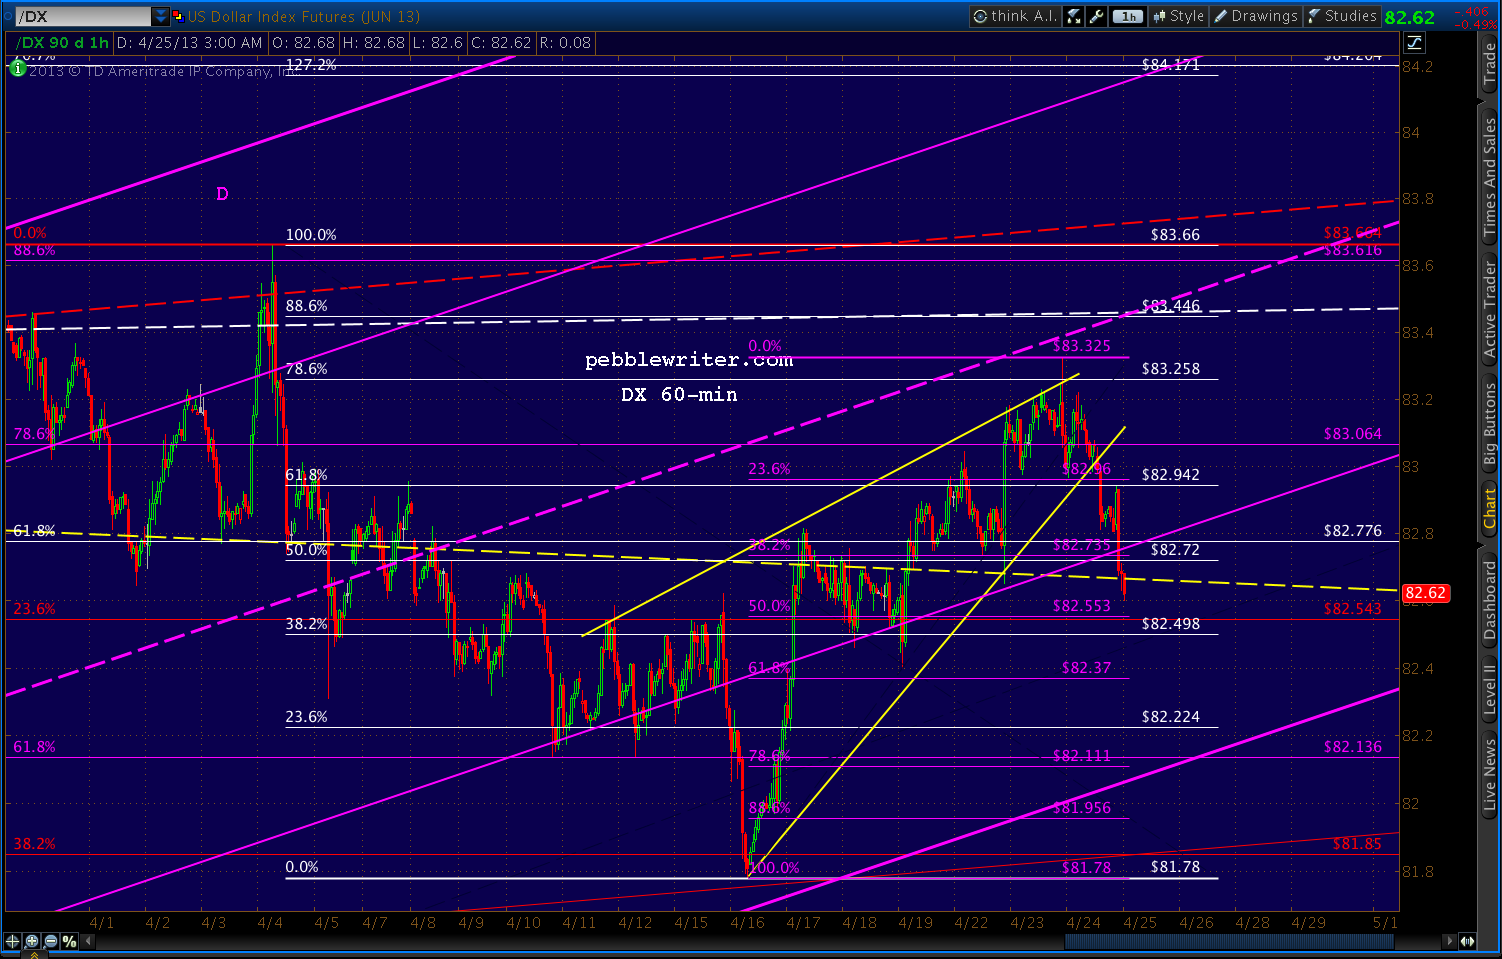
    The wedges we’ve been watching on DX and EURUSD are playing out.  EURUSD has broken out…

    …and DX has broken down.

    But, it’s the USDJPY that I’m watching especially closely this morning.  It still hasn’t broken 100 since our Apr 8 observation [USDJPY update] that it was running out of steam:

    “…there is growing risk of a downturn as it approaches 100… it appears the pair might have hit at least interim resistance at today’s high.”

    It topped out 3 sessions later at 99.94, and two weeks later is in danger of a larger pullback.

    Remember, weakening the yen was a critical element of the BOJ’s stimulus program that was supposed to generate inflation, boost Toyota sales and send Japanese investment funds flooding into foreign markets.

    Instead, Japanese investors are repatriating their funds from abroad — a net Y9.5 trillion ($95 billion) since the first of the year.  Why?  As any US investor could tell you, QE might not inflate economies, but it sure as hell inflates markets.

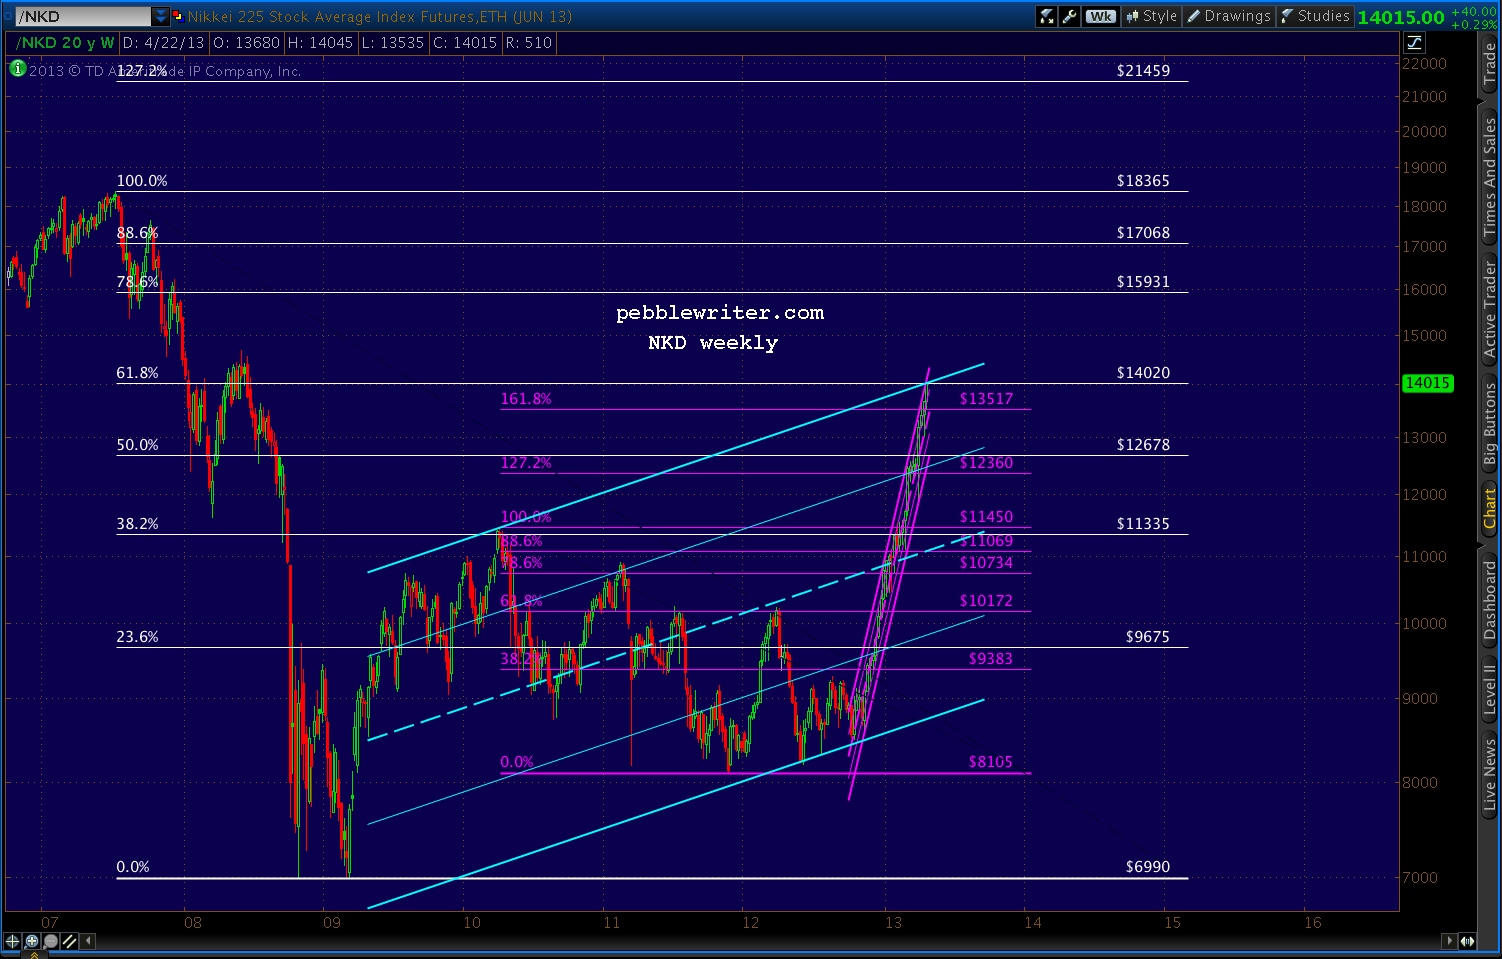
    The Nikkei 225 is up 65% since last October’s lows….

    …and, still hasn’t even recovered 2/3 of its losses from the 2007 crash.  The Dow and the S&P 500, by contrast, have recovered all of them — and, then some.  So, to many, the Nikkei still seems the better value.  It’s hard to argue with success.

    But, I’ll do it anyway.  In reaching 14,020 a few hours ago, NKD tagged the .618 Fibonacci retracement of its 2007-2009 crash from 18,365 to 6990.

    To those not familiar with harmonics, this tends to be a big deal.  When SPX reached the equivalent point in April 2010, it plunged 17%.  The DJIA fell almost 15%.  The USD, represented by DX, soared 9.3%.

    But, the yen positively soared.  USDJPY started a 17-month slide that took the pair down 20% from 94.98 to 75.78.  NKD, which had just reached its .382 Fib, shed 23% over the next 4 months, eventually reaching almost 30% in Nov 2011.

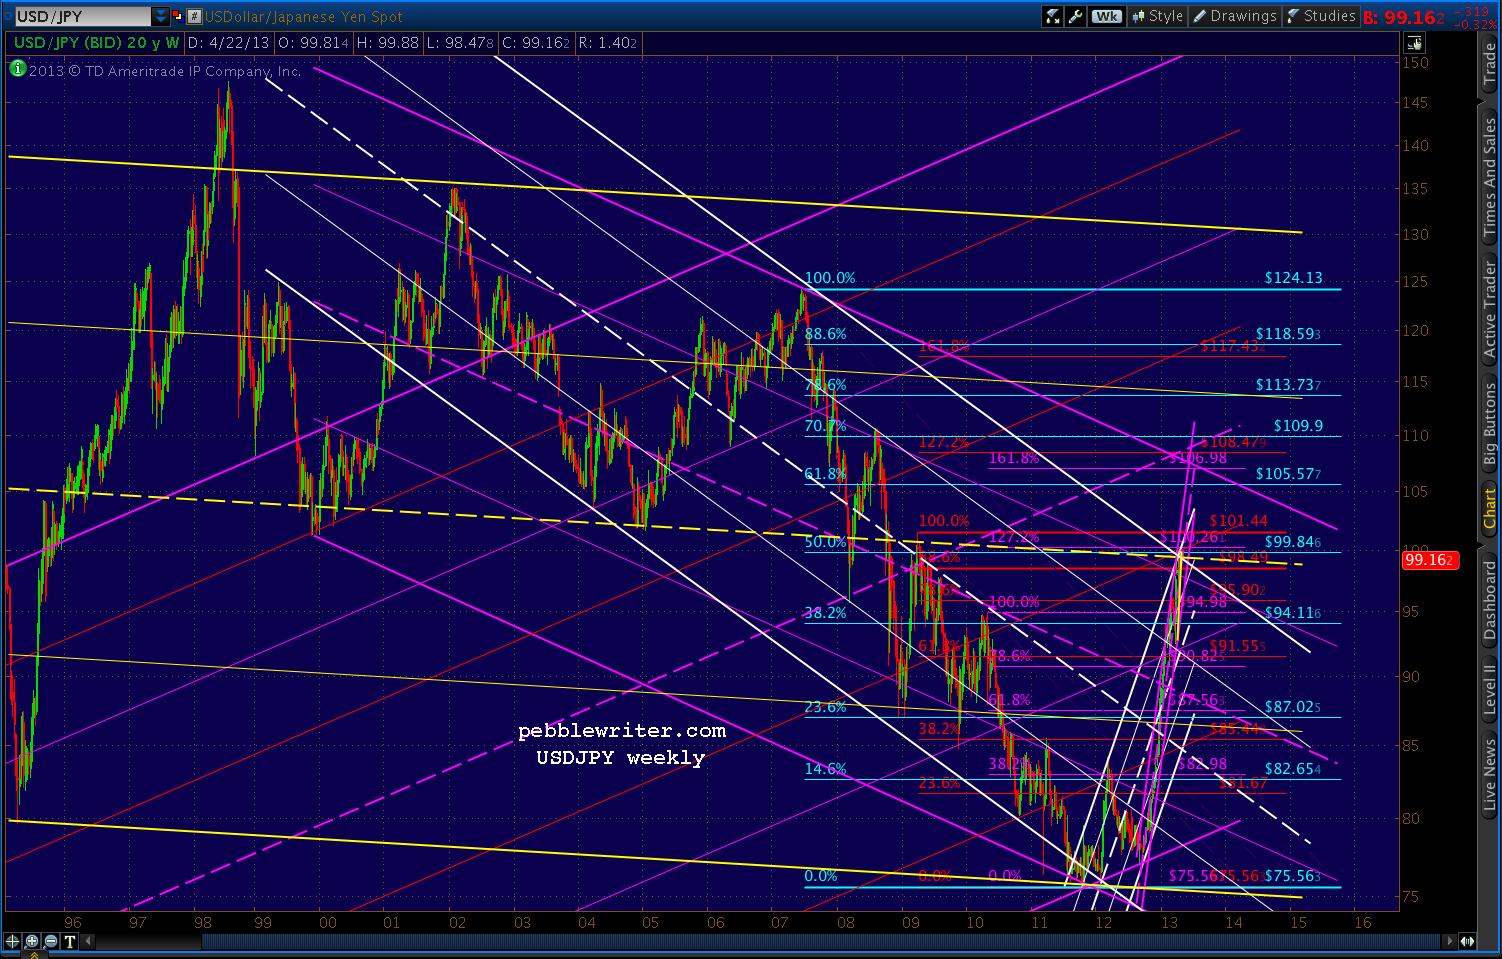
    Could the USDJPY’s failure to break 100 be telling us something?  You better believe it.  I called a top a few weeks ago because the pair had reached several important Fib levels as well as the midline of an important channel (in yellow, below)…

    …that dates back to 1995.

    There’s no guarantee it won’t push through instead of retreating, but the RSI picture supports the danger of a significant retreat.

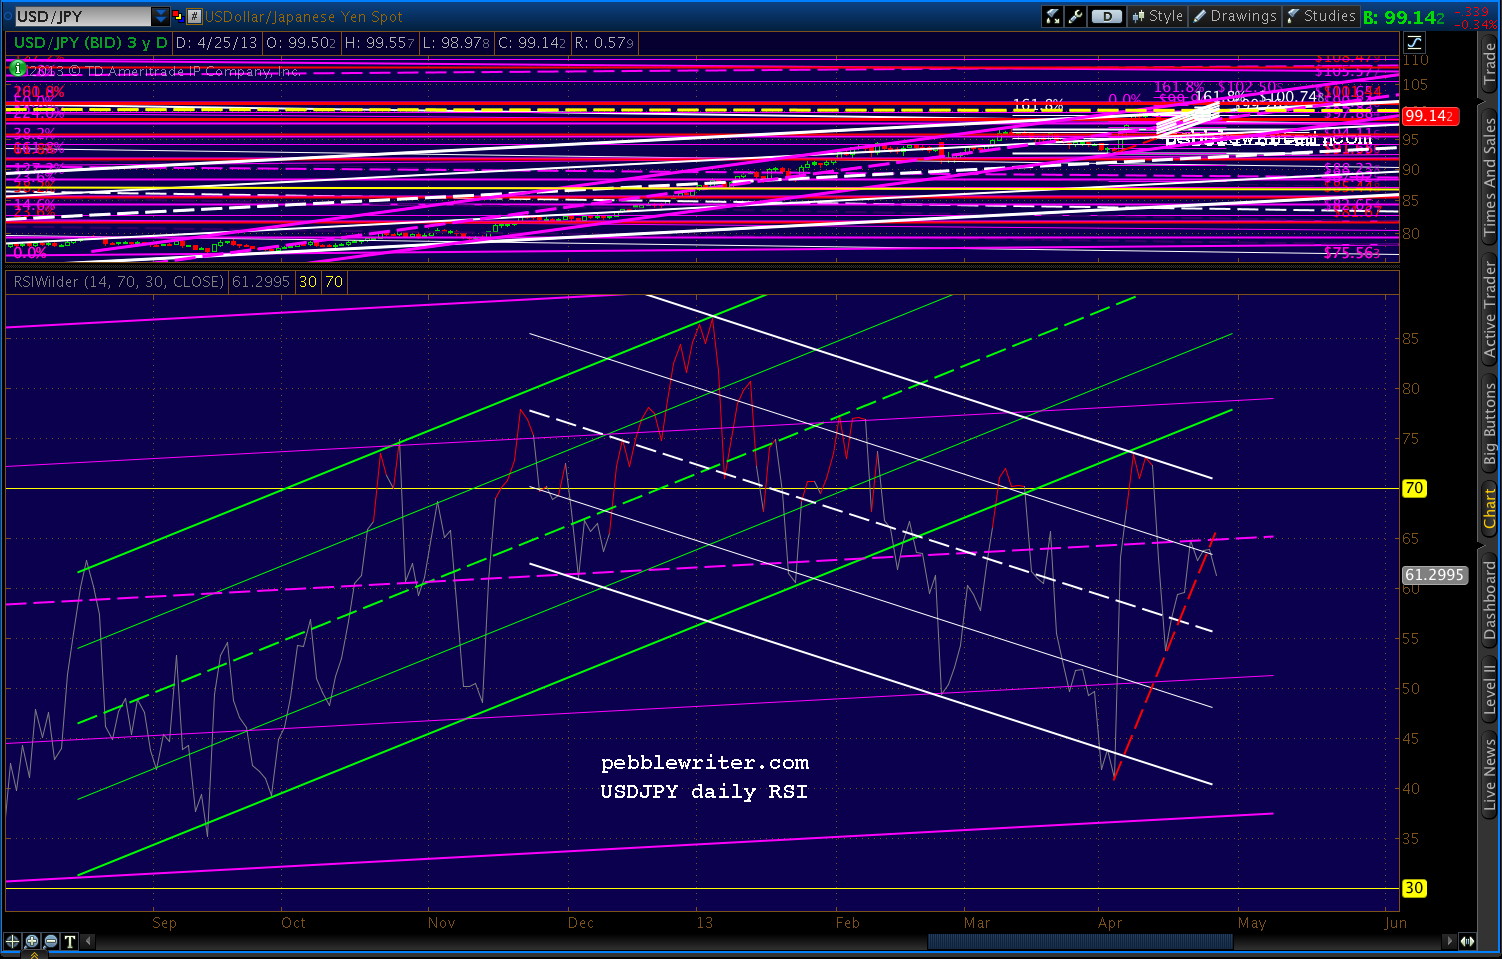
    Daily RSI has backtested the broken yellow channel twice, but the trend is clearly down — with the latest push being rebuffed by the purple midline.

    And, a close-up reveals that a breakdown has already started.

    Stay tuned.

    UPDATE:  9:25 AM EDT

    With SPX set to open 5-6 points higher, it stands a very good chance of reaching our 1584.23 target. In other words, a pop and drop is very much in the cards.

    If it goes any higher, look for 1590.36 instead.

    UPDATE:  9:40 AM

    That’s good enough for me.  I’m closing my long position and reverting to full short here at 1584.80.  Stops around 1586ish.

    The .25 of the purple channel is right around 1587, so I’d use some discretion around that stop level and look to see if there’s any real strength behind a move higher.

    UPDATE:  10:25

    Getting a push through 1587, so I’ll open an interim long position for what should be only a few points higher to the .886.  Core short remains in place.  Tight trailing stops.

    I wouldn’t start getting nervous about the short position until around 1594 — the trend line (red, dashed) that extends from the 2000 and 2007 peaks.

    UPDATE:  10:50 AM

    I’ll go ahead and close that interim long here at 1590.  While I still think there’s potential to the 2000-2007 trend line, it could easily happen after the correction that should begin in the next hour.

    That way, the Inverted H&S Pattern would feature a neckline that’s roughly the same as the purple channel .25 line, and would target the same price level as the 1.618 extension of the 1597-1536 slide: 1635.

    This is a very artfully crafted scenario to justify (from a technical standpoint) a rally above that red TL — which is one of the last remaining technical impediments to a continuation of the rally from 1343 in November.

    Can they pull it off?

    continued for members(more…)